Pulmonary embolism (PE) is a critical cardiovascular condition characterized by blood clots (thrombi) in the pulmonary arteries, ranking as the third most prevalent cardiovascular syndrome globally after myocardial infarction and stroke.1 The incidence is estimated at 39–115 per 100,000 individuals for PE and 53–166 per 100,000 individuals for deep vein thrombosis, resulting in approximately 300,000 annual fatalities in the United States alone.2
The gravity of PE diagnosis is underscored by its high mortality rate when left untreated; 34% of deaths occur either suddenly or within hours of the acute event, before treatment can be administered.3 This mortality risk is particularly concerning given the rising incidence of PE observed in longitudinal studies.4,5,6 The situation has been further exacerbated by the established correlation between PE and COVID-19 infections.7 Computed tomographic pulmonary angiography (CTPA) remains the diagnostic gold standard for the detection of PE.8 However, the increasing hospital workload poses significant challenges for timely diagnosis. Between 2001 and 2011, emergency department CT utilization increased dramatically,9 and healthcare worker burnout continues to rise.10 This combination of time-critical diagnosis requirements and increasing workload creates an urgent need for rapid and accurate patient triage systems.
Computer-assisted detection (CAD) systems for PE have evolved significantly over the past decades. Early approaches relied on traditional image processing techniques based on segmentation and thresholding.11,12 The advent of deep learning, particularly convolutional neural networks (CNNs), has revolutionized the field, demonstrating remarkable capabilities in pattern recognition and detection across various medical imaging tasks.13,14
The detection of PE presents significant challenges due to multiple confounding factors that affect both clinical diagnosis and automated detection systems. Technical artifacts pose a primary challenge, as cardiac and respiratory motion can create linear decreased enhancement in segmental arteries that mimics embolism, and beam hardening from dense contrast in the superior vena cava may obscure visualization of the right pulmonary arteries.15 Variable contrast enhancement patterns, particularly in patients with poor cardiac output, can lead to the mixing of unopacified and opacified blood, creating false-positive findings.16 The complex three-dimensional structure of the pulmonary vasculature further complicates detection, especially for subsegmental PE, in which small vessel size combines with variable image quality to challenge accurate diagnosis.17 Mucus plugs can appear as branching tubular opacities that mimic contrast-filled vessels, and endobronchial blood clots and high-density mucus impaction can simulate PE-like filling defects.18 Anatomical and pathological features, such as distal lung collapse, bronchial dilatation, and bronchiectasis, can obscure or mimic PE-related changes.19 Such complexities have driven the development of increasingly sophisticated CAD systems that must account for these various confounding factors while maintaining high diagnostic performance.
In this work, we review the evolution of PE CAD systems through the lens of detection granularity – from study-level classification to precise voxel-level segmentation (Figure 1). We examine how increasing task complexity has driven methodological innovation while enabling more detailed clinical insights. This progression mirrors the clinical workflow in which initial patient triage leads to detailed PE characterization for treatment planning.
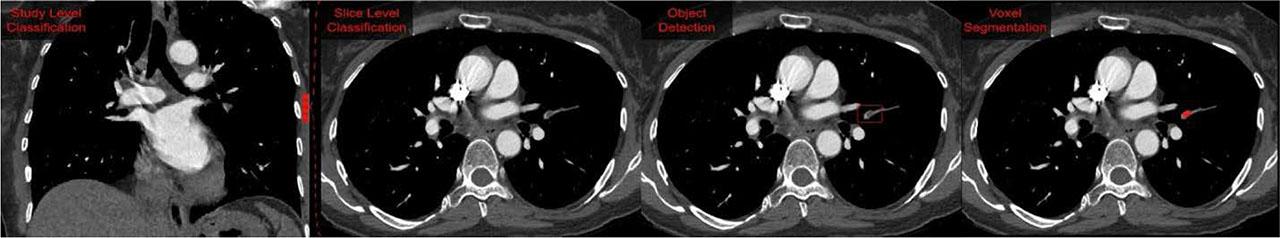
Evolution of PE detection granularity in CAD. Study-level classification provides binary prediction for the entire CTPA volume, enabling rapid triage. Slice-level detection identifies specific axial slices containing PE. Object detection localizes individual emboli through bounding boxes. Voxel-level segmentation enables precise delineation of emboli boundaries and quantitative analysis of clot burden. This progression demonstrates increasing granularity and clinical utility, from initial triage to detailed morphological analysis. Images adapted from the RSPECT dataset.22
Our review methodology focuses on the evolution of PE CAD systems through increasing levels of granularity, examining publications that demonstrate progress in detection capabilities across different scales. We analyze the progression from study-level classification to voxel-level segmentation, focusing on papers that report results on substantial datasets. Furthermore, we examine related CAD tasks in medical imaging to contextualize PE detection within the broader landscape of artificial intelligence (AI)-driven medical applications.
For our study, we focus on the following levels of granularity:
Study/patient level: methods predicting the presence of PE at the study level;
Slice/image level: approaches detecting the presence of PE in individual CT slices;
Object detection/localization: systems providing either a bounding box or a centroid localization of PE;
Precise segmentation: methods performing voxel-level PE segmentation.
The finer granularities can be easily converted to coarser granularities. As such, many applications operate on multiple granularities to augment their models.
The development of PE detection systems has been driven by the availability of public datasets, which have enabled benchmarking and comparison of different approaches. Although many studies rely on private datasets, several public datasets have emerged, offering annotations at different granularity levels. The evolution of publicly available PE datasets reflects the progression in annotation detail and the associated annotation effort required. At the study level, two significant datasets emerge: INSPECT, containing 23,248 CTPA studies with accompanying radiology reports and electronic health record data,20 and RadFusion, a dataset providing 1,794 CT images.21 Moving to slice-level annotations, the RSPECT dataset, released by the Radiological Society of North America, contains 12,195 studies with precise slice-level PE annotations from five clinical sites.22 For object detection tasks, the RSPECT Augmented dataset enhances a subset of 445 PE-positive studies with 30,243 bounding box annotations.23 At the finest granularity level, two datasets stand out: the FUMPE dataset, providing detailed voxel-level segmentations for 35 CTPA studies,24 and the PECTA dataset, containing 205 contrast-enhanced CT scans with precise PE segmentations.25 This progression clearly illustrates the inverse relationship between annotation detail and dataset size: as the annotation granularity increases, the dataset size typically decreases due to the substantial effort required for detailed annotations. Notably, although more granular annotations can be converted to coarser labels (e.g., segmentation masks can generate study-level labels), the reverse is not possible, making these detailed annotations particularly valuable despite their limited availability. An overview of public PE datasets is presented in Table 1.
Publicly available PE datasets. The progression from study-level to voxel-level annotations shows the inverse relationship between annotation detail and dataset size, reflecting the increased annotation effort required for more detailed labels.
| Dataset | Annotation type | Size (scans) |
|---|---|---|
| INSPECT20 | Study-level | 23,248 |
| RadFusion21 | Study-level | 1,794 |
| RSPECT22 | Slice-level | 12,195 |
| RSPECT Augmented23 | Bounding boxes | 445 |
| FUMPE24 | Voxel segmentation | 35 |
| PE-CTA25 | Voxel segmentation | 205 |
Several core metrics are used for the evaluation of PE detection systems across different granularities. In the formulas below, TP stands for true positives, TN for true negatives, FP for false positives, and FN for false negatives.
Sensitivity (recall): measures the proportion of true positive cases correctly identified.
Specificity: quantifies the proportion of true negative cases correctly identified.
Positive predictive value (PPV): measures the proportion of positive predictions that are correct.
Negative predictive value (NPV): measures the proportion of negative predictions that are correct.
F1 Score: represents the harmonic mean of sensitivity and PPV, providing a balanced performance measure.
Area under the receiver operating characteristic curve (AUC-ROC): evaluates discriminative ability across different thresholds by plotting sensitivity against (1 − specificity);
Area under the precision-recall curve (AUC-PR): evaluates performance across different thresholds by plotting PPV against sensitivity, calculated as:
AP = \sum\limits_n {({\rm{Sensitivit}}{{\rm{y}}_n}} - {\rm{Sensitivit}}{{\rm{y}}_{n - 1}}) \times {\rm{PP}}{{\rm{V}}_n} False positive per case (FP/case): evaluates the number of false positive PEs predicted per case.
The CAD of PE has evolved significantly over the past two decades, progressing through multiple levels of detection granularity. This evolution reflects both technological advances in deep learning and increasing clinical requirements for precise PE characterization. We present a comprehensive analysis of PE detection methods across four distinct granularity levels: study-level classification for rapid triage, slice-level detection for region identification, object detection for precise localization, and voxel-level segmentation for detailed morphological analysis. For each level, we examine the progression of methodological approaches, performance metrics, and clinical utility.
Study-level detection represents the most fundamental granularity of PE CAD, in which the system aims to classify an entire CTPA study as either positive or negative for the presence of PE.22 This foundational task serves several critical clinical purposes that directly impact patient care and workflow optimization.
The primary value of study-level classification lies in its ability to enable the rapid triage of positive cases in emergency settings. This capability is particularly crucial given that 34% of PE-related deaths occur within hours of the acute event.3 Beyond immediate triage, these systems help manage increasing hospital CT utilization through efficient prescreening, addressing the rising incidence of PE cases and their correlation with COVID-19.7 The systems also function as a vital safety net, acting as a second reader to prevent missed Pes, a critical function given that untreated cases are associated with mortality rates of up to 30%.3
The evolution of study-level PE detection systems has shown remarkable progress over the past two decades. Early work by Masutani et al. in 2002 showed initial feasibility with perfect sensitivity but suffered from high false positive rates (7.7 per patient).26 Clinical integration studies by Engelke et al. evaluated commercial CAD systems as second readers, achieving modest sensitivity of 30.7% at 4.1 false positives per patient, though notably improving radiologists’ performance from 77–93% to 83–96%.27
The advent of deep learning marked a significant turning point. Tajbakhsh et al. have pioneered the application of CNNs for PE detection, achieving 83% sensitivity on internal testing, though performance dropped to 34.6% sensitivity at two false positives per examination on external validation.28 Architecture improvements followed, with Huang et al.’s PENet achieving 75% sensitivity with 81% specificity on 200 external CTPA examinations.29 Kahraman et al. introduced a novel two-stage solution combining 2D U-Net and long short-term memory, achieving AUROCs of 0.70 for subsegmental/segmental PE and 0.85 for main pulmonary artery PE.30
Recent years have seen substantial performance improvements. ResNet-based approaches have achieved 92.7% sensitivity with 95.5% specificity at the patient level on 1,465 CTPA examinations.31 The latest work using the nnU-Net architecture achieved 96% sensitivity (95% CI: 91–98%) and 95% specificity (95% CI: 92–96%) on internal validation, with comparable performance on external datasets.32
An overview of the evolution of study-level performance in PECAD systems is presented in Table 2, illustrating the transition from classical computer vision algorithms (e.g., thresholding, feature engineering) in early studies (2002–2014) to modern deep learning architectures from 2015 onward.
Evolution of study-level PE detection method performance (2002–2024). The progression shows significant improvement from early approaches with high false positive rates to modern AI systems achieving better balance between sensitivity and specificity.
| Author | Year | Sensitivity (%) | Specificity (%) | False positive PEs/case | PPV (%) | F1 (%) | Train size (scans) | Test size (scans) |
|---|---|---|---|---|---|---|---|---|
| Masutani et al.26 | 2002 | 100.0/85.0* | – | 7.7/2.6 | 11 | 19.8 | 11 | 19 |
| Pichon et al.12 | 2004 | 86 | – | 6.3 | – | – | 6 | |
| Maizlin et al.33 | 2007 | 53.3 | 77.5 | 1 | 28.5 | 37.4 | – | 104 |
| Engelke et al.27 | 2008 | 30.7 | – | 4.1 | – | – | 56 | |
| Das et al.35 | 2008 | 83 | 80 | 4 | – | – | 43 | |
| Zhou et al.36 | 2009 | 80 | – | 18.9 | 59 | 6 | ||
| Wittenberg et al.34 | 2010 | 94 | 21 | 4.7 | – | 292 | ||
| Tajbakhsh et al.28 | 2015 | 83.4 | – | 2 | – | 121 | ||
| Huang et al.29 | 2020 | 75 | 81 | – | 77 | 75.9 | 1461 | 369 |
| Weikert et al.31 | 2020 | 92.7 | 95.5 | 0.12 | 86 | 28,000 | 1,465 | |
| Ma et al.37 | 2022 | 86 | 85 | – | – | – | 5,292 | 1,000 |
| Condrea et al.32 | 2024 | 92.9 | 96.1 | 0.15 | – | 91 | 6,133 | 836 |
| Doğan et al.38 | 2024 | 96.2 | 93.4 | – | – | – | 38 | 12 |
Slice-level detection of PE represents a critical intermediate approach in computer-assisted diagnosis, operating at the granularity of individual axial slices or a small number of slices within CTPAs. This methodology bridges the gap between coarse study-level classification and fine-grained voxel-level segmentation, addressing several key clinical needs. The clinical significance of slice-level detection manifests in multiple aspects. First, it enables targeted analysis by directing radiologists to specific suspicious regions, thereby reducing the risk of oversight in time-critical diagnoses. Second, this approach facilitates burden quantification through semi-quantitative assessment of thrombus load across slices. Third, it optimizes clinical workflow by prioritizing the review of high-probability slices within large CTPA volumes.
The RSPECT dataset22 represented a key contribution for this level of granularity, enabling the development of complex PE CAD solutions given its public nature and generous size.
Finally, slice-level detection serves as a foundational step for more sophisticated detection tasks, providing preprocessed data for object detection and segmentation models. This structured approach aligns with both clinical workflow requirements and the natural progression of computer vision tasks in medical imaging.
Table 3 presents several PECAD solutions that have obtained notable results.
Performance comparison of slice-level PE detection methods. The table summarizes sensitivity, specificity, and AUC values reported in recent studies, showing the evolution of detection capabilities across different architectures and datasets.
| Author | Year | Sensitivity (%) | Specificity (%) | AUC (%) | Train size (scans) | Test size (scans) |
|---|---|---|---|---|---|---|
| RSNA Kaggle Challenge 1st place22 | 2020 | – | – | 96.2 | 7,279 | 2,000 |
| Ajmera et al.18 | 2022 | 93 | 89 | 94 | 853 | 340 |
| Huhtanen et al.39 | 2022 | 86 | 93 | 94 | 600 | 200 |
| Ma et al.37 | 2022 | 86 | 85 | 92.6 | 5,292 | 2,000 |
Following study-level and slice-level classification, the precise localization of pulmonary emboli represents a critical step toward the clinical deployment of CAD systems. This task aims to identify the exact location of emboli within CT slices, providing radiologists with specific regions of interest for examination. Two main approaches have emerged in the literature, each with distinct advantages for clinical applications.
The classical object detection approach employs rectangular bounding boxes to delineate regions containing emboli. These predictions include both the spatial location and extent of the embolus, along with a confidence score indicating the model’s certainty. This approach aligns well with radiologists’ workflow, as it highlights regions requiring attention while providing context through the surrounding tissue visualization.
An alternative methodology focuses on centroid prediction, which is particularly valuable in case of smaller subsegmental emboli for which precise localization is crucial. Rather than defining boundaries, this approach identifies the central point of each embolus, enabling precise localization without costly annotations.
The evaluation of these approaches uses metrics designed to reflect clinical utility. For bounding box detection, mean Average Precision (mAP) measures both localization accuracy and detection confidence, with a detection considered correct when the predicted box sufficiently overlaps with the ground truth annotation. The field has adopted standard thresholds from computer vision, requiring 50% overlap for a positive detection, while also evaluating performance across multiple overlap thresholds to ensure robust localization. Quantitative metrics focused on bounding box detection performance are detailed in Table 4, whereas Table 5 presents a comprehensive analysis of per-embolus localization approaches across methodologies and evaluation protocols.
Bounding box detection performance for PE detection. Results reported at mAP at 0.5 IoU. Due to the very small amount of data available and the granularity of the task, dataset sizes are reported in number of annotated images.
| Author | Year | mAP at 0.5 IoU | Train size (scans) | Test size (scans) |
|---|---|---|---|---|
| Long et al.40 | 2021 | 80.9 | 8,792 | 304 |
| Kiourt et al.41 | 2021 | 68 | 673 | – |
| Xu et al.42 | 2023 | 72.7 | 71,488 | 17,328 |
| Bushra et al.43 | 2024 | 84.6 | 6,219 | 2,573 |
Per-embolus localization performance in PE detection. Note: Direct comparison between methods should be made with caution due to varying evaluation protocols and matching criteria between predicted and ground truth emboli.
| Author | Year | Recall | PPV | F1 | Train size (scans) | Test size (scans) |
|---|---|---|---|---|---|---|
| Özkan et al.44 | 2014 | 95.1 | 52.6 | 67.7 | 142 | 33 |
| Tajbakhsh et al.28 | 2015 | 83.4 | 47.2 | 60.3 | 121 | 20 |
| Tajbakhsh et al.45 | 2019 | 32.9 | 98.6 | 49.4 | 121 | 20 |
| Weikert et al.31 | 2020 | 82.2 | 86.8 | 85.8 | 30,000 | 1,465 |
| Xu et al.42 | 2023 | 93.2 | 51.2 | 66.1 | 113 | – |
| Pu et al.46 WSL* | 2023 | 61.8 | 78.2 | 69.1 | 6,415 | 91 |
| Zhu et al.47 | 2024 | 86 | 61.3 | 71.6 | 142 | 410 |
| Condrea et al.48 WSL* | 2024 | 66.9 | 77.0 | 71.6 | 11329 | 445 |
| Condrea et al.48 Finetune** | 2024 | 73.9 | 77.5 | 75.5 | 111 | 334 |
Weakly supervised learning requiring no human annotations
Finetuned weakly supervised model on human annotations
Centroid-based detection employs a more direct evaluation approach, measuring the physical distance between the predicted and the actual embolus centers. Clinical relevance guides the acceptance thresholds, with predictions typically considered correct when they are within 2 mm, 5 mm, or 10 mm of the ground truth, reflecting different levels of precision requirements for central versus subsegmental emboli. The development and validation of these approaches has been greatly facilitated by the RSPECT Augmented dataset, which provides 30,243 detailed bounding box annotations across 445 positive studies.18 This resource has established benchmarks for localization performance while highlighting the complementary nature of both detection approaches – bounding boxes for larger central emboli and centroid prediction for precise subsegmental localization.
Voxel-level segmentation represents the highest granularity in PE detection, providing precise delineation of emboli boundaries within CTPA volumes.48 This approach enables quantitative analysis of clot burden and morphological characteristics, critical metrics for treatment planning and monitoring.49 Although it is more computationally intensive than coarser detection methods, segmentation offers unique capabilities for clinical decision support.50 The clinical significance of precise PE segmentation manifests in several key applications. The volumetric quantification of clot burden provides objective measures for disease severity assessment and treatment response monitoring.20,49 Morphological analysis through detailed segmentation enables the evaluation of PE chronicity and distribution patterns.28 Additionally, enhanced visualization through segmentation masks supports surgical planning and resident training.28
The quantitative assessment of PE segmentation accuracy uses multiple complementary metrics, each capturing different aspects of segmentation quality. These metrics can be broadly categorized into overlap-based measures and boundary accuracy assessments, providing a comprehensive evaluation framework for clinical validation.
Overlap-based metrics primarily assess the volumetric agreement between predicted and ground truth segmentations. The Dice similarity coefficient (DSC), calculated as:
Boundary accuracy metrics evaluate the precision of segmentation contours, crucial for clinical applications requiring exact delineation. The average surface distance measures the mean distance between predicted and ground truth boundaries. The Hausdorff distance captures maximum surface deviations, particularly important for identifying worst-case segmentation errors that could affect clinical decision-making.
The combination of these metrics provides a robust framework for evaluating segmentation performance, ensuring both general accuracy through overlap measures and precise boundary delineation necessary for clinical applications. This multimetric approach enables comprehensive validation of segmentation algorithms, essential for clinical deployment. Performance evolution of PE segmentation models is shown in Table 6, focusing on the widely reported DSC metric.
Performance of PE segmentation Methods. Results show the progression of segmentation accuracy using the DSC and other relevant metrics.
| Author | Year | DSC | Train size (scans) | Test size (scans) |
|---|---|---|---|---|
| Cano-Espinosa et al.52 | 2020 | 48.5 | 60 | 20 |
| Long et al.40 | 2021 | 74.7 | – | – |
| Liu et al.51** | 2022 | 96.65 | – | – |
| Han et al.53 | 2023 | 86.20 | 11 | 4 |
| Olescki et al.54 | 2023 | 81 | – | – |
| Pu et al.46 WSL* | 2023 | 64.7 | 6,415 | 91 |
| Doğan et al.38 | 2024 | 96.2 | 800 | 216 |
Weakly supervised learning requiring no human annotations.
Segmenting only central PEs.
PE CAD represents an ever-advancing field, with significant progress from early rule-based systems to current deep learning approaches. The evolution spans multiple detection granularities, from study-level classification to precise voxel-level segmentation, each contributing unique clinical value. Further advances could bring additional clinical value, either through the prediction of additional PE-related tasks, or through further integration in the clinical context. Below we present some opportunities to further expand the scope of PE CAD systems.
The quantitative assessment of PE burden has demonstrated significant correlations with clinical outcomes and cardiac function. Volumetric clot measurements show strong correlation with established semi-quantitative measures like the Qanadli score (ρ = 0.841, p < 0.01) and the Mastora score (ρ = 0.863, p < 0.01).55 Clot volume has shown moderate correlation with right ventricular dysfunction, measured through the right ventricle-to-left ventricle ratio (r = 0.392, p < 0.00163). This relationship between clot burden and cardiac strain is particularly relevant for risk stratification, as an increased right ventricle-to-left ventricle ratio serves as an independent predictor of mortality in acute pulmonary embolism.55 Recent studies have shown that the quantitative volumetric measurement of total embolic volume correlates positively with right ventricular dysfunction assessed through both imaging and clinical parameters.57
Outcome prediction represents a critical advancement in the management of PE. The INSPECT dataset enables prediction of several critical outcomes, with varying incidence rates and timeframes. Chronic thromboembolic pulmonary hypertension develops in 2.8–3.8% of patients with acute PE within 2 years of the initial event.55,57 Risk factors for the development of chronic thromboembolic pulmonary hypertension include recurrent venous thromboembolism (OR = 2.57), unprovoked PE (OR = 2.71), elevated factor VIII levels, and antiphospholipid antibodies.55,56 Disease outcomes and mortality rates vary significantly based on comorbidities, with increased risks observed in patients with cancer, chronic inflammatory disorders, or prior splenectomy.58,59 The INSPECT data-set, containing 23,248 CTPA studies from 19,402 patients, provides comprehensive longitudinal data for validating predictive models of these outcomes.20
The integration of multiple data sources reflects the natural clinical workflow in which radiologists routinely combine imaging findings with patient context for diagnosis and treatment planning. Recent studies demonstrate that multimodal fusion models combining CT imaging with electronic health records significantly outperform single-modality approaches, achieving an AUROC of 0.947 (95% CI: 0.946–0.948), representing an 15.6% improvement over imaging-only models.29 The INSPECT dataset facilitates this integration by providing comprehensive patient data, including demographics, diagnoses, procedures, vitals, and medications, alongside imaging data.20 This multimodal approach shows particular promise in improving both model performance and clinical utility, with fusion models demonstrating up to 14% improvement over single-modality model approaches.29 Such integration aligns with clinical practice, where patient history and clinical parameters guide interpretation and risk stratification, potentially enabling more nuanced and contextually aware diagnostic support systems.
The CAD of PE has evolved significantly, progressing from simple binary classification at the study level to sophisticated voxel-wise analysis. This evolution mirrors the increasing clinical demands for precise quantification and characterization of PE. Our review traces this progression through the main detection granularities: study-level classification, which enables rapid triage of CTPA studies; slice-level detection, which directs radiologists to specific regions of interest; PE localization, which enables improving the PE clinical workflow; and voxel-level segmentation, which enables precise quantification of clot burden and distribution patterns.
Recent advances in deep learning have dramatically improved performance across all granularity levels. Study-level classification now achieves sensitivity above 90% with minimal false positives, slice-level detection provides precise localization with high specificity, and voxel-level segmentation enables detailed morphological analysis. These improvements, coupled with increasing dataset availability and standardization of evaluation metrics, have enhanced the clinical utility of PE CAD systems.
The field continues to advance toward more comprehensive analysis of PE, integrating multiple data sources and providing increasingly sophisticated clinical decision support. As these systems mature, they promise to not only assist in PE detection but also contribute to risk stratification, treatment planning, and outcome prediction, ultimately improving patient care through more precise and efficient diagnosis.