
Fig. 1.
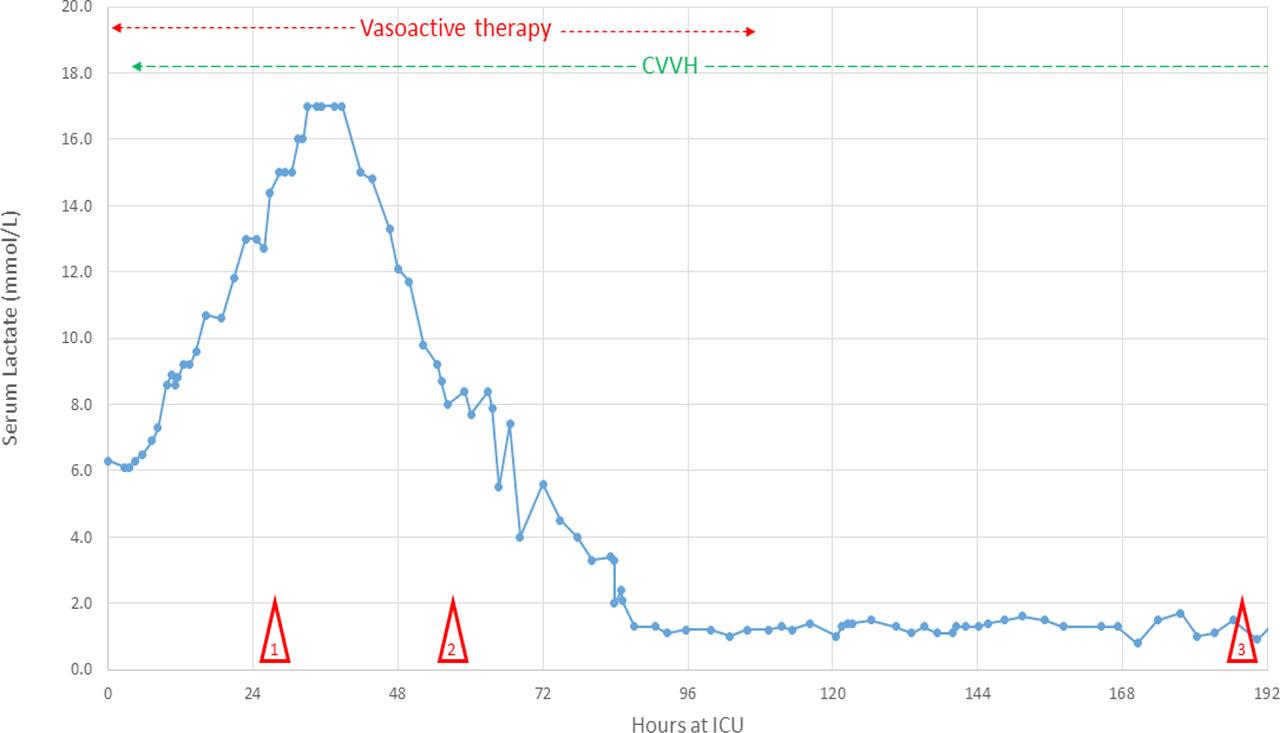
Fig. 2.
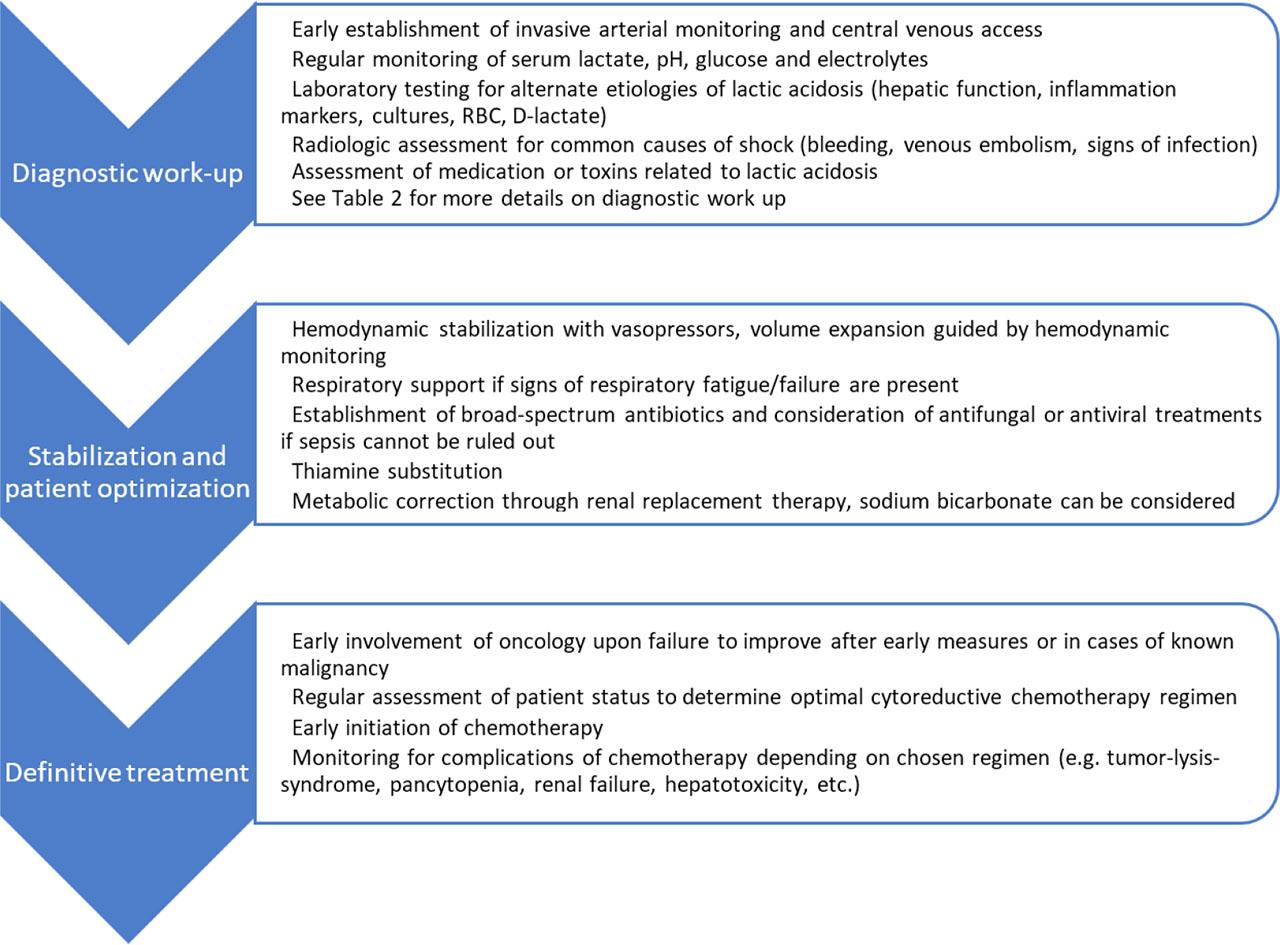
Diagnostic approach to metabolic derangements
| Possible cause of lactatemia | Reason for exclusion |
|---|---|
| Hepatic failure | Adequate hepatic function in clinical and laboratory testing (bilirubin, INR, albumin, ascites, ammonium) |
| Hypoperfusion | Adequate cardiac output in invasive arterial monitoring |
| Sepsis | Persistence of disturbances after initiation of broad-spectrum antibiotics without evidence of resistant organisms in cultures, clinically apparent infection or signs of infection in diagnostic imaging |
| Respiratory failure | Persistence after adequate oxygenation and respiratory support |
| Thiamine-deficiency | Persistence after thiamine substitution (300mg/day) |
| Propofol-induced lactic acidosis | Persistence after switch to benzodiazepine-based sedation |
| D-lactic acidosis | Normal d-lactate in laboratory testing |
| Medication or toxins | No exposure to possible causative agents |
Laboratory values at hospital admission and at peak lactate level
| Laboratory parameter | Value at hospital admission | Value at peak lactate | Normal reference range |
|---|---|---|---|
| Hemoglobin | 14.6 g/dL | 11.0 g/dL | 14.1 – 17.5 g/dL |
| Thrombocytes | 89’000/μL | 65’000/μL | 150’000 – 450’000/μL |
| White blood cells | 6’720/μL | 10’200/μL | 3’700 – 11’200/μL |
| CRP | 80 mg/L | 45.6 mg/L | < 5 mg/L |
| Creatinine | 1.31 mg/dL | 1.71 mg/dL | 0.7 – 1.2 mg/dL |
| Potassium | 4.4 mmol/L | 4.3 mmol/L | 3.5 – 4.9 mmol/L |
| Phosphate | 4.1 mg/dL | 3.8 mg/dL | 2.5 – 4.5 mg/dL |
| Uric acid | 7.9 mg/dL | 3.0 mg/dL | 3.4 – 7.0 mg/dL |
| ALT | 61 U/L | 116 U/L | 10 – 50 U/L |
| AST | 86 U/L | 587 U/L | 10 – 50 U/L |
| Alkaline phosphatase | 175 U/L | 415 U/L | 40 – 130 U/L |
| Bilirubin | 0.9 mg/dL | 3.0 mg/dL | < 1.2 mg/dL |
| Lactate dehydrogenase | 653 U/L | 3343 U/L | 135 – 225 U/L |
| Lactate | NA | 17 mmol/L | 0.5 – 1.6 mmol/L |