
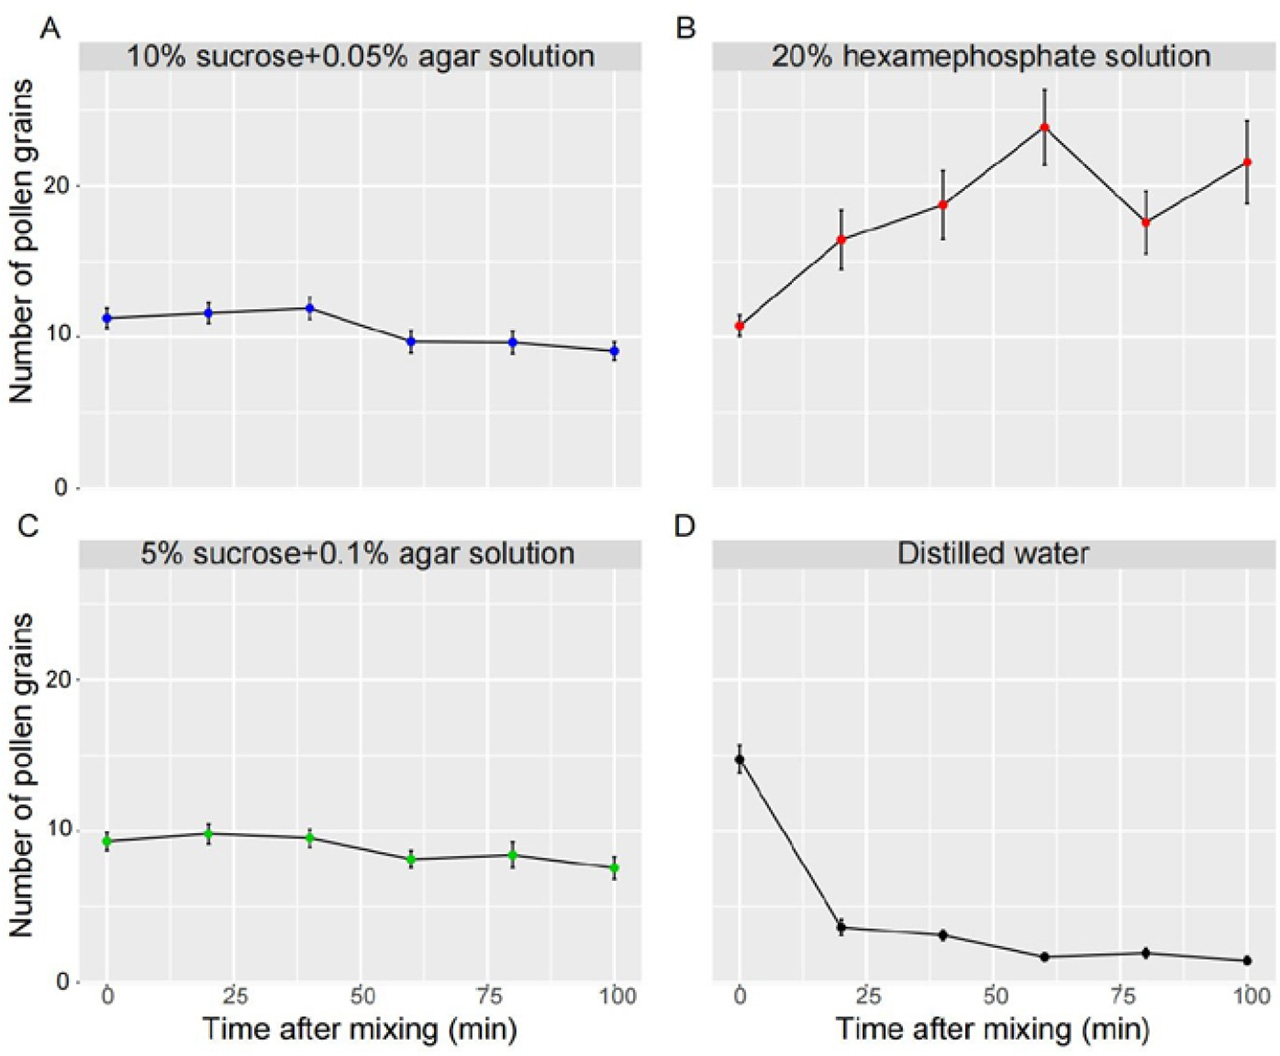
Fig. 1.
The number of pollen grains in 5 μl of a suspension solution pipetted from a 1-cm depth below the liquid surface was counted by hemocytometry after different standing times in four suspension solutions (A. 10% sucrose + 0.05% agar solution, B. 20% sodium hexametaphosphate solution, C. 5% sucrose + 0.1% agar solution and D. distilled water). Data are presented as the means ± SEs.
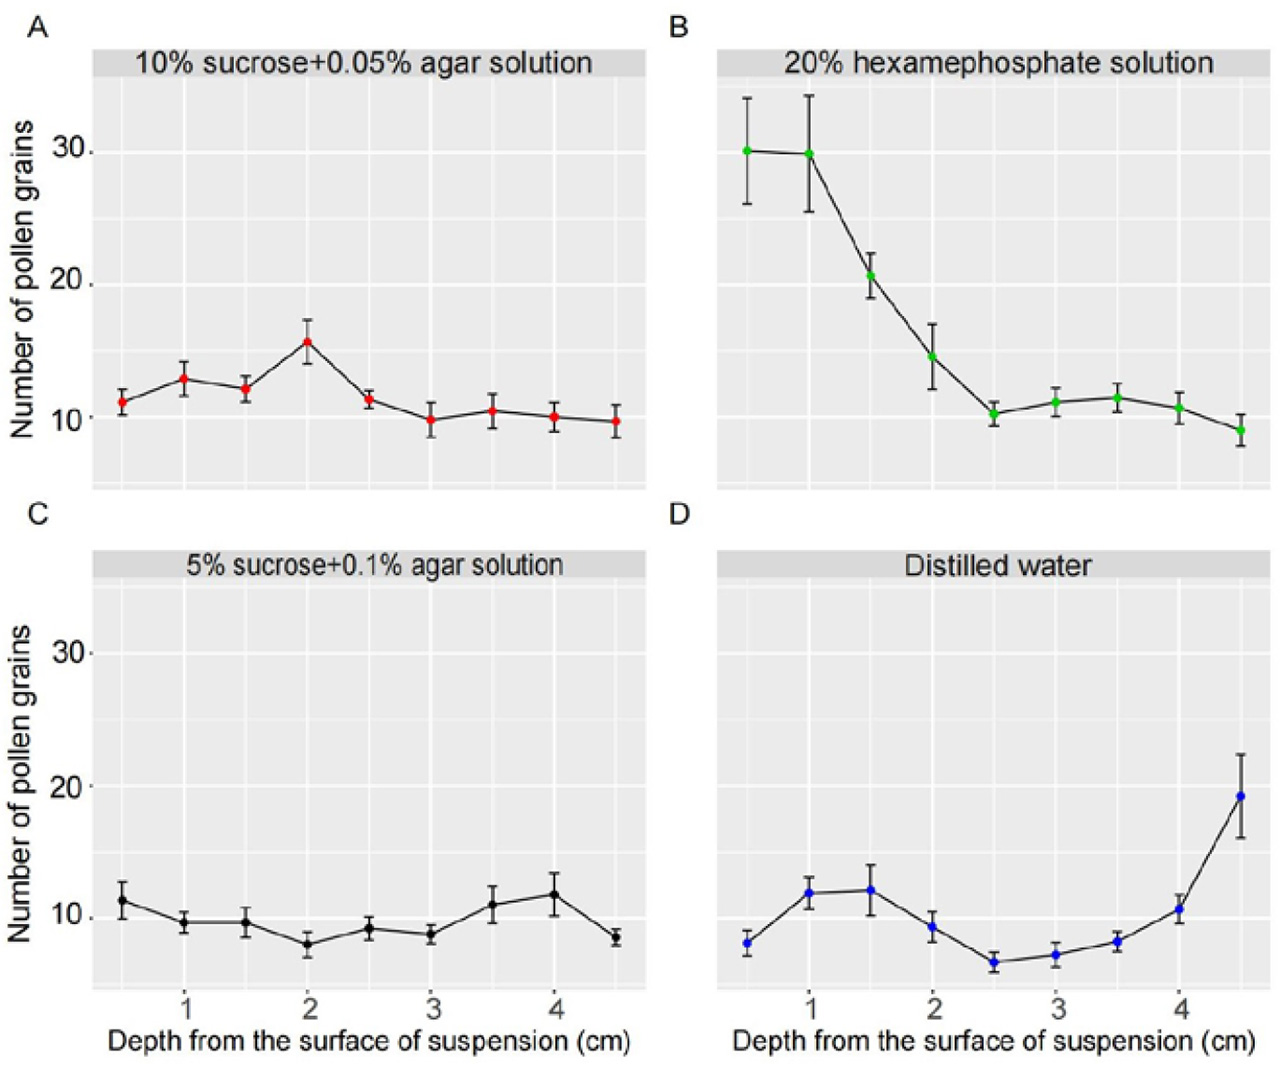
Fig. 2.
The number of pollen grains in 5 μl of a suspension solution pipetted from different depths below the liquid surface was counted by hemocytometry in four suspension solutions (A. 10% sucrose + 0.05% agar solution, B. 20% sodium hexametaphosphate solution, C. 5% sucrose + 0.1% agar solution and D. distilled water). Data are presented as the means ± SEs.
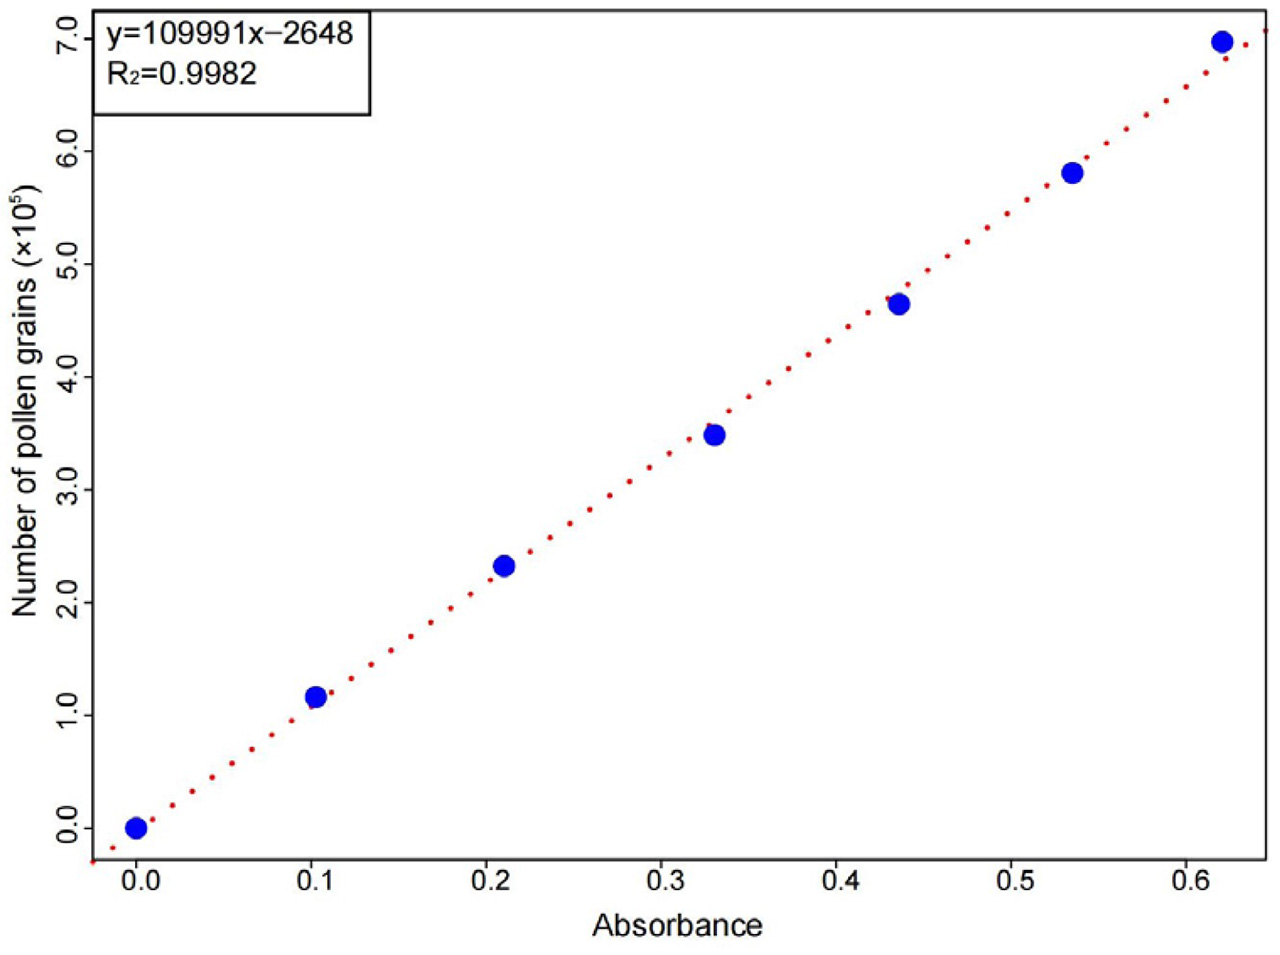
Fig. 3.
The linear relationship between the number of pollen grains in 5 μl of a 5% sucrose + 0.1% agar suspension solution assessed by hemocytometry under microscopy and the absorbance measured by light spectroscopy at a wavelength of 425 nm.
Table 1.
Number of pollen grains per flower in five oilseed rape cultivars
| Cultivar | Initial flowering stage | Full bloom stage | Final flowering stage |
|---|---|---|---|
| AYW | 180524.23 ± 12083.10c | 252715.64 ± 7947.12bc | 136014.13 ± 5573.03c |
| HHY998 | 181954.12 ± 14039.44c | 242706.37 ± 9721.72c | 147306.64 ± 7737.18bc |
| ND21 | 276730.56 ± 12619.33a | 270571.01 ± 8632.42b | 215685.00 ± 9261.30a |
| DHY | 217958.17 ± 13535.64b | 314539.30 ± 9816.28a | 168168.46 ± 8056.94b |
| HYXL | 175464.60 ± 9152.36c | 270131.04 ± 7004.21b | 160029.05 ± 6928.05bc |
| P value | 0.00 | 0.00 | 0.00 |
[i] Data are presented as the means ± SEs. Identical lowercase letters indicate no significant difference (p>0.05); different lowercase letters indicate a significant difference (p<0.01).
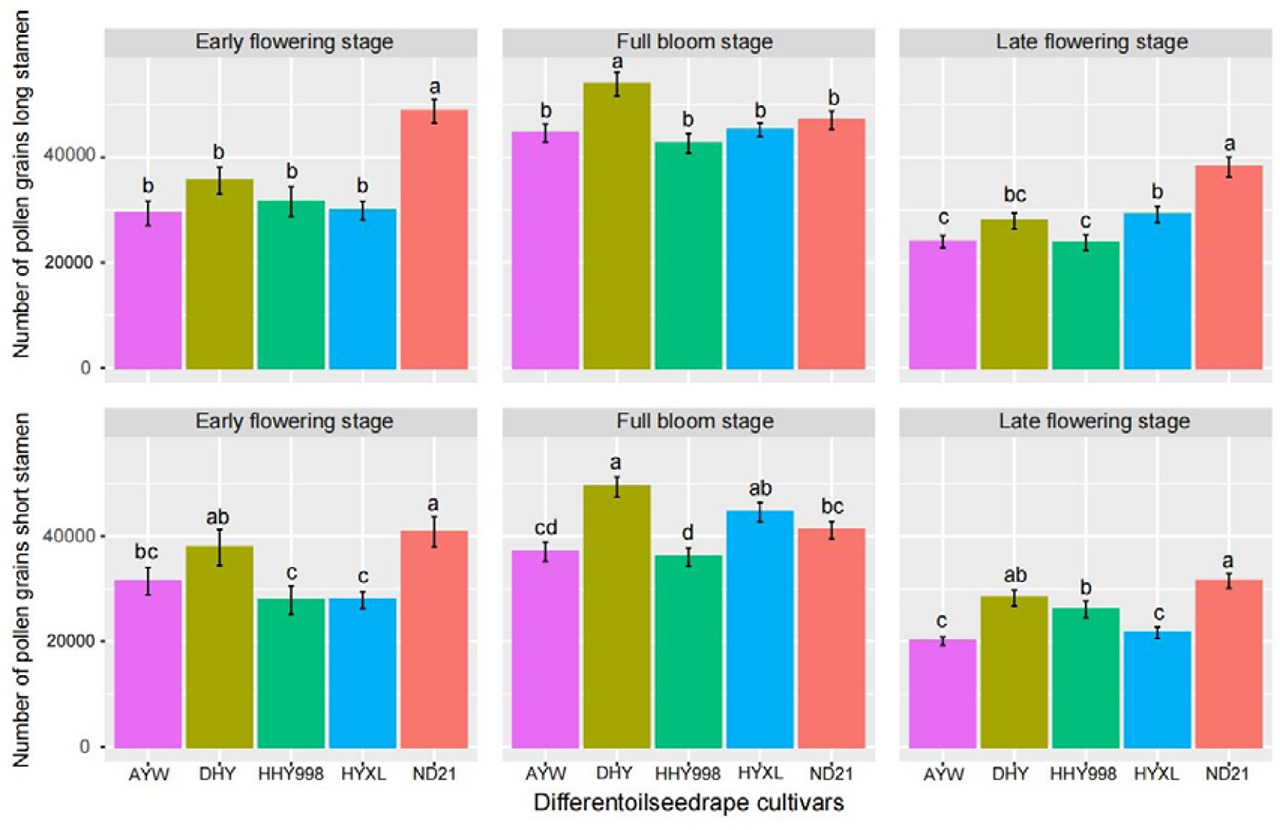
Fig. 4.
Pollen count per anther at different flowering stages and on stamens of different lengths among five oilseed rape cultivars. Data are presented as the means ± SEs. Identical lowercase letters indicate no significant difference (p>0.05); different lowercase letters indicate a significant difference (p<0.05).