
Table 1.
Mercury content in individual honey samples
| No. sample | Honey variety/country of origin | Mean± SD [μg/kg] | No. sample | Honey variety | Mean± SD [μg/kg] |
|---|---|---|---|---|---|
| 1 | MT/Poland | n.d. | 24 | L/Europe | 0.1157±0.0817 |
| 2 | MT/Poland | n.d. | 25 | L/Europe | n.d. |
| 3 | MT/Poland | 0.1273±0.0734 | 26 | L/Europe | 0.1112±0.0786 |
| 4 | MT/Europe and abroad | n.d. | 27 | L/Europe and abroad | 0.1159±0.0818 |
| 5 | MT/Europe and abroad | n.d. | 28 | L/Poland | 0.1041±0.0735 |
| 6 | MT/Europe | 0.2636±0.1520 | 29 | L/Poland | n.d. |
| 7 | MT/Poland | n.d. | 30 | B/Poland | n.d. |
| 8 | MT/Poland | 0.2743±0.1582 | 31 | B/Poland | 0.2031±0.1434 |
| 9 | MT/Europe and abroad | 0.1136±0.0655 | 32 | B/Europe and abroad | n.d. |
| 10 | MT/Ukraine and Bulgaria | n.d. | 33 | B/Poland | n.d. |
| 11 | MT/Poland | n.d. | 34 | A/Ukraine and Italy | n.d. |
| 12 | MT/Poland | n.d. | 35 | A/Poland | 0.1309±0.0925 |
| 13 | MT/Poland | n.d. | 36 | A/Europe and abroad | 0.5383±0.3802 |
| 14 | MT/Europe and abroad | 0.2958±0.2088 | 37 | CH/Italy | 0.8119±0.4683 |
| 15 | MT/Europe and abroad | n.d. | 38 | CH/Poland | 0.5773±0.3330 |
| 16 | MT/Europe and abroad | 0.1823±0.1287 | 39 | CH/Poland | n.d. |
| 17 | MT/Europe and abroad | n.d. | 40 | R/Poland | 0.6731±0.4754 |
| 18 | MT/Europe and abroad | 0.5915±0.4178 | 41 | H/Spain | 0.2390±0.1689 |
| 19 | MT/Poland | 0.3263±0.2306 | 42 | LH/Europe | n.d. |
| 20 | MT/Europe and abroad | 0.1367±0.0966 | 43 | T/Spain | 0.5214±0.3007 |
| 21 | MT/Ukraine | n.d. | 44 | E/Uruguay | 0.4339±0.2502 |
| 22 | MT/Poland | n.d. | 45 | C/Italy | 0.3441±0.1985 |
| 23 | L/Poland | 0.1159±0.0818 |
[i] n.d. - not detected
[ii] MT-multifloral, L-linden, B-buckwheat, A-acacia, CH-coniferous honeydew, R-rape, H-heather, LH-leafy honeydew, T-thyme, E-eucalyptus, C-coriander
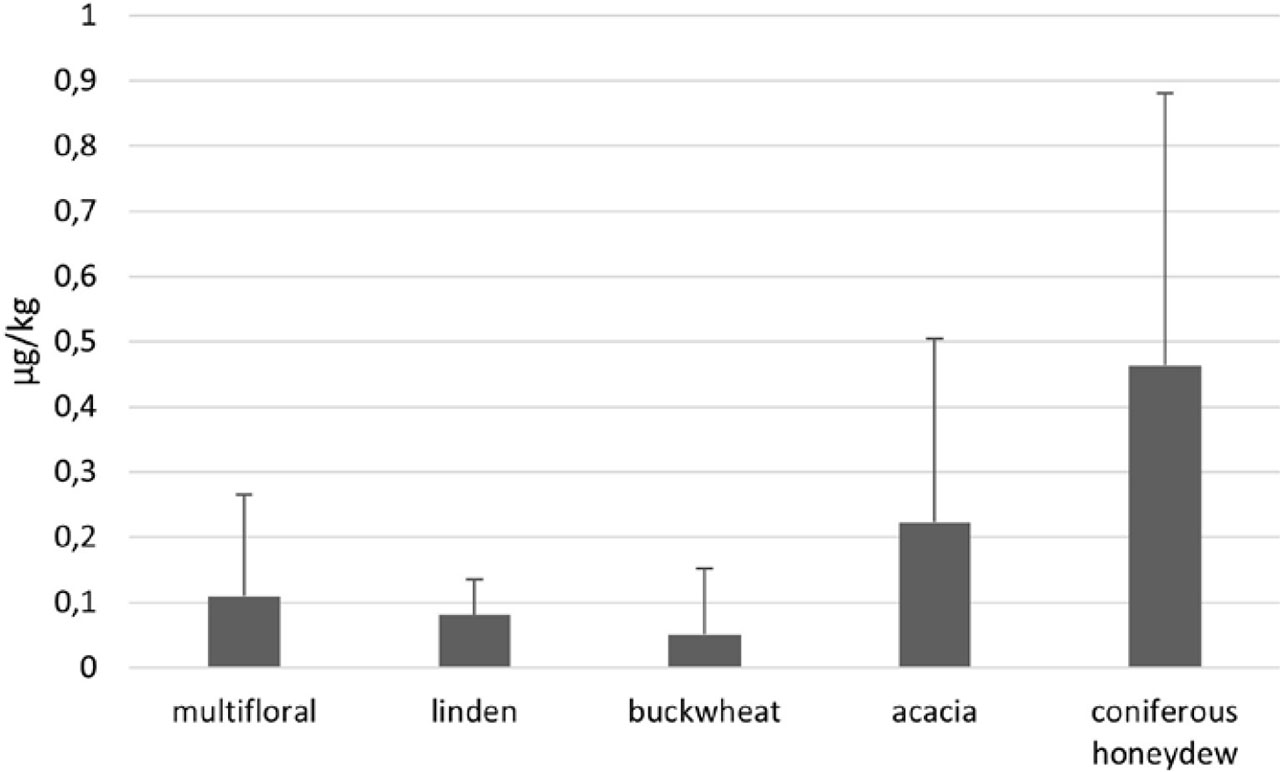
Fig. 1.
Mercury content (μg/kg) in individual honey varieties (average ± SD; p>0.05).
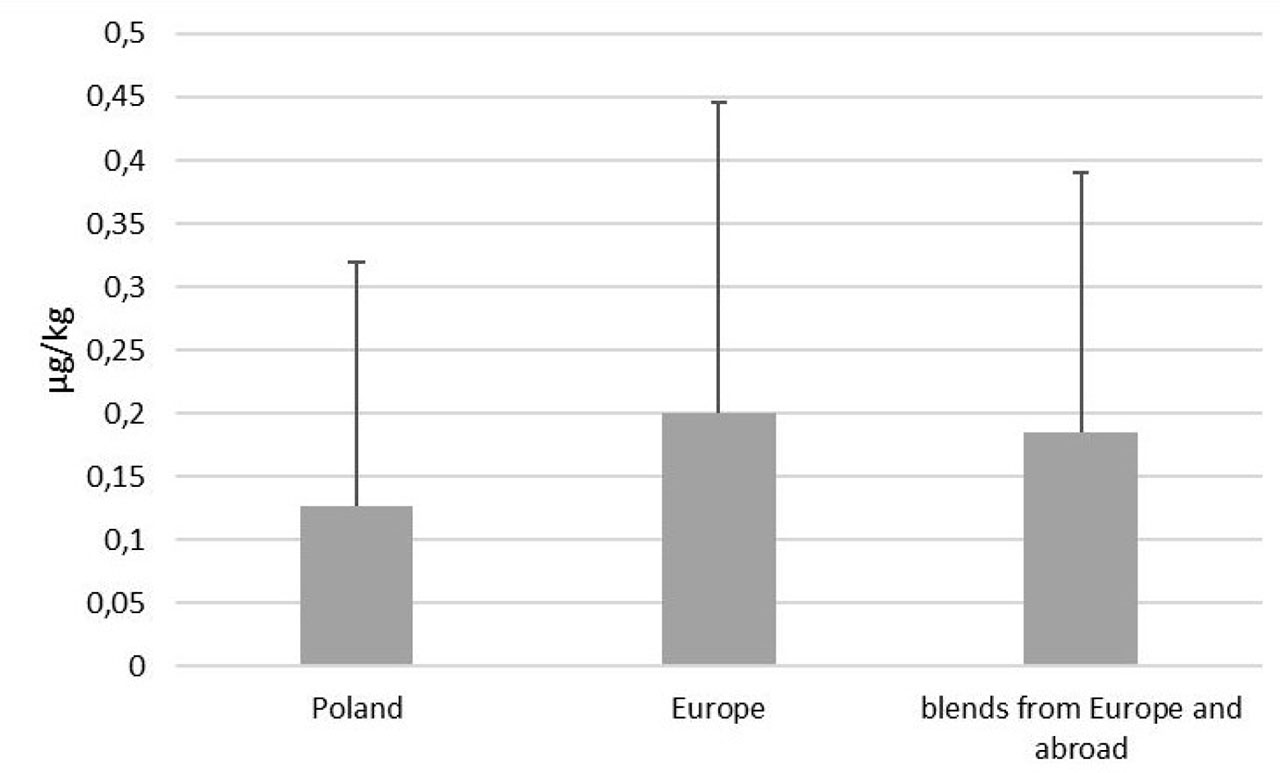
Fig. 2.
Mercury content (μg/kg) in samples regarding the origin (average ± SD; p>0.05).
Table S1.
Validation parameters of the used method and evaluation criteria
| Mercury | ||||
|---|---|---|---|---|
| Linearity-correlation coeficient R2 | 0.9998 | ≥0.998 | ||
| Limit of detection (LOD) (mg/kg) | 0.00009 | |||
| Limit of quantification (LOQ) (mg/kg) | 0.0001 | |||
| Spiked sample analysis | Foodstuff | Level of enrichment (mg/kg) | Recovery* (%) | Commission Regulation (UE) No 2021/705 |
| honey | 0.00142 | 98.45 | ||
| 0.00948 | 90.37 | |||
| 0.9480 | 105.35 | |||
| poultry meat | 0.00095 | 109.00 | ||
| 0.9480 | 105.52 | |||
| butter | 0.00948 | 104.56 | ||
| red currant | 0.00948 | 98.81 | ||
| celery | 0.00948 | 94.41 | ||
| Dietary supplement | 0.09480 | 101.25 | ||
| red shrimp | 0.47400 | 104.42 | ||
| zander fillet with skin fresh | 0.56880 | 94.95 | ||
| Repeatability RSDr (%) relative standard deviation of repeatability fish - level Hg: 0.0636 mg/kg | 0.05 | HORRATr < 2 | ||
| Accreditation scope (mg/kg) | 0.001 – 1.00 | - | ||
| The lower reading range of the results for the purposes of this work: from LOQ of the method | ||||
* The recovery for the method was calculated according to the following formula:
where:Cd - the concentration of the substance added to the sample,
Cm - the concentration of the substance in the sample where analyte has not been added,
Cw - the concentration of the substance measured in the spiked sample.