
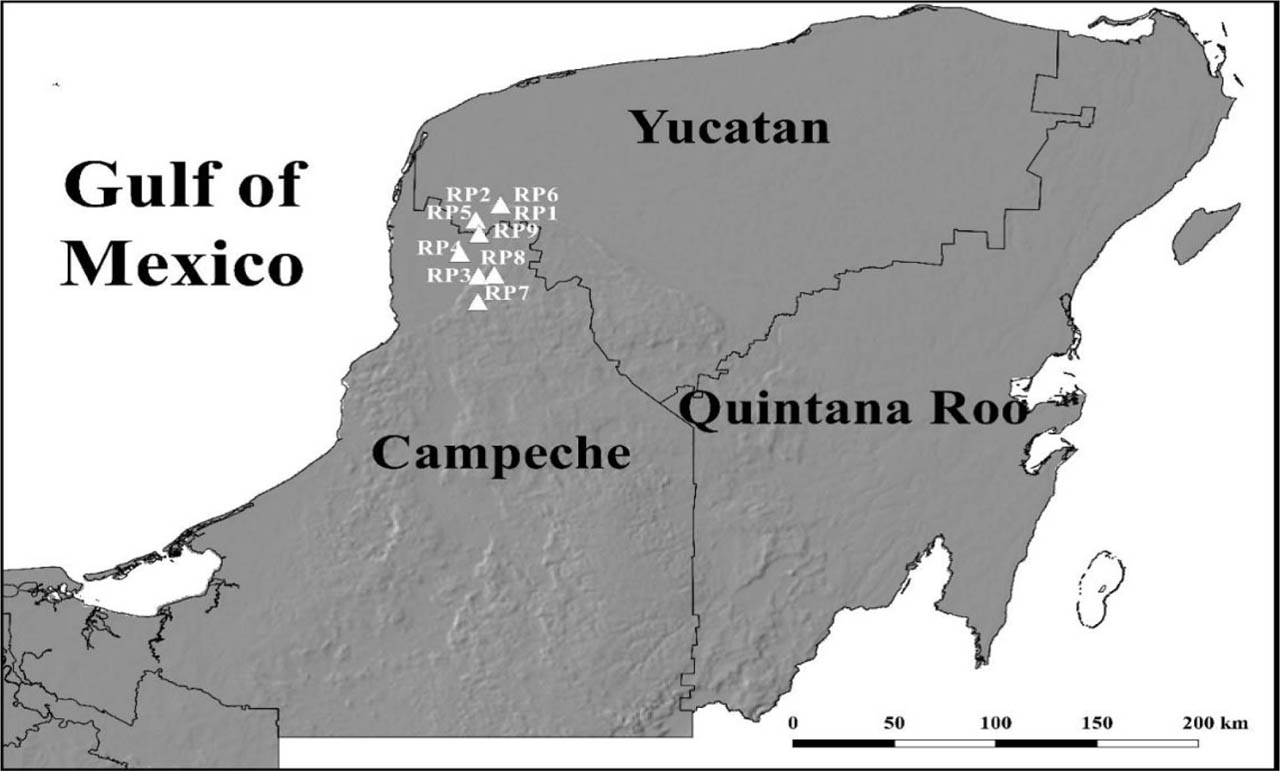
Fig. 1
Map of the location of apiaries in the southeast region of Mexico.
RP= raw propolis. RP1: Maxcanú (N 20° 34′ 52.932″, W 89° 59′ 15.827″), RP2: Santa Cruz (N 20° 35′ 6.324″, W 89° 57′ 39.563″), RP3: Hecelchakán (N 20° 10′ 44.364″, W 90° 7′ 28.055″), RP4: Nunkiní (N 20° 23′ 28.356″, W 90° 8′ 58.38″), RP5: Halachó (N 20° 28′ 16.464″, W 90° 4′ 55.92″), RP6: Maxcanú (N 20° 35′ 11.724″, W 90° 0′ 27.792″), RP7: Pomuch (N 20° 08′ 16.00″, W 90° 10′ 28.0″), RP8: Calkiní (N 20° 22′ 10.524″, W 90° 3′ 6.804″), RP9: Cuch Holoch (N 20° 26′ 7.98″, W 90° 5′ 53.052″).
Table 1
Moisture content, ash and sensory characteristics of raw propolis
| Samples | Moisture (%) | Ash (%) | Appearance | Aroma | Color | Taste | Consistency |
|---|---|---|---|---|---|---|---|
| RP1 | 6.63±0.11e | 3.73±0.11e | Bright irregular pieces | Resinous soft | Dark greenish brown | Insipid | Malleable |
| RP2 | 6.30±0.00e | 4.06±0.11f | Low brightness irregular pieces | Resinous | Dark greenish brown | Insipid | Rigid |
| RP3 | 4.63±0.11c | 2.26±0.11c | Bright irregular pieces | Odorless | Dark greenish brown | Insipid | Malleable |
| RP4 | 3.90±0.08b | 4.03±0.05f | Opaque irregular pieces | Resinous | Reddish yellow | Piquant | Rigid |
| RP5 | 6.66±0.05e | 0.66±0.05a | Opaque irregular pieces | Odorless | Reddish yellow | Bitter | Malleable |
| RP6 | 1.96±0.05a | 2.86±0.05d | Opaque irregular pieces | Resinous | Brown | Insipid | Malleable |
| RP7 | 6.53±0.30e | 1.83±0.05b | Opaque irregular pieces | Resinous aromatic | Dark greenish brown | Piquant | Malleable |
| RP8 | 8.26±0.28f | 5.50±0.17g | Powder or Granules | Resinous soft | Brown | Insipid | Rigid |
| RP9 | 5.50±0.17d | 2.03±0.05bc | Opaque irregular pieces | Odorless | Dark greenish brown | Bitter | Malleable |
[i] Different letters within a column denote significant differences according to Tukey test (n = 6, p≤0.05). Values are means ± standard deviation.
Table 2
Chemical quality of propolis extracts
| Propolis extract | Dry extract (%) | Solubility in Pb | Solubility in NaOH | Oxidation index (s) | TPC (mg GAE/g) | TF (mg QE/g) | DPPH mM Trolox/g | ABTS mM Trolox/g |
|---|---|---|---|---|---|---|---|---|
| PE1 | 7.85±0.00d | + | + | 16.16±0.55c | 33.66±0.48e | 11.93±0.00e | 0.61±0.01b | 2.29±0.13c |
| PE2 | 11.52±0.04h | + | + | 6.00±0.00a | 97.02±5.40g | 42.68±1.79g | 2.71±0.01d | 4.64±0.30g |
| PE3 | 9.62±0.00f | + | + | 12.03±0.55b | 28.28±1.55de | 1.79±0.00a | 1.60±0.03b | 2.50±0.00cd |
| PE4 | 6.02±0.03c | + | + | 30.66±0.45e | 51.90±1.78f | 3.35±0.10ab | 0.66±0.04b | 2.88±0.04ef |
| PE5 | 11.24±0.14g | + | + | 43.06±0.75f | 4.17±0.00a | 2.62±0.04ab | 0.20±0.01a | 1.35±0.10b |
| PE6 | 6.05±0.18c | + | + | 17.56±0.89cd | 14.43±0.00b | 5.56±0.12c | 0.65±0.00b | 2.50±0.02cd |
| PE7 | 8.67±0.01e | + | + | 42.56±0.75f | 19.32±0.52bc | 3.88±0.05bc | 0.26±0.00a | 0.92±0.00a |
| PE8 | 5.19±0.00b | + | + | 13.36±0.63b | 23.31±0.04cd | 10.15±0.09d | 0.25±0.00a | 3.10±0.08f |
| PE9 | 2.30±0.00a | + | + | 18.46±0.65d | 27.42±0.08d | 23.03±0.41f | 1.55±0.08c | 2.68±0.10de |
[i] Different letters within a column denote significant differences according to Tukey test (n = 6, p≤0.05). Values are means ± standard deviation. The symbol (+) means positive result. PE1: propolis extracts from Maxcanú; PE2: propolis extracts from Santa Cruz; PE3: propolis extracts from Hecelchakán; PE4: propolis extracts from Nunkiní; PE5: propolis extracts from Halachó; PE6: propolis extracts from Maxcanú; PE7: propolis extracts from Pomuch; PE8: propolis extracts from Calkiní; PE9: propolis extracts from Cuch-holoch.
Table 3
Pearson’s correlation between different parameters
| Parameters | ABTS | DPPH | TF | TPC |
|---|---|---|---|---|
| DPPH | 0.78* | - | ||
| TF | 0.76 | 0.94 | - | |
| TPC | 0.83 | 0.84 | 0.78 | - |
| Oxidation index | −0.81 | −0.57 | −0.57 | −0.52 |
Table 4
Content of individual phenolic compounds (mg/100 g of dry propolis extract)
| Samples | 1 | 2 | 3 | 4 | 5 | 6 | 7 | 8 | 9 |
|---|---|---|---|---|---|---|---|---|---|
| PE1 | 122.32±4.56 | 229.13±6.79 | 235.87±4.87 | 72.99±0.82 | 72.26±3.39 | 62.40±0.82 | 18.56±0.98 | 23.09±2.03 | 55.55±1.50 |
| PE2 | 41.63±0.30 | 106.86±1.28 | 215.24±1.31 | 62.48±1.37 | 53.90±0.20 | 172.36±5.62 | 3.10±0.19 | 153.75±0.00 | 388.26±25.46 |
| PE3 | 22.17±0.46 | 145.51±2.31 | 207.09±4.66 | 38.53±1.07 | 55.19±0.47 | 12.57±0.62 | 3.23±0.05 | 28.72±0.00 | 22.05±0.41 |
| PE4 | 51.07±2.13 | 140.60±0.98 | nd | 4.04±0.12 | 74.35±3.42 | nd | nd | 5.62±0.00 | 13.61±0.33 |
| PE5 | 10.30±0.03 | nd | 47.28±1.06 | 10.30±0.45 | 54.28±0.47 | 7.23±0.19 | nd | 2.35±0.00 | 20.98±0.17 |
| PE6 | 215.01±8.64 | 48.62±1.55 | 0.88±0.12 | 79.45±0.54 | 8.86±0.11 | 2.26±0.07 | nd | 2.15±0.05 | |
| PE7 | 24.64±0.40 | nd | 273.28±1.73 | 9.42±0.29 | 80.60±3.11 | 62.21±0.00 | nd | 44.74±0.00 | 53.02±2.29 |
| PE8 | 31.12±0.68 | nd | 61.89±3.24 | 16.59±0.07 | 40.91±0.21 | 26.05±0.85 | 4.19±0.07 | 38.03±0.00 | 60.36±1.92 |
| PE9 | nd | 91.36±0.37 | nd | 50.51±2.21 | 76.80±1.42 | 19.66±0.19 | 16.97±0.56 | 22.46±0.00 | 29.95±1.03 |
[i] 1: Gallic acid, 2: Chlorogenic acid, 3: Catechin, 4: Vanillin, 5: Ellagic acid, 6: Sinapic acid, 7: Ferulic acid, 8: Pinocembrin and 9: Chrysin. Different letters within a column denote significant differences according to Tukey test (n = 6, p≤0.05). Values are means ± standard deviation. PE= propolis extracts. PE1: Maxcanú; PE2: Santa Cruz; PE3: Hecelchakán; PE4: Nunkiní; PE5: Halachó; PE6: Maxcanú; PE7: Pomuch; PE8: Calkiní; PE9: Cuch Holoch. nd: not detected.
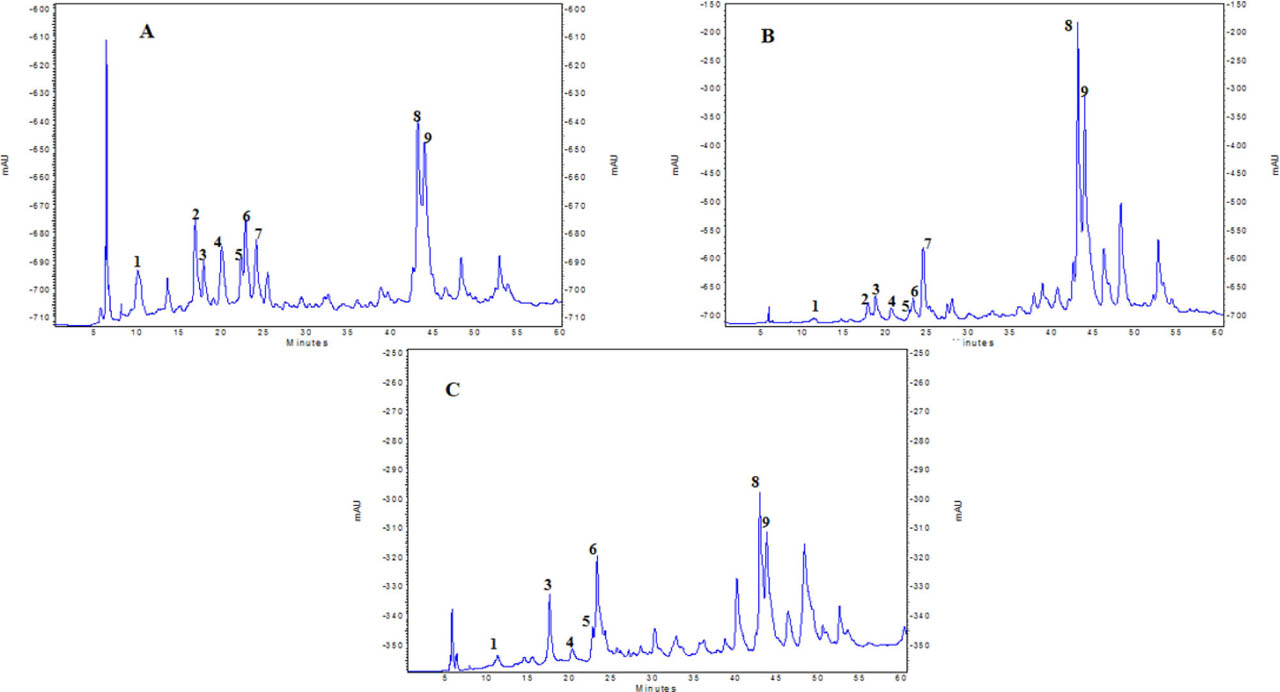
Fig. 2
A typical chromatogram of the phenolic compounds detected in extracts PE1 (A), PE2 (B) and PE7 (C).
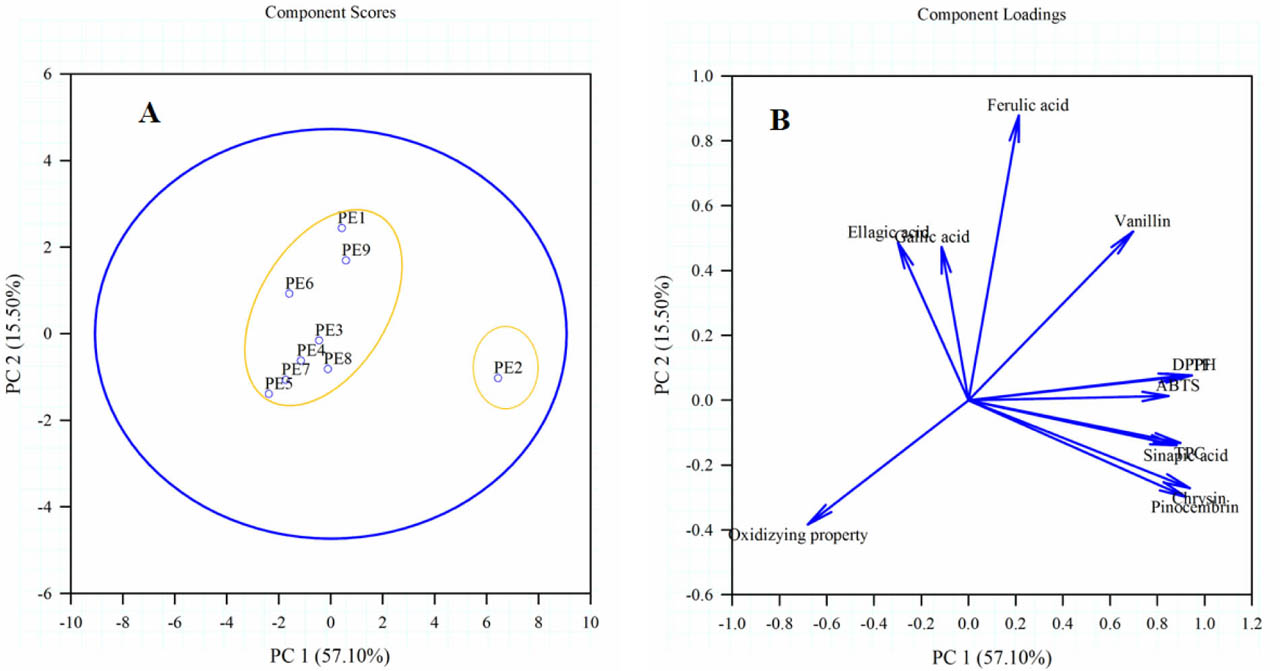
Fig. 3
PC1 vs. PC2 scatter plot; A) distinction between the samples (scores); (B) based on chemical quality (loadings).