
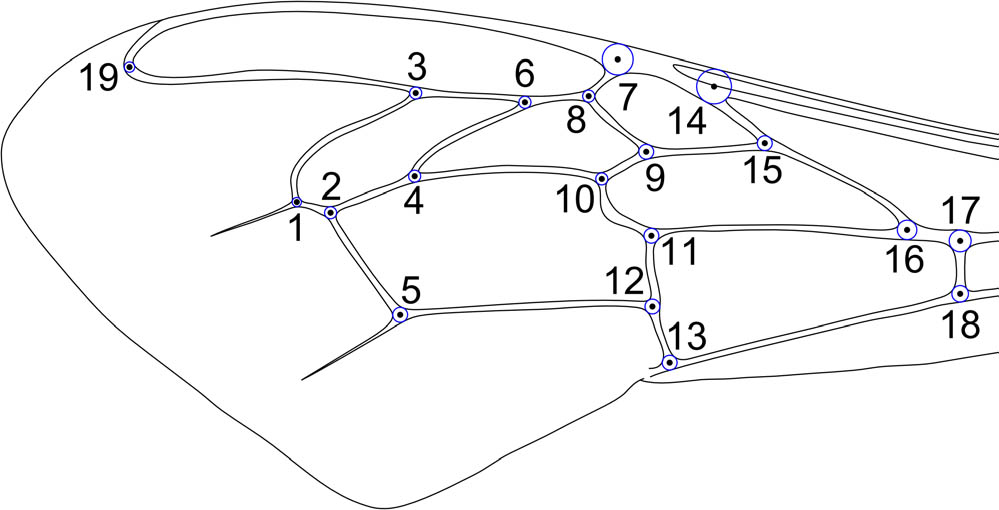
Fig. 1
Schematic of forewing of honey bee worker with landmarks marked as black dots and numbers.
Table 1
Differences in wing size analyzed by three way analysis of variance
| Effect | df | MS | F | p |
|---|---|---|---|---|
| colony | 3 | 5894 | 58 | 0.000000 |
| month | 3 | 1084 | 11 | 0.000001 |
| side | 1 | 421 | 4 | 0.043060 |
| colony*month | 9 | 755 | 7 | 0.000000 |
| coony*side | 3 | 16 | 0 | 0.926473 |
| month*side | 3 | 6 | 0 | 0.983432 |
| colony*month*side | 9 | 14 | 0 | 0.998740 |
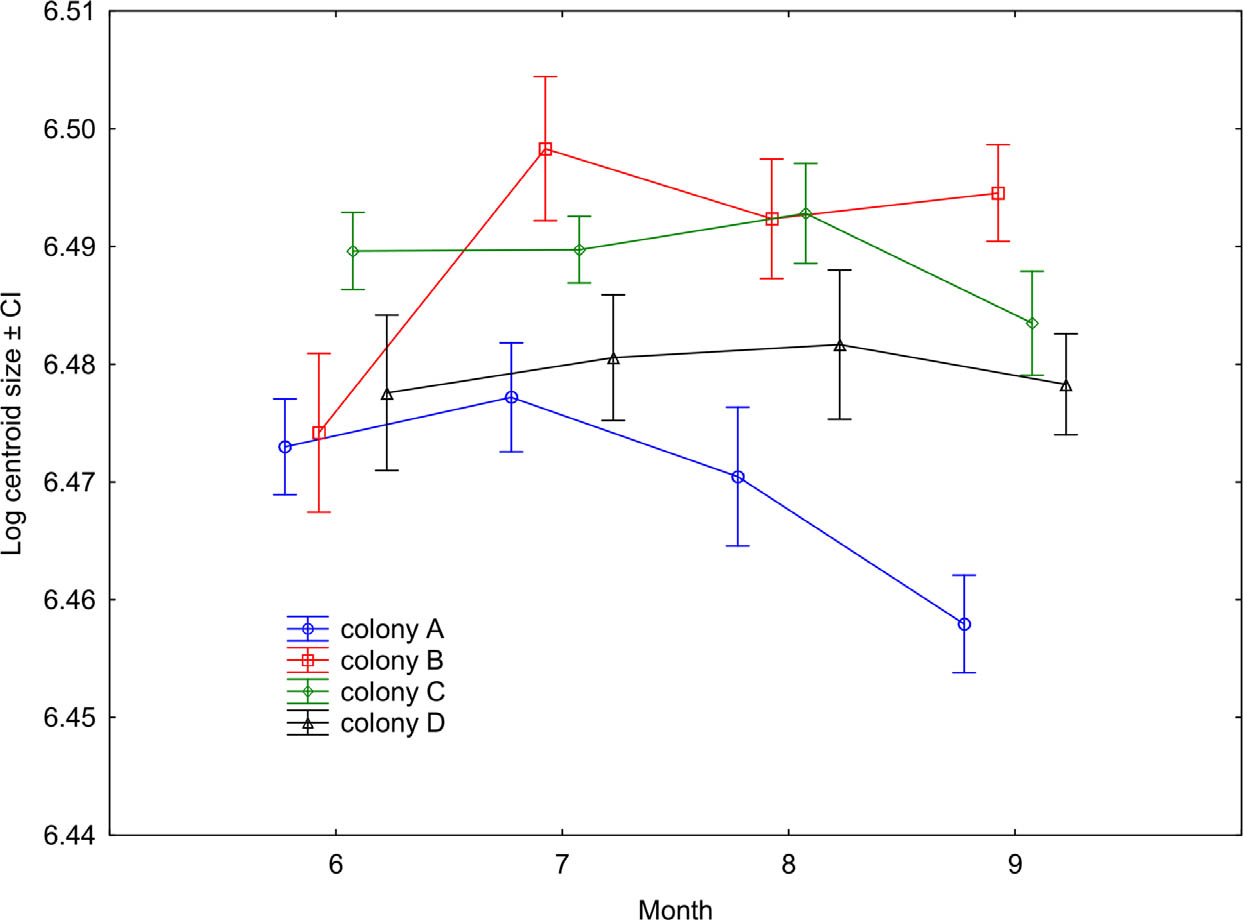
Fig. 2
Mean logarithm of centroid size ± 95% confidence intervals (CI) in four honey bee colonies during four months.
Table 2
Differences in wing shape analyzed by multivariate analysis of covariance (MANCOVA) with wing size used as covariate
| Effect | Wilks Λ | F | p |
|---|---|---|---|
| colony | 0.562513 | 3.273041 | 0.000000 |
| month | 0.729034 | 1.719851 | 0.000020 |
| side | 0.979761 | 0.319570 | 0.999931 |
| size | 0.738690 | 5.472685 | 0.000000 |
| colony*month | 0.392991 | 1.702865 | 0.000000 |
| colony*side | 0.900845 | 0.548305 | 0.999919 |
| month*side | 0.908418 | 0.503640 | 0.999990 |
| colony*size | 0.570564 | 3.184397 | 0.000000 |
| month*size | 0.729804 | 1.713796 | 0.000023 |
| side*size | 0.979607 | 0.322057 | 0.999925 |
| colony*month*side | 0.728981 | 0.556043 | 1.000000 |
| colony*month*size | 0.393136 | 1.702155 | 0.000000 |
| colony*side*size | 0.901142 | 0.546541 | 0.999925 |
| month*side*size | 0.908748 | 0.501705 | 0.999991 |
| colony*month*side*size | 0.729055 | 0.555861 | 1.000000 |
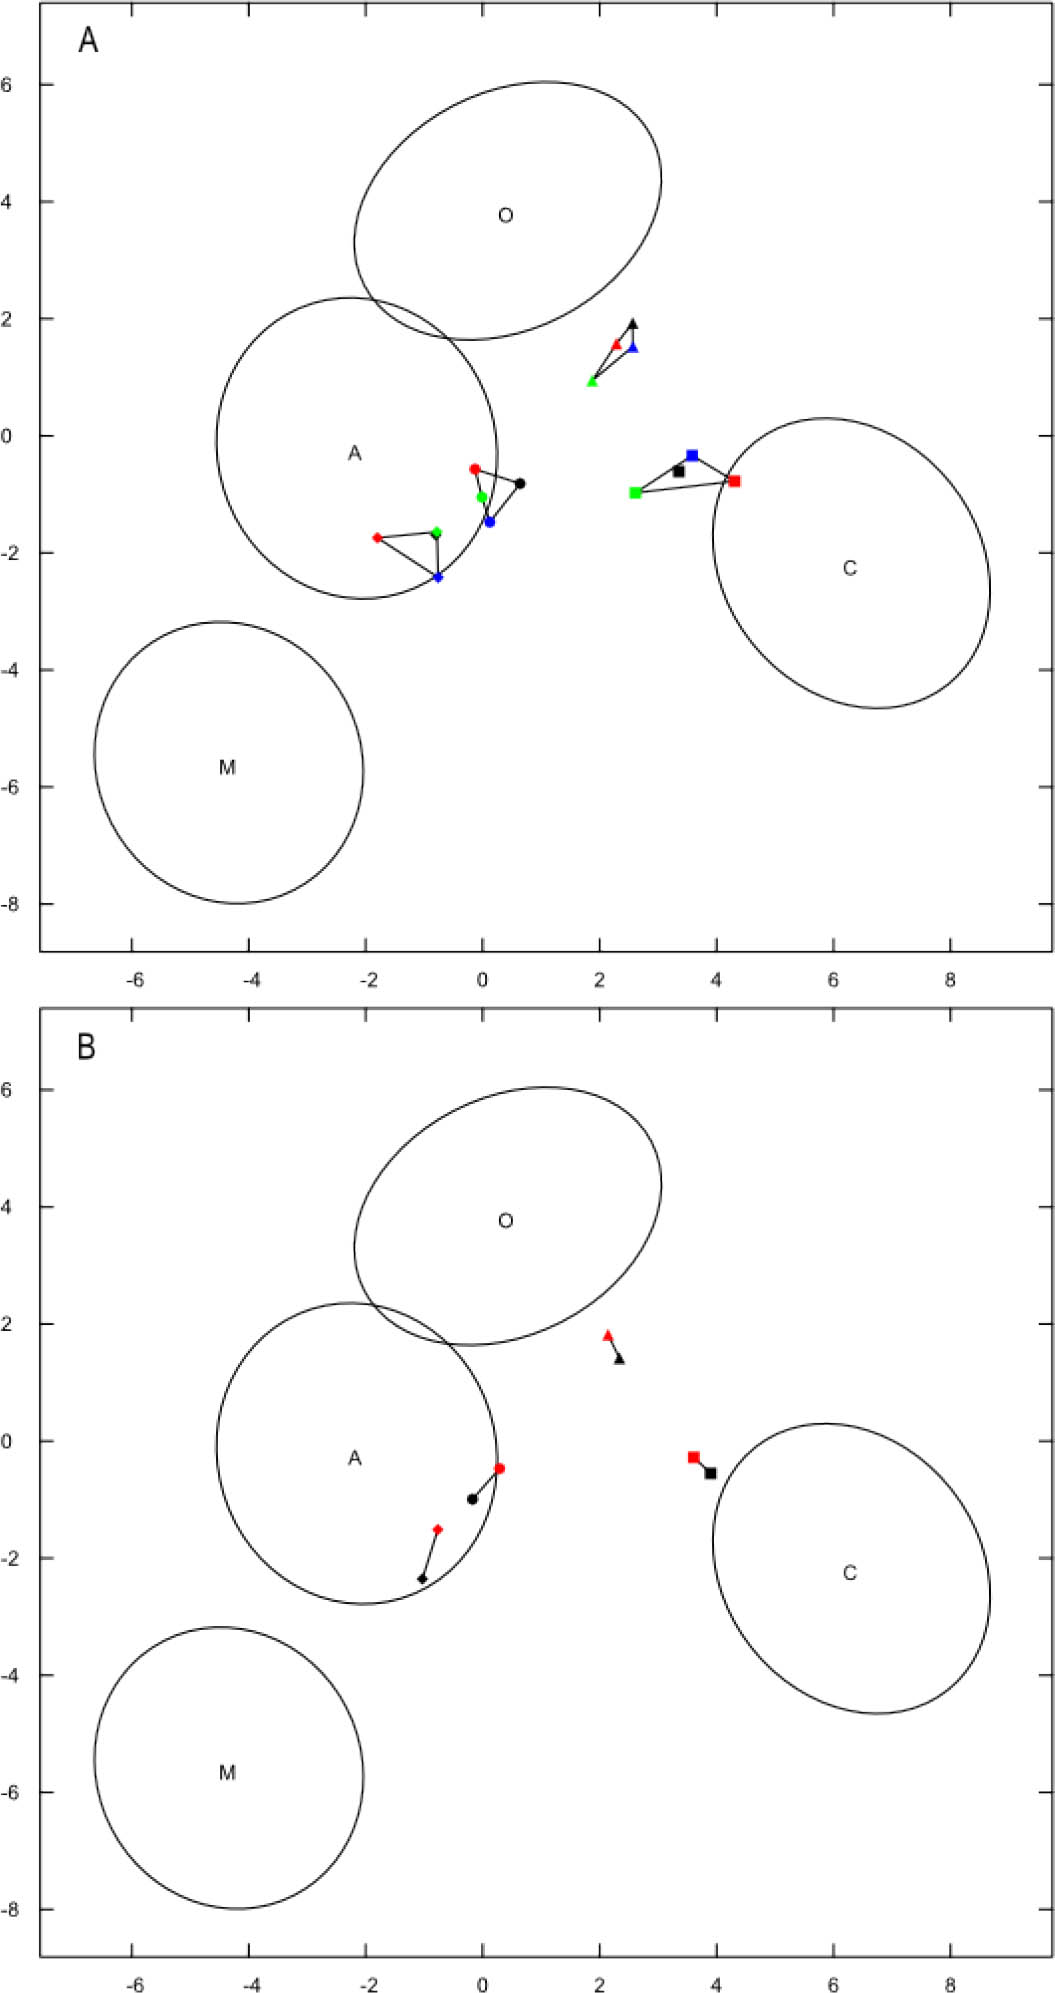
Fig. 3
Discrimination of honey bee lineages based on the first two canonical variates obtained with IdentiFly software. Colonies A, B, C and D were indicated with circles, squares, diamonds and triangles, respectively. In graph A, June, July, August and September were indicated with blue, red, green and black, respectively. In graph B, the left and right body sides were indicated with red and black, respectively.