
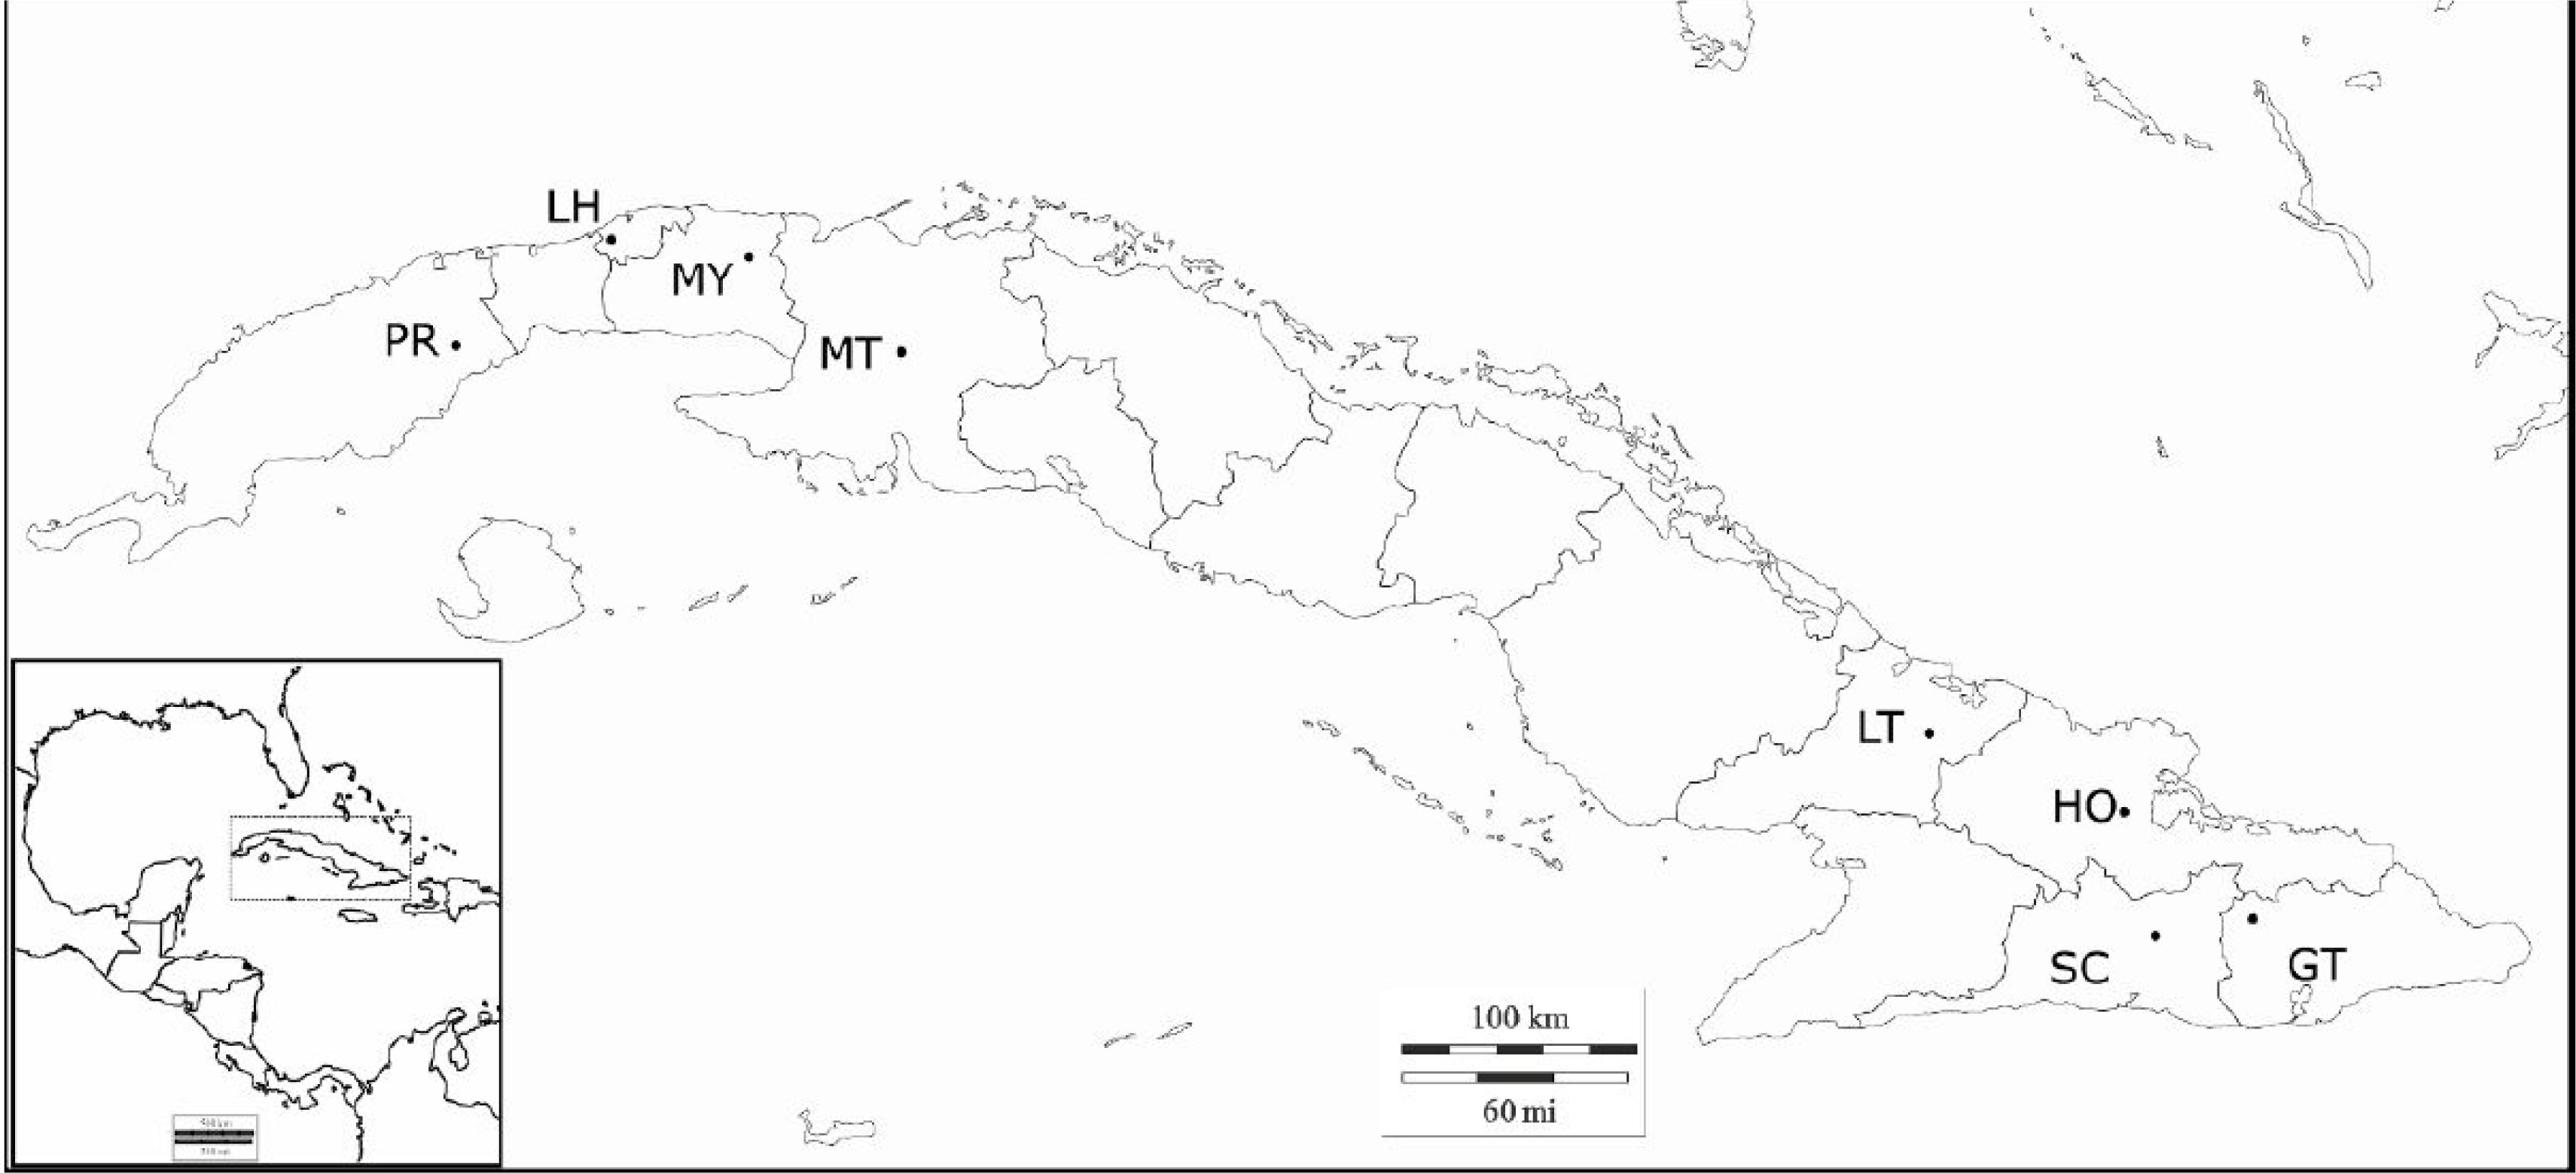
Fig. 1
Map of sampled locations. PR: Pinar del Rio, LH: La Habana, MY: Mayabeque, MT: Matanzas, LT: Las Tunas, HO: Holguín, SC: Santiago de Cuba, GT: Guantánamo. Black triangles represent localization on the sampled apiaries.
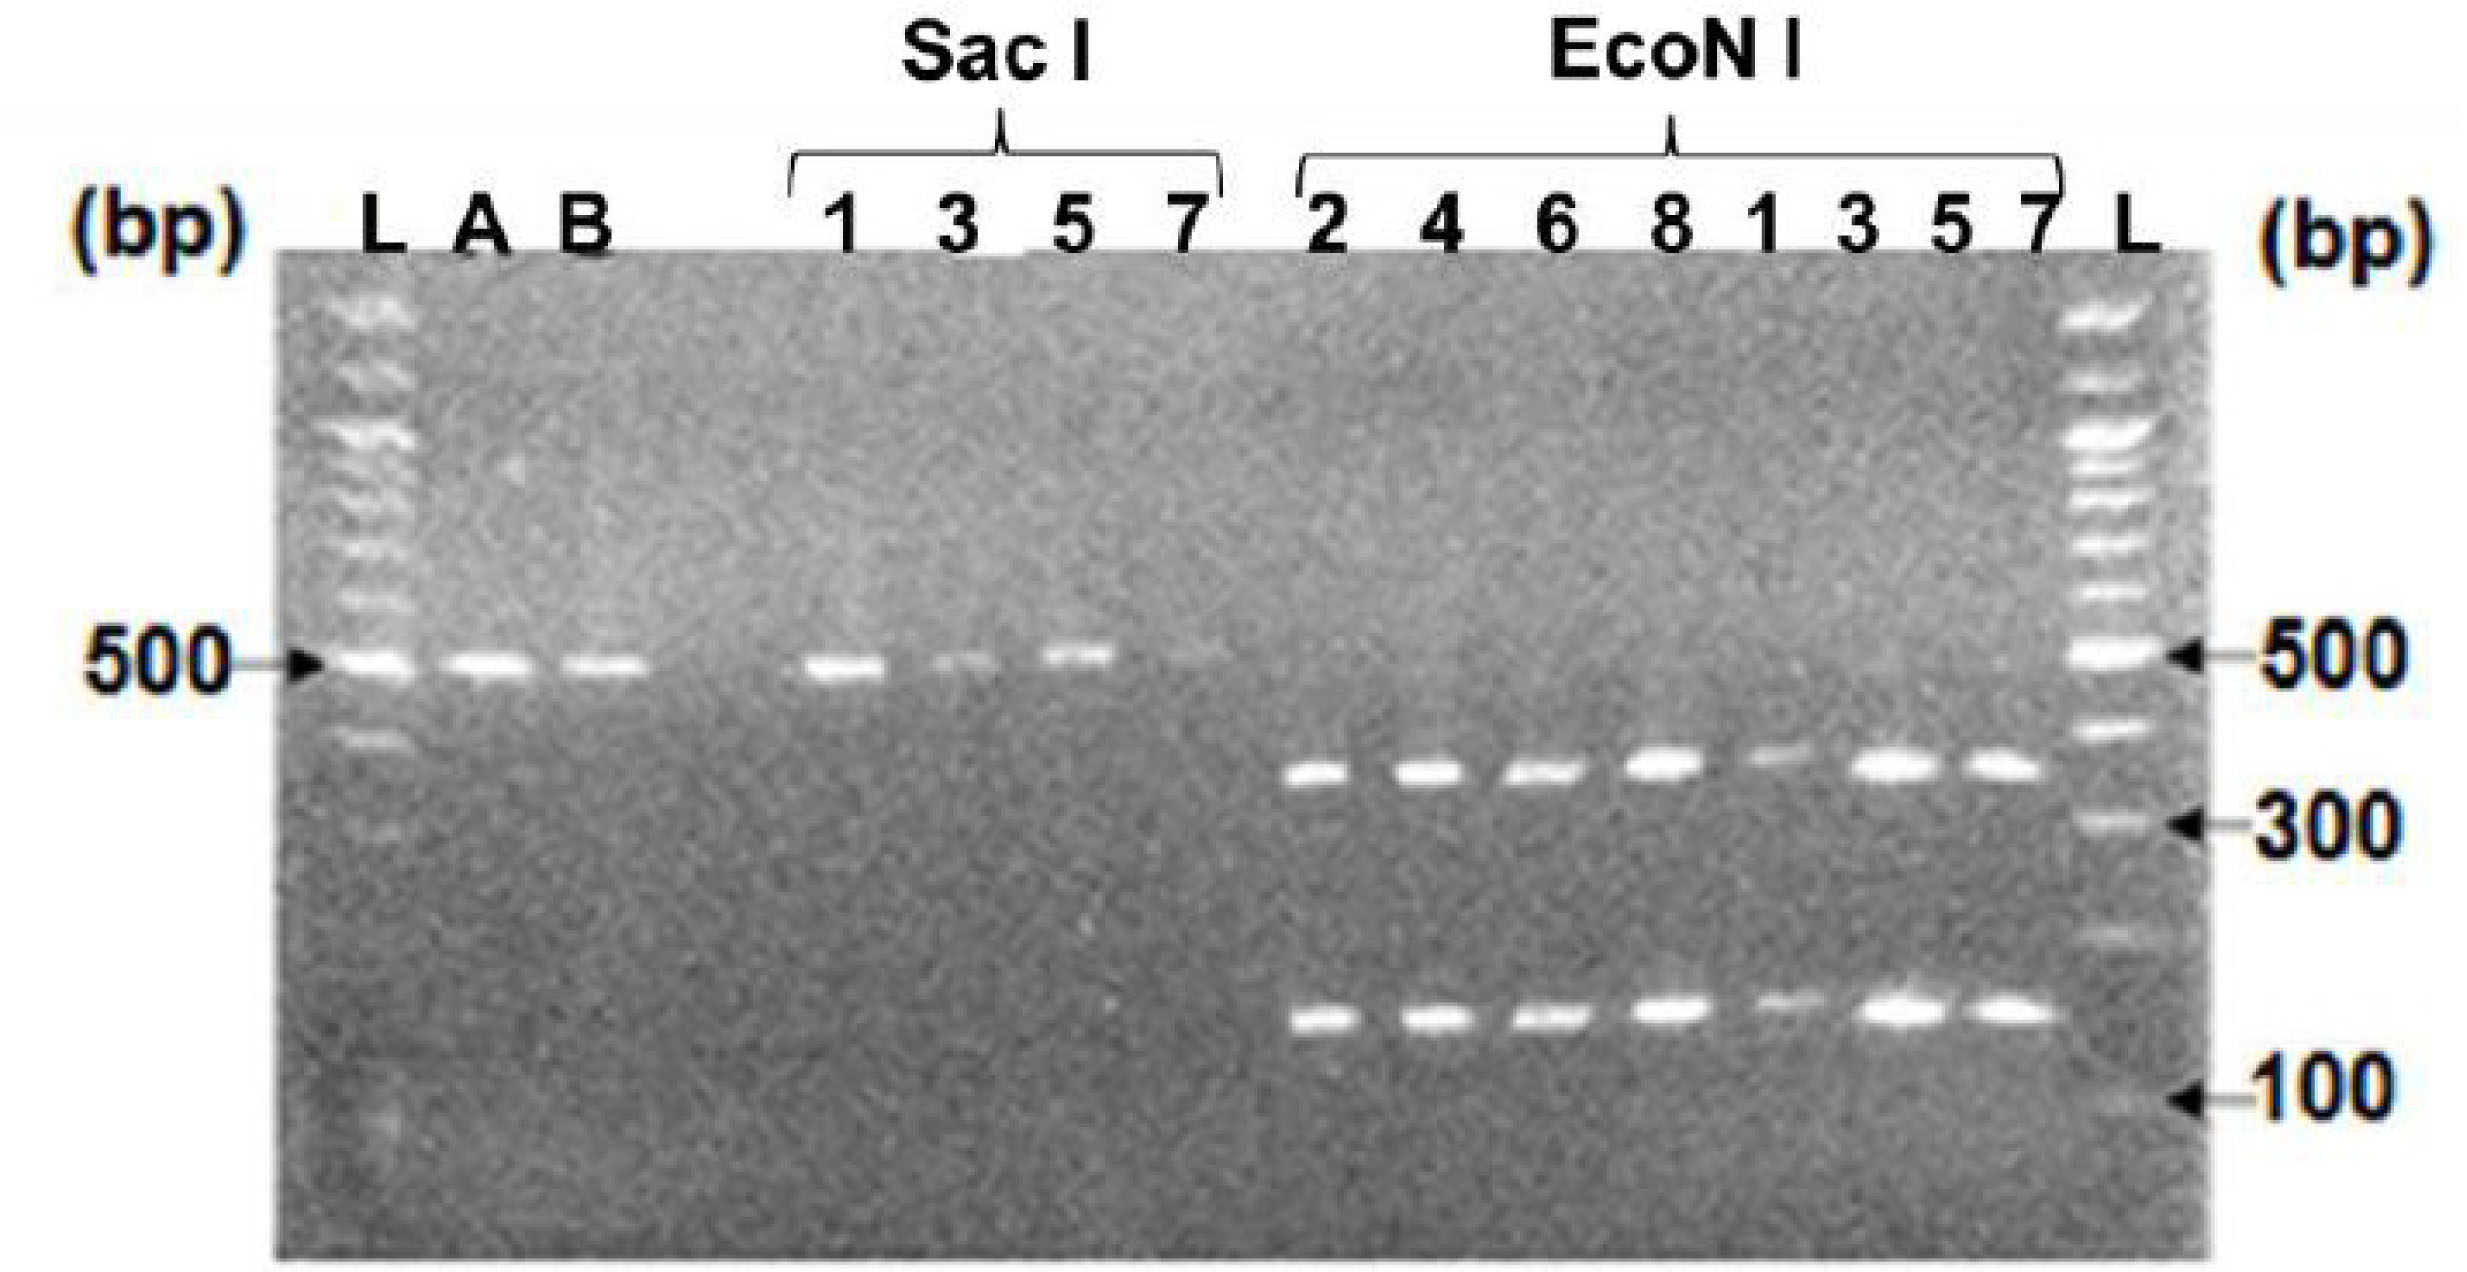
Fig. 2
Restriction profiles of COI region of Varroa destructor mtDNA. Eight provinces of Cuba were sampled and displayed numbered from 1 to 8. 1: PR, 2: LH, 3: MY, 4: MT, 5: LT, 6: HO, 7: SC and 8:GT. The mtDNA was digested with endonucleases SacI and EcoNI. Lane L: 100-bp DNA ladder, Lane A: Undigested amplicons (amplified with COXF and COXRa primers) and Lane B: Undigested amplicons (amplified with VD-CO206F and VD-CO206R).
Tab 1
Microsatellites absolute sizes and frequencies of alleles found in Cuba. He and Ho are expected and observed heterocigocity, respectively
| Allele size (bp) | Localities | |||
|---|---|---|---|---|
| Locus | sequenced * | this study | Mayabeque | La Habana |
| N=12 | N=12 | |||
| VD112 | 142 | 158 | 0.04 | 0.04 |
| 160 | 0.00 | 0.08 | ||
| 168 | 0.88 | 0.58 | ||
| 178 | 0.08 | 0.29 | ||
| Ho | 0.25 | 0.67 | ||
| He | 0.23 | 0.57 | ||
| N=11 | N=12 | |||
| VD114 | 217 | 246 | 0.09 | 0.08 |
| 250 | 0.91 | 0.92 | ||
| Ho | 0.00 | 0.00 | ||
| He | 0.17 | 0.15 | ||
| N=12 | N=12 | |||
| VD016 | 268 | 316 | 1 | 1 |
| Ho | 0 | 0 | ||
| He | 0 | 0 | ||
* alleles reported by Solignac et al. 2003.