
Figure 1
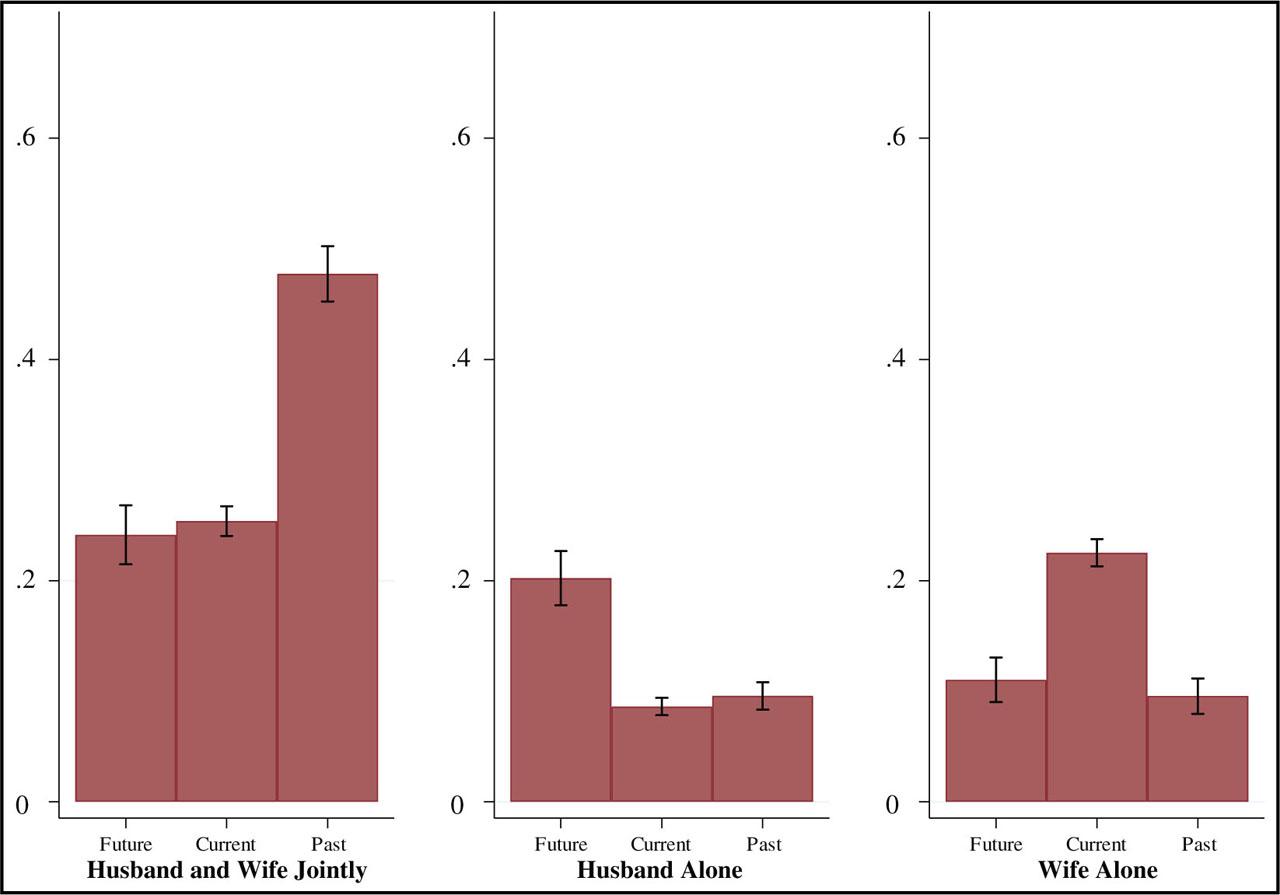
Figure 2
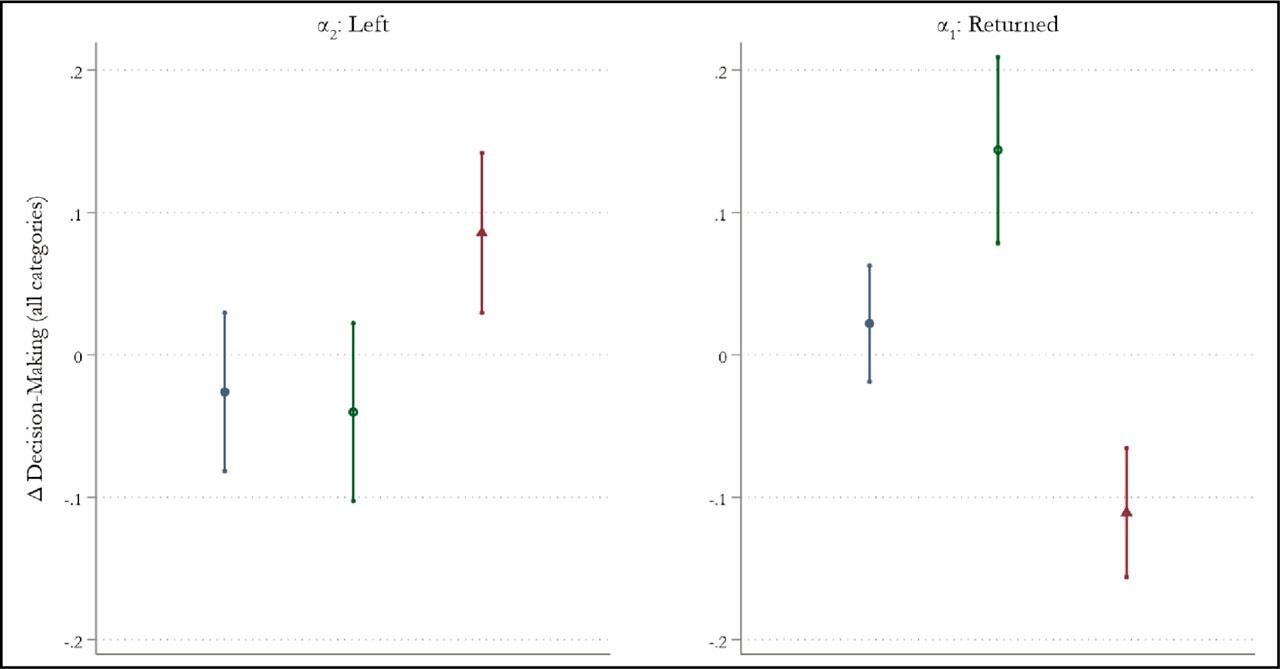
Figure A1
Changes in expenditures, income, and financial behavior as the husband's migrant status changes – top-coded at the 99th percentile
| (1) | (2) | (3) | (4) | |
|---|---|---|---|---|
| Panel A: expenditures | ||||
| Temptation goods | −120.197** (53.600) | −123.775** (53.349) | −103.070* (58.289) | −84.433 (89.528) |
| N | 7,417 | 7,417 | 2,940 | 2,940 |
| Health care | −142.523 (209.494) | 67.791 (208.082) | 37.156 (213.112) | 384.495 (441.580) |
| N | 7,145 | 7,145 | 2,850 | 2,850 |
| Ceremonies or celebrations | −61.221 (200.328) | −98.690 (207.853) | −101.441 (244.901) | −69.571 (428.462) |
| N | 7,407 | 7,407 | 2,948 | 2,948 |
| Children's education | 46.994 (70.327) | 57.460 (80.099) | 32.590 (86.554) | −17.220 (91.988) |
| N | 7,339 | 7,339 | 2,954 | 2,954 |
| Children's clothing | 66.530*** (19.940) | 66.780*** (19.517) | 68.799*** (21.046) | 43.934 (46.406) |
| N | 7,349 | 7,349 | 2,965 | 2,965 |
| Adult women's clothing | −12.056 (17.752) | −11.160 (18.640) | −5.324 (18.132) | 22.142 (36.732) |
| N | 7,548 | 7,548 | 3,005 | 3,005 |
| Panel B: income and financial behavior | ||||
| Annual income | 47,989.637*** (10,443.880) | 42,926.326*** (10,572.657) | 40,291.132*** (12,732.178) | 46,886.496** (20,457.034) |
| N | 7,572 | 7,572 | 3,013 | 3,013 |
| Savings deposited in past month | 26.565 (117.086) | 65.817 (133.244) | 33.088 (151.638) | 63.081 (288.894) |
| N | 7,524 | 7,524 | 2,996 | 2,996 |
| Currently borrowing | −4,592.633 (5,078.635) | −4,186.492 (5,943.972) | −7,271.935 (6,512.158) | −4,250.191 (11,469.621) |
| N | 7,572 | 7,572 | 3,013 | 3,013 |
| Currently lending | −499.550 (1,535.515) | 538.604 (1,651.946) | 154.814 (1,959.374) | −2,634.804 (3,550.470) |
| N | 7,572 | 7,572 | 3,013 | 3,013 |
| Household and year FE | Yes | Yes | Yes | Yes |
| Controls | No | Yes | Yes | Yes |
| Limited sample | No | No | Yes | Yes |
| HH-specific time trends | No | No | No | Yes |
Outcomes by migrant status
| (1) | (2) | (3) | (4) | |
|---|---|---|---|---|
| Overall | Ever migrate | Never migrate | P-value (2) = (3) | |
| Panel A: Decision-making over all categories | ||||
| Husband alone | 0.136 | 0.105 | 0.156 | 0.000*** |
| [0.209] | [0.187] | [0.220] | ||
| Husband and wife jointly | 0.338 | 0.304 | 0.361 | 0.000*** |
| [0.313] | [0.313] | [0.310] | ||
| Wife alone | 0.108 | 0.177 | 0.062 | 0.000*** |
| [0.208] | [0.256] | [0.152] | ||
| Panel B: Income and financial behavior | ||||
| Annual income | 11.562 | 11.826 | 11.388 | 0.000*** |
| [3.117] | [2.931] | [3.223] | ||
| Savings deposited in past month | 4.425 | 4.699 | 4.244 | 0.000*** |
| [3.056] | [3.036] | [3.055] | ||
| Currently borrowing | 6.922 | 7.049 | 6.838 | 0.128 |
| [5.886] | [5.855] | [5.906] | ||
| Currently lent | 1.630 | 1.945 | 1.421 | 0.000*** |
| [4.006] | [4.307] | [3.780] | ||
| Panel C: Expenditures | ||||
| Temptation goods | 4.124 | 3.528 | 4.515 | 0.000*** |
| [3.685] | [3.677] | [3.638] | ||
| Health care | 5.971 | 5.765 | 6.107 | 0.000*** |
| [3.404] | [3.428] | [3.381] | ||
| Ceremonies or celebrations | 7.111 | 7.063 | 7.143 | 0.143 |
| [2.298] | [2.357] | [2.259] | ||
| Child education | 5.128 | 5.856 | 4.641 | 0.000*** |
| [3.381] | [2.961] | [3.553] | ||
| Child clothing | 5.184 | 5.860 | 4.730 | 0.000*** |
| [2.985] | [2.518] | [3.181] | ||
| Adult women clothing | 6.330 | 6.424 | 6.268 | 0.000*** |
| [1.626] | [1.464] | [1.721] | ||
| N | 7,572 | 3,013 | 4,559 | 7,572 |
Changes in income and financial behavior (asinh) as the husband's migrant status changes
| (1) | (2) | (3) | (4) | |
|---|---|---|---|---|
| Annual income | 0.280** (0.130) | 0.173 (0.134) | 0.204 (0.135) | 0.004 (0.232) |
| N | 7,572 | 7,572 | 3,013 | 3,013 |
| Savings deposited in past month | 0.122 (0.085) | 0.092 (0.100) | 0.071 (0.112) | −0.173 (0.207) |
| N | 7,524 | 7,524 | 2,996 | 2,996 |
| Currently borrowing | 0.056 (0.217) | 0.269 (0.240) | 0.324 (0.269) | 0.139 (0.490) |
| N | 7,572 | 7,572 | 3,013 | 3,013 |
| Currently lending | −0.073 (0.184) | 0.016 (0.197) | −0.043 (0.224) | −0.299 (0.432) |
| N | 7,572 | 7,572 | 3,013 | 3,013 |
| Household and year FE | Yes | Yes | Yes | Yes |
| Controls | No | Yes | Yes | Yes |
| Limited sample | No | No | Yes | Yes |
| HH-specific time trends | No | No | No | Yes |
Selection into attrition by migration status over time
| (1) | (2) | (3) | (4) | (5) | (6) | |
|---|---|---|---|---|---|---|
| Not found | Dropped | Current migrant | Not found × current migrant | Dropped × current migrant | N | |
| Household characteristics | ||||||
| No. of resident household members | 0.042 | 0.098 | 0.270*** | 0.103 | −0.152 | 6,245 |
| Resident mother-in-law | 0.020 | −0.019 | 0.144*** | 0.121*** | 0.020 | 6,245 |
| Resident father-in-law | 0.009 | −0.010 | 0.113*** | 0.089** | 0.049 | 6,245 |
| Resident daughter-in-law | 0.040* | −0.015 | −0.165*** | −0.041 | 0.012 | 6,245 |
| Household shocks | ||||||
| Natural disaster (nonearthquake) | −0.002 | 0.028** | −0.008 | 0.005 | −0.004 | 6,227 |
| Serious illness | 0.039* | 0.023 | −0.029** | −0.083* | 0.061 | 6,231 |
| Death of household member | 0.018 | 0.019* | −0.016** | 0.026 | 0.017 | 6,229 |
| Falling agricultural prices | −0.007 | 0.205*** | −0.021* | −0.049** | −0.046 | 6,116 |
| Decrease in income | −0.016 | 0.243*** | −0.039*** | −0.032 | −0.045 | 6,130 |
| Loss of employment | 0.014 | 0.013* | −0.014*** | −0.006 | −0.013 | 6,217 |
| Mercalli scale 2015 earthquake | −0.264 | 5.278*** | −0.229** | 0.710** | 0.037 | 6,245 |
Changes in expenditures, income, and financial behavior as the husband's migrant status changes – log(x+1)
| (1) | (2) | (3) | (4) | |
|---|---|---|---|---|
| Panel A: expenditures | ||||
| Temptation goods | −0.951*** (0.153) | −1.086*** (0.161) | −1.066*** (0.159) | −1.072*** (0.280) |
| N | 7,417 | 7,417 | 2,940 | 2,940 |
| Health care | −0.013 (0.131) | −0.035 (0.152) | −0.032 (0.158) | 0.233 (0.275) |
| N | 7,145 | 7,145 | 2,850 | 2,850 |
| Ceremonies or celebrations | 0.035 (0.097) | 0.006 (0.092) | 0.056 (0.102) | −0.187 (0.220) |
| N | 7,407 | 7,407 | 2,948 | 2,948 |
| Children's education | 0.154* (0.092) | 0.246** (0.096) | 0.163* (0.099) | −0.176 (0.162) |
| N | 7,339 | 7,339 | 2,954 | 2,954 |
| Children's clothing | 0.351*** (0.088) | 0.401*** (0.094) | 0.399*** (0.098) | 0.163 (0.151) |
| N | 7,349 | 7,349 | 2,965 | 2,965 |
| Adult women's clothing | −0.062 (0.058) | −0.049 (0.059) | −0.022 (0.059) | 0.022 (0.115) |
| N | 7,548 | 7,548 | 3,005 | 3,005 |
| Panel B: income and financial behavior | ||||
| Annual income | 0.281** (0.124) | 0.177 (0.128) | 0.208 (0.129) | 0.023 (0.221) |
| N | 7,572 | 7,572 | 3,013 | 3,013 |
| Savings deposited in past month | 0.109 (0.076) | 0.085 (0.090) | 0.064 (0.102) | −0.155 (0.189) |
| N | 7,524 | 7,524 | 2,996 | 2,996 |
| Currently borrowing | 0.055 (0.204) | 0.254 (0.225) | 0.304 (0.253) | 0.131 (0.461) |
| N | 7,572 | 7,572 | 3,013 | 3,013 |
| Currently lending | −0.068 (0.173) | 0.016 (0.185) | −0.040 (0.210) | −0.282 (0.406) |
| N | 7,572 | 7,572 | 3,013 | 3,013 |
| Household and year FE | Yes | Yes | Yes | Yes |
| Controls | No | Yes | Yes | Yes |
| Limited sample | No | No | Yes | Yes |
| HH-specific time trends | No | No | No | Yes |
Husband's migration and household attrition
| (1) | (2) | (3) | (4) | |
|---|---|---|---|---|
| Absent in next round | −0.020 (0.019) | 0.002 (0.022) | 0.046** (0.022) | −0.042 (0.038) |
| N | 6,225 | 6,225 | 2,465 | 2,465 |
| Not found | −0.002 (0.015) | 0.019 (0.017) | 0.024 (0.018) | −0.042 (0.038) |
| N | 6,225 | 6,225 | 2,465 | 2,465 |
| Dropped | −0.017 (0.016) | −0.017 (0.016) | 0.022 (0.015) | - |
| N | 6,225 | 6,225 | 2,465 | - |
| Household and year FE | Yes | Yes | Yes | Yes |
| Controls | No | Yes | Yes | Yes |
| Limited sample | No | No | Yes | Yes |
| HH-specific time trends | No | No | No | Yes |
Attrition over time
| (1) | (2) | (3) | (4) | |
|---|---|---|---|---|
| 2014 | 2016 | 2017 | 2018 | |
| Full sample | 2,508 | 2,281 | 1,456 | 1,327 |
| Attrition (not found) | . | 227 | 165 | 294 |
| Attrition (dropped) | . | 0 | 887 | 887 |
Shifts in expenditures (asinh) as the husband's migrant status changes – only considering the first two rounds of data
| (1) | (2) | (3) | |
|---|---|---|---|
| Temptation goods | −0.921*** (0.228) | −1.154*** (0.232) | −1.400*** (0.319) |
| N | 4,352 | 4,352 | 1,540 |
| Health care | 0.052 (0.189) | 0.029 (0.224) | −0.012 (0.371) |
| N | 4,016 | 4,016 | 1,426 |
| Ceremonies or celebrations | 0.113 (0.135) | −0.134 (0.137) | −0.086 (0.222) |
| N | 4,338 | 4,338 | 1,554 |
| Child education | 0.149 (0.155) | 0.415** (0.180) | 0.543** (0.242) |
| N | 4,270 | 4,270 | 1,558 |
| Child clothing | 0.289** (0.140) | 0.423*** (0.161) | 0.456** (0.209) |
| N | 4,286 | 4,286 | 1,572 |
| Adult women clothing | −0.053 (0.098) | 0.071 (0.107) | 0.160 (0.186) |
| N | 4,530 | 4,530 | 1,618 |
| Household and year FE | Yes | Yes | Yes |
| Controls | No | Yes | Yes |
| Limited sample | No | No | Yes |
| HH-specific time trends | No | No | No |
Characteristics by migrant status
| (1) | (2) | (3) | (4) | |
|---|---|---|---|---|
| Overall | Husband ever migrate | Son ever migrate | P-value (2) = (3) | |
| Panel A | ||||
| Husband characteristics | ||||
| Age | 46.119 | 38.934 | 51.839 | 0.000*** |
| [12.921] | [9.339] | [10.627] | ||
| Years of education | 5.104 | 6.219 | 4.553 | 0.000*** |
| [3.940] | [3.517] | [3.882] | ||
| Can read or write | 0.763 | 0.877 | 0.729 | 0.000*** |
| [0.365] | [0.270] | [0.377] | ||
| Wife characteristics | ||||
| Age | 41.650 | 35.076 | 47.247 | 0.000*** |
| [12.143] | [9.016] | [9.852] | ||
| Years of education | 2.513 | 3.770 | 1.584 | 0.000*** |
| [3.545] | [3.790] | [2.849] | ||
| Can read or write | 0.527 | 0.677 | 0.449 | 0.000*** |
| [0.401] | [0.369] | [0.378] | ||
| N | 2,508 | 979 | 1,317 | 1,923 |
| Panel B | ||||
| Household characteristics income (asinh) | 11.562 | 11.826 | 11.6073 | 0.000*** |
| [3.117] | [2.931] | [3.183] | ||
| No. of resident household members | 3.483 | 3.629 | 3.323 | 0.000*** |
| [1.854] | [1.745] | [1.877] | ||
| Resident mother-in-law | 0.230 | 0.316 | 0.158 | 0.000*** |
| [0.421] | [0.465] | [0.365] | ||
| Resident father-in-law | 0.159 | 0.232 | 0.088 | 0.000*** |
| [0.365] | [0.422] | [0.284] | ||
| Resident daughter-in-law | 0.185 | 0.084 | 0.308 | 0.000*** |
| [0.388] | [0.277] | [0.462] | ||
| Shocks | ||||
| Natural disaster (nonearthquake) | 0.044 | 0.039 | 0.052 | 0.011** |
| [0.206] | [0.194] | [0.222] | ||
| Serious illness | 0.223 | 0.213 | 0.223 | 0.214 |
| [0.416] | [0.409] | [0.417] | ||
| Death of household member | 0.055 | 0.053 | 0.054 | 0.959 |
| [0.228] | [0.225] | [0.226] | ||
| Falling agricultural prices | 0.131 | 0.109 | 0.128 | 0.000*** |
| [0.338] | [0.312] | [0.335] | ||
| Decrease in income | 0.155 | 0.134 | 0.154 | 0.003*** |
| [0.362] | [0.341] | [0.361] | ||
| Loss of employment | 0.023 | 0.020 | 0.023 | 0.251 |
| [0.151] | [0.141] | [0.150] | ||
| Mercalli scale 2015 earthquake | 6.926 | 6.870 | 6.922 | 0.006*** |
| [0.505] | [0.525] | [0.512] | ||
| N | 7,572 | 3,013 | 4,028 | 5,888 |
Changes in income and financial behavior (asinh) as son's migration status changes
| (1) | (2) | (3) | (4) | |
|---|---|---|---|---|
| Annual income | 0.497*** (0.156) | 0.524*** (0.163) | 0.541*** (0.164) | 0.509* (0.287) |
| N | 7,572 | 7,572 | 4,028 | 4,028 |
| Savings deposited in past month | 0.034 (0.082) | 0.027 (0.080) | 0.047 (0.080) | 0.110 (0.191) |
| N | 7,524 | 7,524 | 4,005 | 4,005 |
| Currently borrowing | 0.523*** (0.197) | 0.482** (0.196) | 0.496** (0.213) | 0.833** (0.405) |
| N | 7,572 | 7,572 | 4,028 | 4,028 |
| Currently lending | −0.117 (0.168) | −0.180 (0.167) | −0.164 (0.170) | 0.008 (0.275) |
| N | 7,572 | 7,572 | 4,028 | 4,028 |
| Household and year FE | Yes | Yes | Yes | Yes |
| Controls | No | Yes | Yes | Yes |
| Limited sample | No | No | Yes | Yes |
| HH-specific time trends | No | No | No | Yes |
Shifts in expenditures (asinh) as son's migration status changes
| (1) | (2) | (3) | (4) | |
|---|---|---|---|---|
| Temptation goods | 0.176 (0.134) | 0.189 (0.129) | 0.134 (0.134) | 0.201 (0.243) |
| N | 7,417 | 7,417 | 3,956 | 3,956 |
| Health care | 0.221 (0.147) | 0.236 (0.149) | 0.199 (0.144) | 0.219 (0.275) |
| N | 7,145 | 7,145 | 3,811 | 3,811 |
| Ceremonies or celebrations | 0.122 (0.127) | 0.111 (0.129) | 0.111 (0.128) | 0.009 (0.221) |
| N | 7,407 | 7,407 | 3,939 | 3,939 |
| Child education | −0.351*** (0.128) | −0.357*** (0.128) | −0.262** (0.132) | −0.211 (0.177) |
| N | 7,339 | 7,339 | 3,845 | 3,845 |
| Child clothing | −0.089 (0.107) | −0.079 (0.106) | 0.006 (0.107) | −0.086 (0.160) |
| N | 7,349 | 7,349 | 3,839 | 3,839 |
| Adult women clothing | −0.059 (0.077) | −0.055 (0.076) | −0.045 (0.076) | −0.076 (0.136) |
| N | 7548 | 7548 | 4010 | 4010 |
| Household and year FE | Yes | Yes | Yes | Yes |
| Controls | No | Yes | Yes | Yes |
| Limited sample | No | No | Yes | Yes |
| HH-specific time trends | No | No | No | Yes |
Changes in income and financial behavior (asinh) as the husband's migrant status changes – only considering migration spells outside of Nepal and lasting >6 months
| (1) | (2) | (3) | (4) | |
|---|---|---|---|---|
| Annual income | 0.361** (0.169) | 0.267 (0.165) | 0.245 (0.174) | 0.076 (0.226) |
| N | 7,572 | 7,572 | 2,197 | 2,197 |
| Savings deposited in past month | 0.245** (0.101) | 0.235** (0.109) | 0.332*** (0.120) | 0.062 (0.254) |
| N | 7,524 | 7,524 | 2,184 | 2,184 |
| Currently borrowing | −0.010 (0.271) | 0.152 (0.282) | 0.063 (0.310) | 0.022 (0.560) |
| N | 7,572 | 7,572 | 2,197 | 2,197 |
| Currently lending | 0.228 (0.214) | 0.362 (0.232) | 0.311 (0.258) | −0.026 (0.489) |
| N | 7,572 | 7,572 | 2,197 | 2,197 |
| Household and year FE | Yes | Yes | Yes | Yes |
| Controls | No | Yes | Yes | Yes |
| Limited sample | No | No | Yes | Yes |
| HH-specific time trends | No | No | No | Yes |
Shifts in decision-making power as the husband's migrant status changes – only considering migration spells outside of Nepal and lasting >6 months
| (1) | (2) | (3) | (4) | |
|---|---|---|---|---|
| Panel A: all categories | ||||
| Husband alone | −0.059*** (0.011) | −0.055*** (0.010) | −0.056*** (0.010) | −0.050*** (0.014) |
| Husband and wife jointly | −0.095*** (0.017) | −0.105*** (0.018) | −0.105*** (0.019) | −0.103*** (0.032) |
| Wife alone | 0.115*** (0.014) | 0.116*** (0.016) | 0.121*** (0.016) | 0.121*** (0.025) |
| N | 7,569 | 7,569 | 2,194 | 2,194 |
| Panel B: disaggregated by category | ||||
| Temptation goods | ||||
| Husband alone | −0.102*** (0.013) | −0.101*** (0.014) | −0.105*** (0.014) | −0.107*** (0.024) |
| Husband and wife jointly | −0.031*** (0.010) | −0.041*** (0.012) | −0.039*** (0.013) | −0.034* (0.020) |
| Wife alone | 0.014** (0.006) | 0.014** (0.006) | 0.012* (0.007) | 0.005 (0.015) |
| N | 7,524 | 7,524 | 2,184 | 2,184 |
| Health care | ||||
| Husband alone | −0.037** (0.015) | −0.032** (0.015) | −0.032** (0.015) | −0.028 (0.020) |
| Husband and wife jointly | −0.152*** (0.023) | −0.171*** (0.021) | −0.167*** (0.023) | −0.163*** (0.048) |
| Wife alone | 0.158*** (0.021) | 0.168*** (0.021) | 0.170*** (0.023) | 0.169*** (0.037) |
| N | 7,564 | 7,564 | 2,194 | 2,194 |
| Ceremonies or celebrations | ||||
| Husband alone | −0.049*** (0.016) | −0.044*** (0.016) | −0.046*** (0.016) | −0.033 (0.021) |
| Husband and wife jointly | −0.095*** (0.023) | −0.103*** (0.024) | −0.106*** (0.025) | −0.100** (0.047) |
| Wife alone | 0.130*** (0.019) | 0.132*** (0.021) | 0.140*** (0.023) | 0.130*** (0.039) |
| N | 7,537 | 7,537 | 2,184 | 2,184 |
| Child education | ||||
| Husband alone | −0.063*** (0.019) | −0.056*** (0.017) | −0.049*** (0.016) | −0.036 (0.022) |
| Husband and wife jointly | −0.087*** (0.027) | −0.088*** (0.027) | −0.094*** (0.029) | −0.108** (0.048) |
| Wife alone | 0.161*** (0.023) | 0.160*** (0.025) | 0.170*** (0.027) | 0.181*** (0.037) |
| N | 7,415 | 7,415 | 2,171 | 2,171 |
| Child clothing | ||||
| Husband alone | −0.071*** (0.018) | −0.067*** (0.017) | −0.063*** (0.017) | −0.053** (0.023) |
| Husband and wife jointly | −0.121*** (0.029) | −0.123*** (0.030) | −0.127*** (0.031) | −0.152*** (0.048) |
| Wife alone | 0.186*** (0.025) | 0.186*** (0.028) | 0.194*** (0.030) | 0.206*** (0.045) |
| N | 7,469 | 7,469 | 2,182 | 2,182 |
| Adult women clothing | ||||
| Husband alone | −0.049** (0.020) | −0.040** (0.019) | −0.042** (0.020) | −0.035 (0.024) |
| Husband and wife jointly | −0.162*** (0.023) | −0.180*** (0.022) | −0.175*** (0.024) | −0.190*** (0.047) |
| Wife alone | 0.170*** (0.018) | 0.179*** (0.020) | 0.185*** (0.020) | 0.196*** (0.045) |
| N | 7,553 | 7,553 | 2,192 | 2,192 |
| Household and year FE | Yes | Yes | Yes | Yes |
| Controls | No | Yes | Yes | Yes |
| Limited sample | No | No | Yes | Yes |
| HH-specific time trends | No | No | No | Yes |
Dynamic shifts in decision-making power between husband and wife: first-difference approach
| α1: returned | α2: left | P-value: |α1| = |α2| | N | |
|---|---|---|---|---|
| Panel A: Δ All categories | ||||
| Husband alone | 0.022 (0.020) | −0.026 (0.028) | 0.919 | 3,580 |
| Husband and wife jointly | 0.144*** (0.032) | −0.040 (0.031) | 0.036** | 3,580 |
| Wife alone | −0.111*** (0.023) | 0.086*** (0.028) | 0.557 | 3,580 |
| Panel B: Δ disaggregated by category | ||||
| Δ Temptation goods | ||||
| Husband alone | 0.079*** (0.025) | −0.024 (0.036) | 0.208 | 3,566 |
| Husband and wife jointly | 0.044* (0.026) | −0.031 (0.027) | 0.767 | 3,566 |
| Wife alone | −0.015 (0.017) | 0.013 (0.018) | 0.963 | 3,566 |
| Δ Health care | ||||
| Husband alone | 0.004 (0.025) | −0.024 (0.034) | 0.646 | 3,579 |
| Husband and wife jointly | 0.193*** (0.047) | −0.036 (0.048) | 0.035** | 3,579 |
| Wife alone | −0.149*** (0.032) | 0.121*** (0.041) | 0.646 | 3,579 |
| Δ Ceremonies | ||||
| Husband alone | 0.022 (0.025) | −0.019 (0.034) | 0.945 | 3,571 |
| Husband and wife jointly | 0.160*** (0.047) | −0.057 (0.050) | 0.202 | 3,571 |
| Wife alone | −0.127*** (0.039) | 0.106** (0.048) | 0.784 | 3,571 |
| Δ Child education | ||||
| Husband alone | −0.008 (0.032) | −0.063 (0.044) | 0.262 | 3,456 |
| Husband and wife jointly | 0.154*** (0.056) | −0.039 (0.055) | 0.185 | 3,456 |
| Wife alone | −0.167*** (0.044) | 0.085** (0.039) | 0.234 | 3,456 |
| Δ Child clothing | ||||
| Husband alone | 0.010 (0.033) | −0.041 (0.043) | 0.624 | 3,495 |
| Husband and wife jointly | 0.168*** (0.056) | −0.071 (0.051) | 0.238 | 3,495 |
| Wife alone | −0.169*** (0.048) | 0.109** (0.046) | 0.453 | 3,495 |
| Δ Adult women clothing | ||||
| Husband alone | 0.006 (0.036) | −0.003 (0.036) | 0.963 | 3,572 |
| Husband and wife jointly | 0.247*** (0.057) | −0.102* (0.052) | 0.078* | 3,572 |
| Wife alone | −0.195*** (0.045) | 0.099** (0.045) | 0.202 | 3,572 |
Shifts in expenditures (asinh) as the husband's migrant status changes
| (1) | (2) | (3) | (4) | |
|---|---|---|---|---|
| Temptation goods | −1.053*** (0.168) | −1.204*** (0.178) | −1.184*** (0.176) | −1.196*** (0.308) |
| N | 7,417 | 7,417 | 2,940 | 2,940 |
| Health care | −0.009 (0.142) | −0.035 (0.166) | −0.031 (0.173) | 0.257 (0.301) |
| N | 7,145 | 7,145 | 2,850 | 2,850 |
| Ceremonies or celebrations | 0.044 (0.105) | 0.014 (0.100) | 0.067 (0.109) | −0.196 (0.237) |
| N | 7,407 | 7,407 | 2,948 | 2,948 |
| Child education | 0.170* (0.101) | 0.272*** (0.104) | 0.181* (0.108) | −0.190 (0.178) |
| N | 7,339 | 7,339 | 2,954 | 2,954 |
| Child clothing | 0.385*** (0.096) | 0.442*** (0.104) | 0.437*** (0.109) | 0.176 (0.167) |
| N | 7,349 | 7,349 | 2,965 | 2,965 |
| Adult women clothing | −0.071 (0.063) | −0.057 (0.064) | −0.029 (0.065) | 0.016 (0.124) |
| N | 7,548 | 7,548 | 3,005 | 3,005 |
| Household and year FE | Yes | Yes | Yes | Yes |
| Controls | No | Yes | Yes | Yes |
| Limited sample | No | No | Yes | Yes |
| HH-specific time trends | No | No | No | Yes |
Dynamic shifts in expenditures: first-difference approach (asinh)
| α1: returned | α2: left | P-value: |α1| = |α2| | N | |
|---|---|---|---|---|
| Δ Temptation goods | 1.084*** (0.361) | −0.952** (0.386) | 0.819 | 3,491 |
| Δ Health care | 0.328 (0.369) | 0.672** (0.329) | 0.467 | 3,368 |
| Δ Ceremonies or celebrations | −0.403 (0.286) | −0.909*** (0.299) | 0.163 | 3,473 |
| Δ Child education | −0.310 (0.236) | −0.450* (0.258) | 0.615 | 3,389 |
| Δ Child clothing | −0.107 (0.213) | −0.119 (0.243) | 0.955 | 3,407 |
| Δ Adult women clothing | −0.027 (0.153) | −0.120 (0.165) | 0.693 | 3,563 |
Heterogeneity by trip length: change in decision-making (all categories)
| (1) | (2) | (3) | (4) | |
|---|---|---|---|---|
| Dependent variable: husband alone | ||||
| Migrant | 0.00525 (0.0145) | 0.00860 (0.0152) | 0.00735 (0.0148) | 0.0209 (0.0257) |
| Migrant × ≥ 6 months | −0.0619*** (0.0144) | −0.0616*** (0.0152) | −0.0600*** (0.0152) | −0.0541** (0.0224) |
| N | 7,569 | 7,569 | 3,010 | 3,010 |
| Dep. variable: husband and wife jointly | ||||
| Migrant | −0.0784*** (0.0212) | −0.0975*** (0.0232) | −0.0905*** (0.0242) | −0.105*** (0.0356) |
| Migrant × ≥ 6 months | −0.0180 (0.0231) | −0.0184 (0.0224) | −0.0176 (0.0225) | −0.0274 (0.0362) |
| N | 7,569 | 7,569 | 3,010 | 3,010 |
| Dep. variable: wife alone | ||||
| Migrant | 0.0645*** (0.0178) | 0.0700*** (0.0194) | 0.0738*** (0.0210) | 0.0631* (0.0322) |
| Migrant × ≥ 6 months | 0.0478** (0.0221) | 0.0485** (0.0224) | 0.0467** (0.0224) | 0.0606* (0.0330) |
| N | 7,569 | 7,569 | 3,010 | 3,010 |
| Household FE | Yes | Yes | Yes | Yes |
| Controls | No | Yes | Yes | Yes |
| Limited sample | No | No | Yes | Yes |
| HH-specific time trends | No | No | No | Yes |
Shifts in decision-making power as son's migration status changes
| (1) | (2) | (3) | (4) | |
|---|---|---|---|---|
| Panel A: All categories | ||||
| Husband alone | −0.042*** (0.010) | −0.038*** (0.010) | −0.039*** (0.009) | −0.019 (0.016) |
| Husband and wife jointly | 0.010 (0.012) | 0.008 (0.012) | 0.010 (0.012) | 0.012 (0.021) |
| Wife alone | 0.011 (0.008) | 0.011 (0.008) | 0.012 (0.008) | 0.004 (0.015) |
| N | 7,569 | 7,569 | 4,025 | 4,025 |
| Panel B: Disaggregated by category | ||||
| Temptation goods | ||||
| Husband alone | 0.011 (0.011) | 0.008 (0.011) | 0.006 (0.011) | 0.029 (0.022) |
| Husband and wife jointly | 0.004 (0.011) | 0.005 (0.011) | 0.002 (0.011) | −0.008 (0.021) |
| Wife alone | 0.010 (0.007) | 0.010 (0.007) | 0.009 (0.008) | 0.004 (0.015) |
| N | 7,524 | 7,524 | 4,009 | 4,009 |
| Health care | ||||
| Husband alone | 0.001 (0.013) | 0.001 (0.013) | −0.004 (0.012) | −0.017 (0.018) |
| Husband and wife jointly | 0.023 (0.017) | 0.020 (0.017) | 0.023 (0.018) | 0.040 (0.031) |
| Wife alone | 0.012 (0.010) | 0.012 (0.010) | 0.014 (0.010) | 0 (0.017) |
| N | 7,564 | 7,564 | 4,020 | 4,020 |
| Ceremonies or celebrations | ||||
| Husband alone | 0.001 (0.012) | 0.001 (0.012) | −0.004 (0.012) | −0.007 (0.018) |
| Husband and wife jointly | 0.035** (0.016) | 0.031* (0.016) | 0.032* (0.017) | 0.044 (0.027) |
| Wife alone | 0.015 (0.013) | 0.015 (0.013) | 0.016 (0.013) | −0.002 (0.020) |
| N | 7,537 | 7,537 | 4,013 | 4,013 |
| Child education | ||||
| Husband alone | −0.003 (0.014) | −0.005 (0.014) | −0.009 (0.014) | −0.032 (0.019) |
| Husband and wife jointly | −0.043** (0.020) | −0.045** (0.020) | −0.035* (0.020) | −0.035 (0.035) |
| Wife alone | 0.010 (0.012) | 0.012 (0.013) | 0.016 (0.013) | 0.009 (0.023) |
| N | 7,415 | 7,415 | 3,897 | 3,897 |
| Child clothing | ||||
| Husband alone | 0.004 (0.013) | 0.002 (0.013) | −0.004 (0.012) | −0.023 (0.018) |
| Husband and wife jointly | −0.007 (0.020) | −0.009 (0.020) | 0.001 (0.020) | 0.007 (0.032) |
| Wife alone | 0.009 (0.013) | 0.012 (0.013) | 0.012 (0.013) | 0 (0.024) |
| N | 7,469 | 7,469 | 3,938 | 3,938 |
| Adult women clothing | ||||
| Husband alone | 0.008 (0.014) | 0.007 (0.014) | 0.001 (0.013) | −0.015 (0.020) |
| Husband and wife jointly | 0.013 (0.020) | 0.011 (0.020) | 0.011 (0.019) | −0.010 (0.038) |
| Wife alone | 0.008 (0.018) | 0.007 (0.018) | 0.012 (0.018) | 0.022 (0.025) |
| N | 7,553 | 7,553 | 4,013 | 4,013 |
| Household and year FE | Yes | Yes | Yes | Yes |
| Controls | No | Yes | Yes | Yes |
| Limited sample | No | No | Yes | Yes |
| HH-specific time trends | No | No | No | Yes |
Shifts in expenditures (asinh) as the husband's migrant status changes – only considering migration spells outside of Nepal and lasting >6 months
| (1) | (2) | (3) | (4) | |
|---|---|---|---|---|
| Temptation goods | −1.325*** (0.180) | −1.427*** (0.179) | −1.482*** (0.170) | −1.589*** (0.328) |
| N | 7,417 | 7,417 | 2,144 | 2,144 |
| Health care | −0.051 (0.194) | −0.089 (0.217) | −0.090 (0.229) | 0.035 (0.354) |
| N | 7,145 | 7,145 | 2,083 | 2,083 |
| Ceremonies or celebrations | 0.135 (0.111) | 0.124 (0.114) | 0.137 (0.109) | −0.179 (0.225) |
| N | 7,407 | 7,407 | 2,155 | 2,155 |
| Child education | 0.226** (0.112) | 0.312*** (0.114) | 0.285** (0.111) | −0.078 (0.182) |
| N | 7,339 | 7,339 | 2,155 | 2,155 |
| Child clothing | 0.338*** (0.108) | 0.360*** (0.109) | 0.320*** (0.107) | 0.204 (0.175) |
| N | 7,349 | 7,349 | 2,161 | 2,161 |
| Adult women clothing | 0.043 (0.073) | 0.069 (0.077) | 0.064 (0.082) | 0.165 (0.148) |
| N | 7,548 | 7,548 | 2,191 | 2,191 |
| Household and year FE | Yes | Yes | Yes | Yes |
| Controls | No | Yes | Yes | Yes |
| Limited sample | No | No | Yes | Yes |
| HH-specific time trends | No | No | No | Yes |
Dynamic shifts in decision-making power between husband and wife: first-difference approach with the dummy Gone
| α1: returned | α2: left | α3: gone | P-value: |α1| = |α2| | N | |
|---|---|---|---|---|---|
| Panel A: Δ all categories | |||||
| Husband alone | 0.019 (0.032) | −0.029 (0.038) | −0.005 (0.039) | 0.879 | 3,580 |
| Husband and wife jointly | 0.123*** (0.045) | −0.063 (0.042) | −0.042 (0.050) | 0.440 | 3,580 |
| Wife alone | −0.109*** (0.030) | 0.088** (0.037) | 0.004 (0.039) | 0.730 | 3,580 |
| Panel B: Δ disaggregated by category | |||||
| Δ Temptation goods | |||||
| Husband alone | 0.081*** (0.029) | −0.022 (0.047) | 0.005 (0.040) | 0.344 | 3,566 |
| Husband and wife jointly | 0.017 (0.036) | −0.060* (0.036) | −0.053 (0.048) | 0.523 | 3,566 |
| Wife alone | −0.028 (0.022) | −0.000 (0.023) | −0.025 (0.028) | 0.136 | 3,566 |
| Δ Health care | |||||
| Husband alone | 0.001 (0.041) | −0.027 (0.047) | −0.006 (0.049) | 0.741 | 3,579 |
| Husband and wife jointly | 0.159** (0.062) | −0.072 (0.065) | −0.066 (0.064) | 0.436 | 3,579 |
| Wife alone | −0.103** (0.040) | 0.170*** (0.053) | 0.090 (0.055) | 0.418 | 3,579 |
| Δ Ceremonies | |||||
| Husband alone | 0.035 (0.041) | −0.005 (0.051) | 0.026 (0.054) | 0.724 | 3,571 |
| Husband and wife jointly | 0.182*** (0.059) | −0.034 (0.064) | 0.042 (0.065) | 0.188 | 3,571 |
| Wife alone | −0.137*** (0.039) | 0.095* (0.056) | −0.019 (0.060) | 0.630 | 3,571 |
| Δ Child education | |||||
| Husband alone | −0.019 (0.049) | −0.075 (0.055) | −0.021 (0.057) | 0.254 | 3,456 |
| Husband and wife jointly | 0.105 (0.064) | −0.091 (0.073) | −0.095 (0.077) | 0.909 | 3,456 |
| Wife alone | −0.168*** (0.055) | 0.084 (0.053) | −0.002 (0.062) | 0.390 | 3,456 |
| Δ Child clothing | |||||
| Husband alone | 0.004 (0.052) | −0.048 (0.056) | −0.012 (0.059) | 0.660 | 3,495 |
| Husband and wife jointly | 0.104 (0.072) | −0.139** (0.066) | −0.125* (0.074) | 0.766 | 3,495 |
| Wife alone | −0.150** (0.060) | 0.129** (0.054) | 0.037 (0.061) | 0.835 | 3,495 |
| Δ Adult women clothing | |||||
| Husband alone | 0.003 (0.058) | −0.005 (0.056) | −0.005 (0.072) | 0.984 | 3,572 |
| Husband and wife jointly | 0.247*** (0.075) | −0.103 (0.071) | −0.001 (0.077) | 0.262 | 3,572 |
| Wife alone | −0.195*** (0.060) | 0.099 (0.062) | −0.002 (0.075) | 0.382 | 3,572 |
Decision-making outcomes by migrant status
| (1) | (2) | (3) | (4) | |
|---|---|---|---|---|
| Overall | Ever migrate | Never migrate | P-value (2) – (3) | |
| Panel A: All categories | ||||
| Husband alone | 0.136 | 0.105 | 0.156 | 0.000*** |
| [0.209] | [0.187] | [0.220] | ||
| Husband and wife jointly | 0.338 | 0.304 | 0.361 | 0.000*** |
| [0.313] | [0.313] | [0.310] | ||
| Wife alone | 0.108 | 0.177 | 0.062 | 0.000*** |
| [0.208] | [0.256] | [0.152] | ||
| Panel B: Disaggregated by category | ||||
| Temptation goods | ||||
| Husband alone | 0.192 | 0.157 | 0.214 | 0.000*** |
| [0.293] | [0.274] | [0.302] | ||
| Husband and wife jointly | 0.107 | 0.080 | 0.125 | 0.000*** |
| [0.254] | [0.224] | [0.270] | ||
| Wife alone | 0.042 | 0.044 | 0.040 | 0.268 |
| [0.146] | [0.151] | [0.143] | ||
| Health care | ||||
| Husband alone | 0.120 | 0.087 | 0.141 | 0.000*** |
| [0.274] | [0.234] | [0.296] | ||
| Husband and wife jointly | 0.418 | 0.364 | 0.454 | 0.000*** |
| [0.437] | [0.434] | [0.435] | ||
| Wife alone | 0.110 | 0.193 | 0.056 | 0.000*** |
| [0.277] | [0.348] | [0.199] | ||
| Ceremonies or celebrations | ||||
| Husband alone | 0.124 | 0.093 | 0.144 | 0.000*** |
| [0.288] | [0.252] | [0.308] | ||
| Husband and wife jointly | 0.479 | 0.432 | 0.510 | 0.000*** |
| [0.438] | [0.438] | [0.435] | ||
| Wife alone | 0.137 | 0.211 | 0.089 | 0.000*** |
| [0.300] | [0.359] | [0.241] | ||
| Child education | ||||
| Husband alone | 0.131 | 0.097 | 0.154 | 0.000*** |
| [0.325] | [0.283] | [0.348] | ||
| Husband and wife jointly | 0.387 | 0.391 | 0.384 | 0.528 |
| [0.474] | [0.475] | [0.474] | ||
| Wife alone | 0.128 | 0.245 | 0.049 | 0.000*** |
| [0.324] | [0.419] | [0.206] | ||
| Child clothing | ||||
| Husband alone | 0.124 | 0.096 | 0.144 | 0.000*** |
| [0.311] | [0.278] | [0.330] | ||
| Husband and wife jointly | 0.385 | 0.381 | 0.387 | 0.556 |
| [0.466] | [0.467] | [0.465] | ||
| Wife alone | 0.140 | 0.262 | 0.058 | 0.000*** |
| [0.331] | [0.424] | [0.216] | ||
| Adult women clothing | ||||
| Husband alone | 0.130 | 0.100 | 0.149 | 0.000*** |
| [0.336] | [0.301] | [0.356] | ||
| Husband and wife jointly | 0.459 | 0.382 | 0.510 | 0.000*** |
| [0.498] | [0.486] | [0.500] | ||
| Wife alone | 0.236 | 0.342 | 0.166 | 0.000*** |
| [0.424] | [0.474] | [0.372] | ||
| N | 7,572 | 3,013 | 4,559 | 7,572 |
Shifts in decision-making power as the husband's migrant status changes
| (1) | (2) | (3) | (4) | |
|---|---|---|---|---|
| Panel A: all categories | ||||
| Husband alone | −0.042*** (0.010) | −0.038*** (0.010) | −0.039*** (0.009) | −0.019 (0.016) |
| Husband and wife jointly | −0.092*** (0.014) | −0.112*** (0.016) | −0.104*** (0.016) | −0.125*** (0.026) |
| Wife alone | 0.101*** (0.011) | 0.107*** (0.013) | 0.110*** (0.014) | 0.108*** (0.019) |
| N | 7,569 | 7,569 | 3,010 | 3,010 |
| Panel B: Disaggregated by category | ||||
| Temptation goods | ||||
| Husband alone | −0.065*** (0.014) | −0.064*** (0.016) | −0.067*** (0.016) | −0.065** (0.027) |
| Husband and wife jointly | −0.037*** (0.009) | −0.052*** (0.011) | −0.044*** (0.012) | −0.055*** (0.018) |
| Wife alone | 0.017*** (0.005) | 0.018*** (0.005) | 0.016*** (0.006) | 0.009 (0.011) |
| N | 7,524 | 7,524 | 2,993 | 2,993 |
| Health care | ||||
| Husband alone | −0.038*** (0.013) | −0.035** (0.014) | −0.031** (0.013) | −0.005 (0.022) |
| Husband and wife jointly | −0.131*** (0.018) | −0.161*** (0.020) | −0.147*** (0.022) | −0.161*** (0.040) |
| Wife alone | 0.140*** (0.017) | 0.160*** (0.020) | 0.155*** (0.022) | 0.154*** (0.031) |
| N | 7,564 | 7,564 | 3,009 | 3,009 |
| Ceremonies or celebrations | ||||
| Husband alone | −0.037*** (0.012) | −0.031** (0.012) | −0.030** (0.012) | −0 (0.023) |
| Husband and wife jointly | −0.104*** (0.019) | −0.126*** (0.021) | −0.114*** (0.022) | −0.130*** (0.037) |
| Wife alone | 0.119*** (0.014) | 0.127*** (0.017) | 0.127*** (0.018) | 0.118*** (0.028) |
| N | 7,537 | 7,537 | 2,999 | 2,999 |
| Child education | ||||
| Husband alone | −0.043*** (0.016) | −0.036** (0.015) | −0.038*** (0.015) | −0.016 (0.024) |
| Husband and wife jointly | −0.091*** (0.023) | −0.099*** (0.024) | −0.108*** (0.027) | −0.137*** (0.045) |
| Wife alone | 0.135*** (0.018) | 0.139*** (0.022) | 0.153*** (0.023) | 0.147*** (0.031) |
| N | 7,415 | 7,415 | 2,978 | 2,978 |
| Child clothing | ||||
| Husband alone | −0.043*** (0.014) | −0.038*** (0.014) | −0.037*** (0.014) | −0.013 (0.023) |
| Husband and wife jointly | −0.106*** (0.023) | −0.114*** (0.026) | −0.127*** (0.027) | −0.181*** (0.041) |
| Wife alone | 0.153*** (0.018) | 0.159*** (0.023) | 0.172*** (0.023) | 0.171*** (0.033) |
| N | 7,469 | 7,469 | 2,995 | 2,995 |
| Adult women clothing | ||||
| Husband alone | −0.034** (0.014) | −0.023 (0.015) | −0.031** (0.015) | −0.002 (0.025) |
| Husband and wife jointly | −0.147*** (0.023) | −0.177*** (0.025) | −0.164*** (0.026) | −0.202*** (0.049) |
| Wife alone | 0.150*** (0.018) | 0.167*** (0.022) | 0.167*** (0.023) | 0.167*** (0.040) |
| N | 7,553 | 7,553 | 3,008 | 3,008 |
| Household and year FE | Yes | Yes | Yes | Yes |
| Controls | No | Yes | Yes | Yes |
| Limited sample | No | No | Yes | Yes |
| HH-specific time trends | No | No | No | Yes |
Changes in expenditures, income, and financial behavior as the husband's migrant status changes – top-coded at the 95th percentile
| (1) | (2) | (3) | (4) | |
|---|---|---|---|---|
| Panel A: expenditures | ||||
| Temptation goods | −126.360*** (38.072) | −137.050*** (38.904) | −117.563*** (39.783) | −103.698 (63.795) |
| N | 7,417 | 7,417 | 2,940 | 2,940 |
| Health care | −75.066 (133.753) | −3.897 (121.987) | −36.762 (119.550) | 154.302 (255.985) |
| N | 7,145 | 7,145 | 2,850 | 2,850 |
| Ceremonies or celebrations | −91.457 (92.147) | −121.699 (94.857) | −98.522 (116.511) | −163.506 (172.497) |
| N | 7,407 | 7,407 | 2,948 | 2,948 |
| Children's education | 47.410 (37.658) | 58.955 (41.153) | 29.104 (44.499) | −70.578 (63.297) |
| N | 7,339 | 7,339 | 2,954 | 2,954 |
| Children's clothing | 47.525*** (16.438) | 46.156*** (16.379) | 48.749*** (17.297) | 22.596 (34.274) |
| N | 7,349 | 7,349 | 2,965 | 2,965 |
| Adult women's clothing | −7.454 (13.565) | −3.645 (14.699) | 1.919 (14.565) | 13.527 (27.480) |
| N | 7,548 | 7,548 | 3,005 | 3,005 |
| Panel B: income and financial behavior | ||||
| Annual income | 42,899.597*** (7,854.542) | 40,695.726*** (8,243.078) | 39,730.933*** (10,362.565) | 48,730.244***(15,369.961) |
| N | 7,572 | 7,572 | 3,013 | 3,013 |
| Savings deposited in past month | 11.375 (23.572) | 18.660 (28.278) | 10.282 (33.734) | −5.363 (56.177) |
| N | 7,524 | 7,524 | 2,996 | 2,996 |
| Currently borrowing | 1,178.234 (3,369.408) | 2,149.937 (3,874.228) | 201.140 (4,213.134) | −2,007.624 (8,311.890) |
| N | 7,572 | 7,572 | 3,013 | 3,013 |
| Currently lending | 53.964 (667.219) | 536.425 (749.997) | 120.092 (909.763) | −1,694.717 (1,763.982) |
| N | 7,572 | 7,572 | 3,013 | 3,013 |
| Household and year FE | Yes | Yes | Yes | Yes |
| Controls | No | Yes | Yes | Yes |
| Limited sample | No | No | Yes | Yes |
| HH-specific time trends | No | No | No | Yes |