
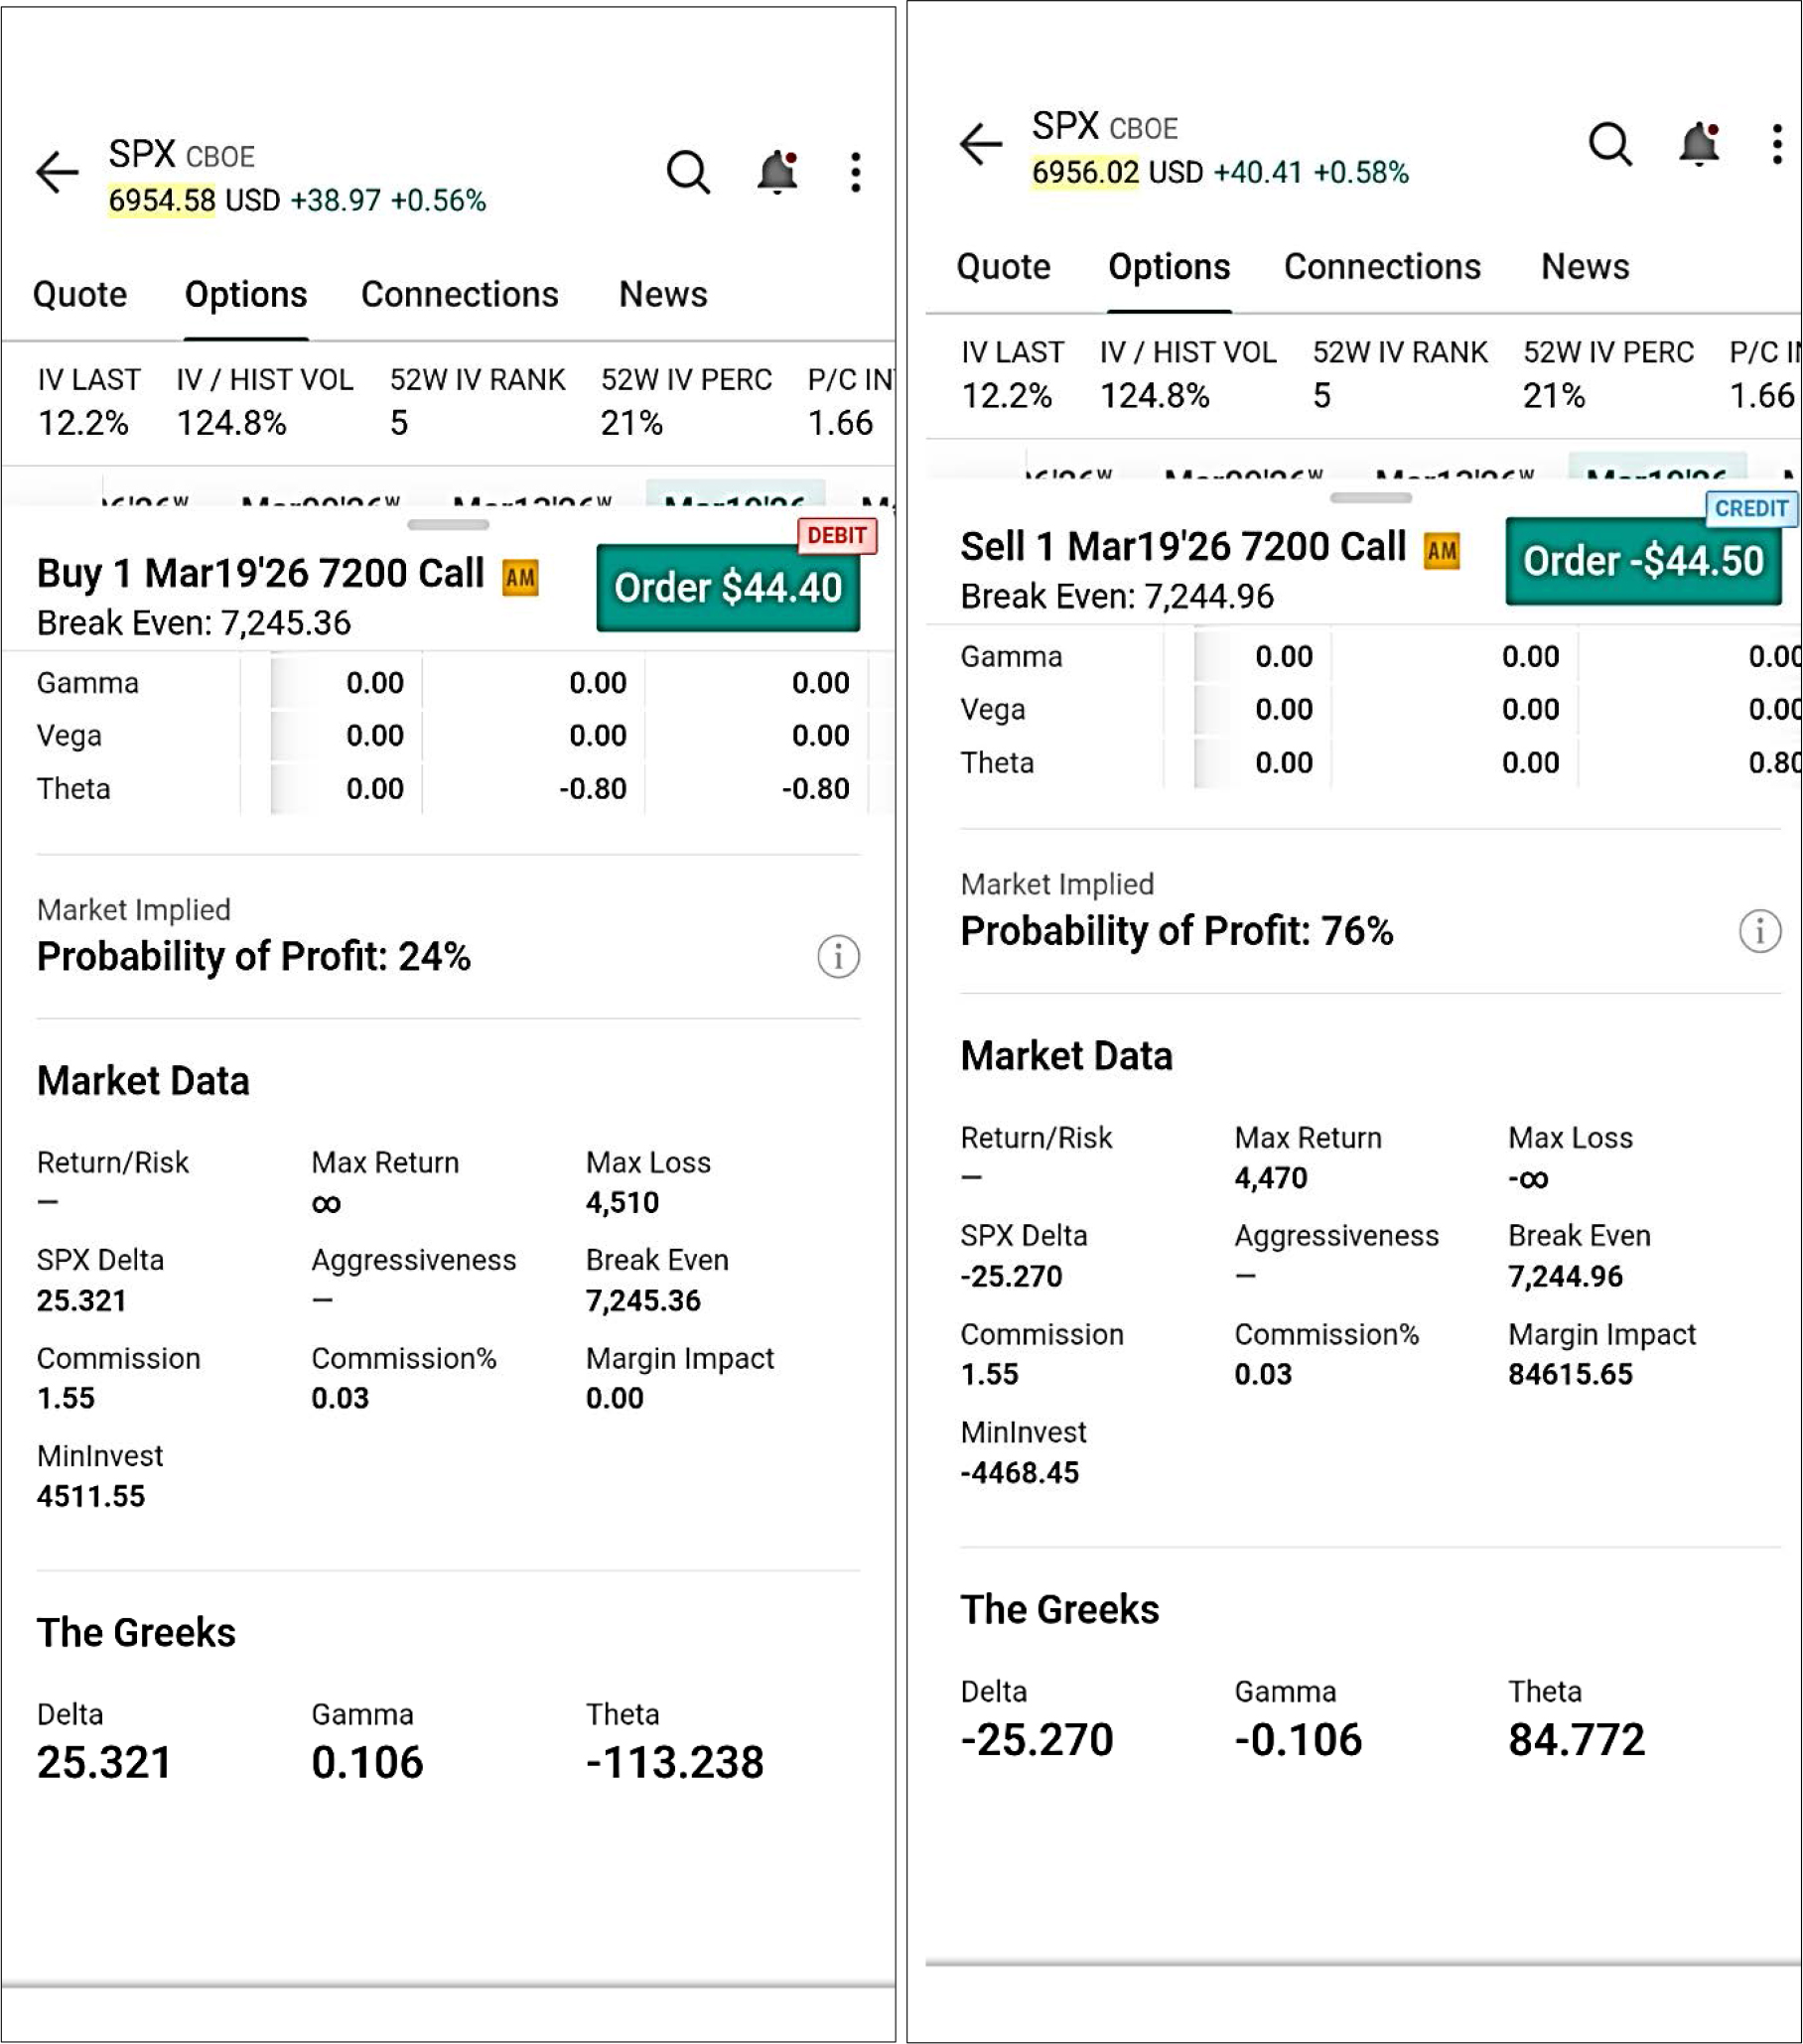
Figure A1.
Comparing buying to selling a call with the same strike price and DTE.
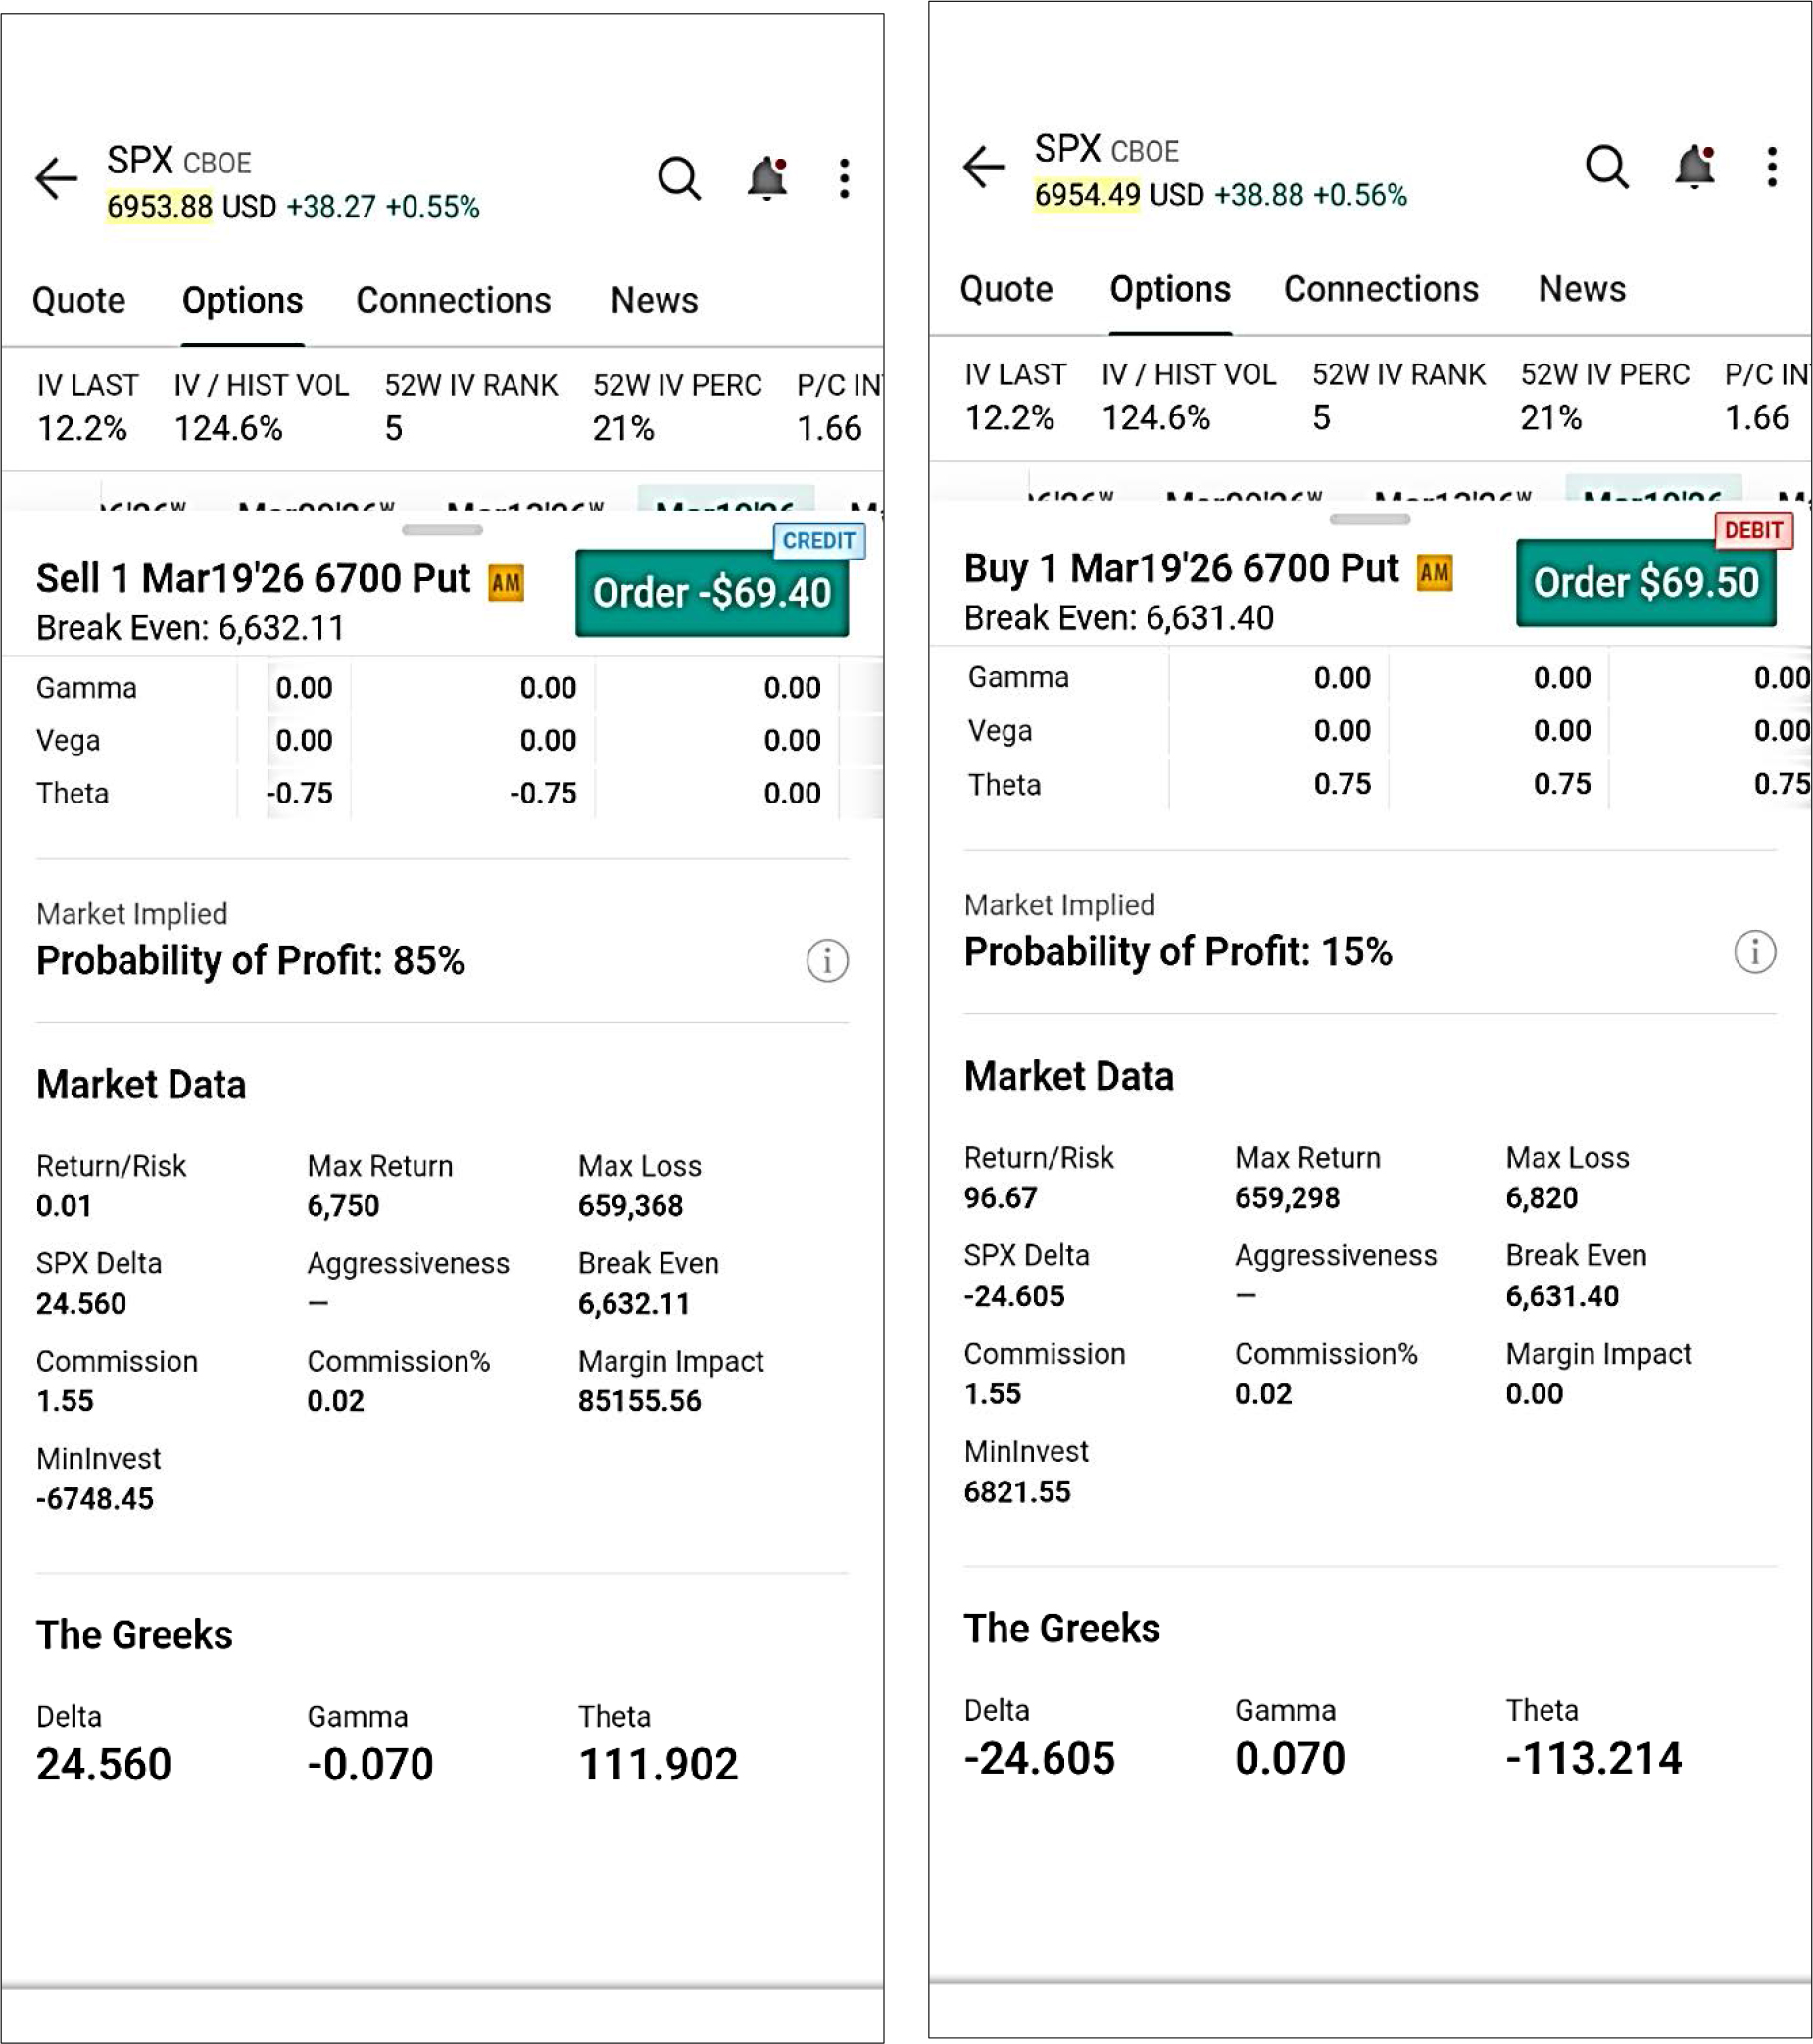
Figure A2.
Comparing the probability of profit between buying and selling a SPX put with strike price at $6,700.
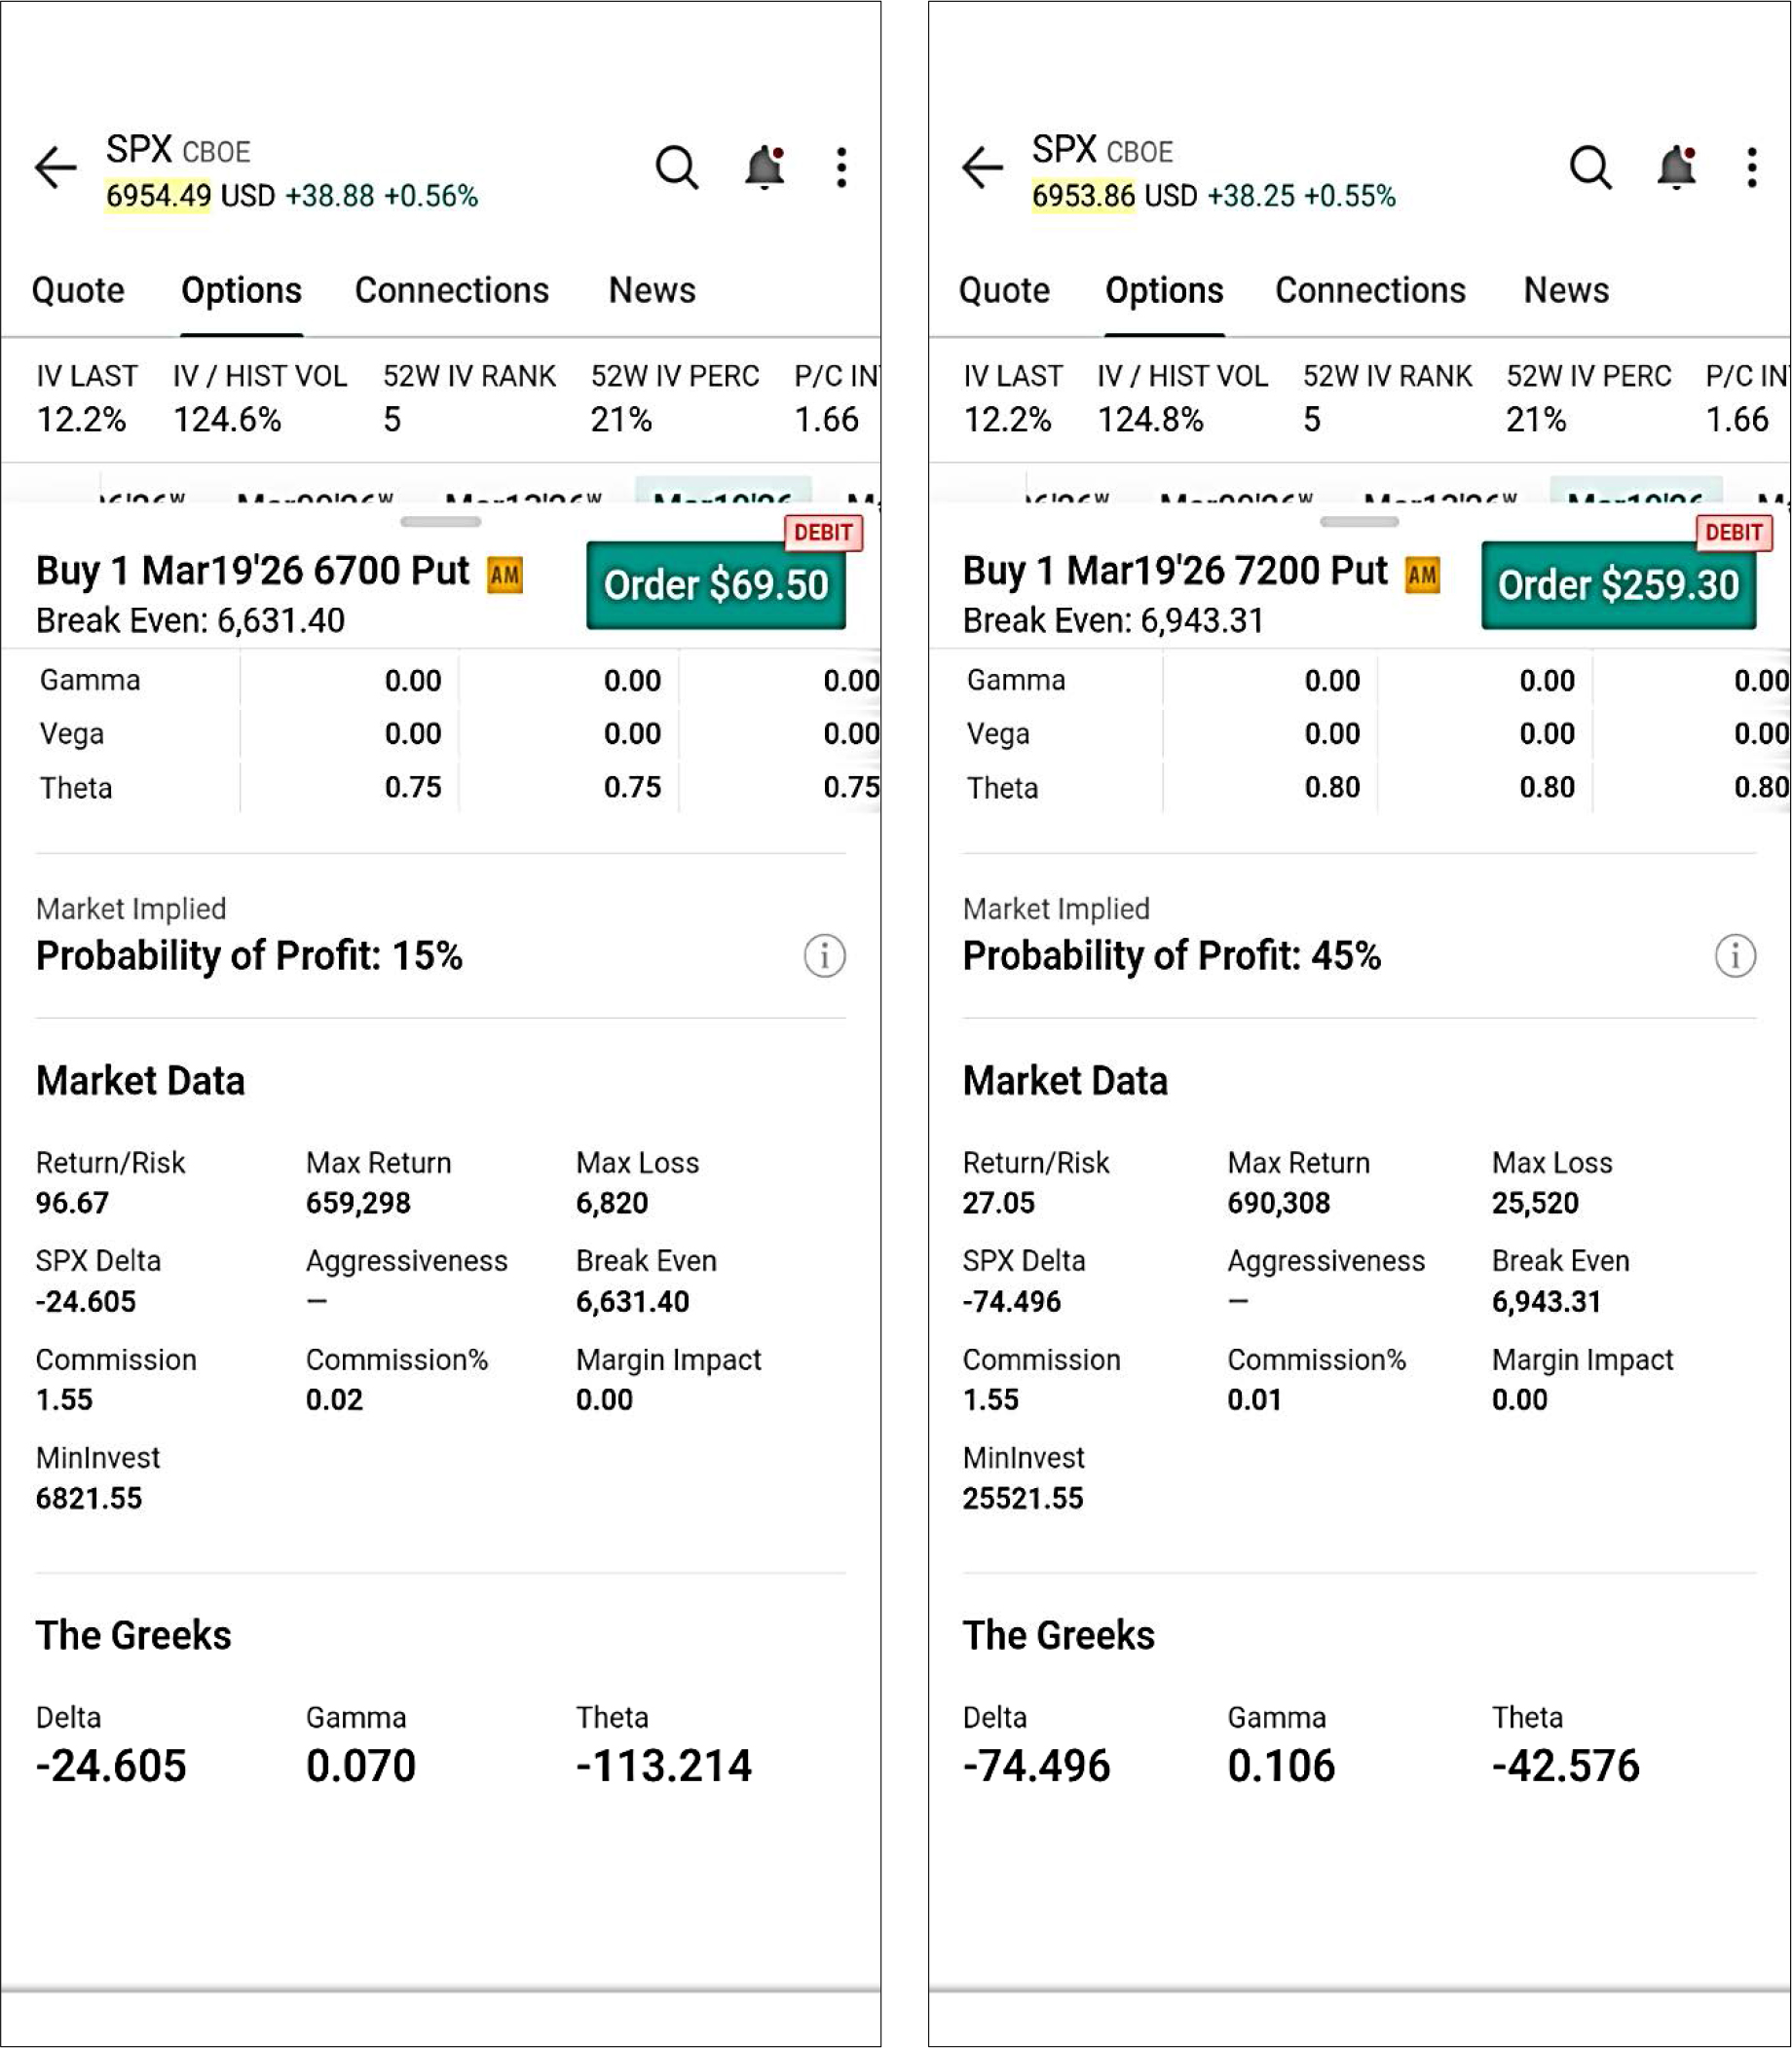
Figure A3.
Comparing the probability of profit from buying a SPX put with a strike price at $6,700 versus $7,200. The SPX was trading around $6,954.
Table A1.
Defined-risk option strategies
| Strategy | Notes |
|---|---|
| Generate Cash Flow in Stagnated or Sideways Market | |
| Covered call: hold the underlying asset and sell OTM call |
|
| Protect Underlying Asset from Severe Drawdowns | |
| Protective put: hold the underlying asset and buy OTM (or ATM) put |
|
| Protect Underlying Asset from Severe Drawdowns at Reduced Cost | |
| Collar: hold the underlying asset, buy OTM put and sell OTM call |
|
| Mitigate Severe Drawdowns by Using Cash Secured Call | |
| Cash secured call/Fiduciary call: buy call and invest cash in risk-free asset |
|
| Limited Upside (Bull Spread) or Downside (Bear Spread) Participation with Preset Losses | |
| Bull Spread i. Call spread: buy call at X1 and sell at X2 where X2 > X1 |
|
| ii. Put spread: buy put at X1 and sell at X2 where X2 > X1 |
|
| Bear Spread i. Put spread: sell call at X1 and buy at X2 where X2 > X1 |
|
| ii. Call spread: sell put at X1 and buy at X2 where X2 > X1 |
|