
Recently, attention has been directed toward clean energy to meet the increase in loads in the distribution system networks, because it is not harmful to the environment and reduces global warming. In addition to the environmental benefit, renewable energy sources provide technical benefits, such as reducing active and reactive power losses, improving voltage profile level and stability, and increasing reliability and resilience of the system networks. Renewable energy also provides an economic benefit by reducing operating and fuel costs, thus the economic benefit is reflected in favor of consumers [1,2,3,4,5]. Distribution generators are part of renewable energy sources; they can be defined as small units that are directly connected to the distribution network precisely at locations near to the load centers to ensure reliable power access for consumers. The integration of distribution generators in the distribution network leads to the flow of power in multiple directions instead of one direction. This technique is considered one of the benefits of distribution generators to improve the performance of the distribution network. Distribution generators must be controlled and not penetrate the distribution network largely and randomly, which would harm distribution networks [6,7,8,9].
According to the previous analysis of renewable energy sources, specifically distribution generator units, it is very important to detect the optimal locations and sizes of distribution generators to obtain the best performance of the distribution network. Many research papers and researchers have addressed the dilemma of finding optimization strategies to improve the performance of radial distribution networks (RDN), and the analytical methods have been proposed by a group of researchers to find solutions to the problems of optimal locations and sizes of distribution generators [10,11,12]. On the other hand, in [13,14,15] many optimization algorithms have been used to find the solutions of optimal locations and sizes of distribution generators.
In this paper, the results are compared with previous literature to find the optimal locations and sizes. In Sultana & Roy [16], the multi-objective semi-opposite teaching-based learning optimization was proposed to improve technical objectives (power loss reduction, voltage stability index [VSI], and voltage deviation) of an RDN. In Nagaballi & Kale [17], the Jaya algorithm, which is a modified teaching-learning-based optimization, the gray wolf optimizer was introduced to find a set of best solutions between technical and economic objectives. In Sharma et al. [18], the quasi-oppositional swine influenza model-based optimization with quarantine algorithm has been presented to reduce power losses in the network, improve voltage regulation, and improve voltage stability within system operation and safety constraints in RDN. In Imran et al. [19], the fireworks algorithm was proposed to reconfigure and allocate optimal distributed power generation units in the distribution network simultaneously, with the aim of reducing power loss and enhancing voltage stability. In Rao et al. [20], the harmony search algorithm was presented to solve the problem of network reconfiguration in the presence of distributed generation (DG) to minimize real power losses and improve the voltage profile in the distribution system. In Kowsalya [21], the bacterial foraging optimization was proposed to reduce grid power losses, minimize operating costs, and improve voltage stability. In Balu & Mukherjee [22], the Harris hawks optimization technique was provided to reduce active power loss (APL), total voltage deviation, and VSI of RDN. In Khasanov et al. [23], the Henry gas solubility optimization method was presented to reduce total power losses. Standard 33 bus and 69 bus test systems were used to verify the effectiveness of the proposed method. In Uniyal & Sarangi [24], the adaptive modified whale optimization algorithm was proposed to improve the voltage stability and loss profile of the distribution system, taking into account the probabilistic loads and DGs operating at varying power factors. In El-Maksoud et al. [25], the modified particle swarm optimization was proposed to simultaneously optimize distribution network reconfiguration and allocation of multiple DG units to minimize the total real power loss of the RDN.
Referring to the related literature of the above presentation of the previous literature in this paper, the essential contributions can be summarized as follows:
Proposing modern approaches of optimization techniques such as mountain gazelle optimizer (MGO) and Eel and grouper optimizer (EGO) to detect the PVDG location and size in RDN.
Improving technical and economic aspects of RDN is satisfied using PVDG based on the proposed algorithms.
Applying the proposed algorithms with a single objective function (OF) (active power loss index [APLI] and VSI) and multiple objective functions (MOF).
Implementing the proposed algorithms on the standard RDN such as IEEE 69 BUS.
Implementing the proposed algorithms on the practical RDN such as IRAQI 77 BUS.
Finally, comparing and analyzing previous studies to assess the effectiveness of the proposed algorithms.
This paper is presented as follows: section (Introduction) provides the literature survey of the previous papers and the main contribution of this paper, section (Problem formulation) presents the mathematical model of RDN and PVDG as OF with constraints, section (Optimization algorithms) describes the behaviors of MGO and EGO techniques for detecting the optimal location and sizing of PVDG in RDN, section (Study and simulation results) presents and discusses the numerical results and compares them with previous results, and section (Conclusion) provides the conclusion and future work of this paper.
In this part of the paper, the goal is to minimize a Multi-Objective Function (MOF) using a Photovoltaic Distribution Generator (PVDG). MOF is represented by the APLI, the Reactive Power Loss Index (RPLI), the Voltage Deviation Index (VDI), the VSI, and the Investment Cost of PVDG units (ICDG).
The first OF1 is obtained by minimizing APLI; this OF has been adopted in Refs [26,27,28], which is expressed mathematically by the following equations:
The second OF2 is obtained by minimizing RPLI; this OF has been adopted in Refs [28, 29], which is expressed mathematically by the following equations:
The third OF3 is obtained by minimizing VDI; this OF has been adopted in Refs [28, 30], which is expressed mathematically by the following equations:
The fourth OF4 is obtained by minimizing the inverse of the VSI; the limit of VSI lies between [1 0], where 1 refers to the best value while 0 refers to the collapse point; this OF has been adopted in Refs [30,31,32], which is expressed mathematically by the following equations:
The fifth OF5 is obtained by minimizing ICDG; this OF has been adopted in Refs [33, 34], which is expressed mathematically by the following equations:
MOF represents the sum of the OFs that have been stated individually and can be represented mathematically by the following equation:
To implement MOF, a set of equality and inequality constraints must be satisfied, the active and reactive power balanced, such as equality constraints, which are expressed mathematically by the following equations:
The voltage limits and PVDG unit limits, such as inequality constraints, are expressed mathematically by the following equations:
In this part of the paper, two modern approaches of optimization algorithms have been proposed to detect optimal location and sizing of PVDG in RDN. These optimization algorithms are MGO and EGO. The optimization algorithms are generally implemented in Figure 1. In this figure, each algorithm is explained separately and represented by the red rectangle line (or box).

Flowchart of the proposed optimization algorithms. APL, active power loss; DG, distributed generation; RPL, reactive power loss; VDI, voltage deviation index; VSI, voltage stability index.
The MGO is a modern optimization technique that depends on the search for food during the migration of gazelle herds. Mountain gazelles consist of three groups: adult male gazelle herds (territorial), young male gazelle herds, and female gazelle herds with offspring. During the optimization process, any gazelle can be a member of any group [35, 36]. The MGO can be represented mathematically using the following stages:
While modeling Territorial Solitary Males (TSM), young gazelle males try to dominate the female gazelles’ territories, and as strong adult male gazelles maintain and protect these territories, this stage is expressed by the following equation:
Modeling Maternity Herds (MH)— while adult male gazelles age and lose their strength, young male gazelles attempt to dominate the female gazelle herds’ territories to mate with females and produce new offspring, and this stage is expressed by the following equation:
Modeling Bachelor Male Herds (BMH)— after the young male gazelles complete their growth and reach adulthood, they try to create new territories and dominate female gazelles. Consequently, violent conflicts occur between them and older males. The following equation expresses this stage:
Modeling Migration in search of food (MSF)— mountain gazelles have the capability to run quickly and jump, which helps to move long distances and migrate in search of food sources and this stage is expressed by the following equation:
A flow chart has been shown in Figure 2 for optimal location and sizing of PVDG in RDN using MGO.

Flowchart of the proposed MGO. BMH, bachelor male herds; DG, distributed generation; MH, maternity herds; MGO, mountain gazelle optimizer; MSF, migration to search of food; TSM, territorial solitary males.
The EGO is a modern optimization technique based on the principle of cooperative or symbiotic participation between grouper fish and moray eel to hunt prey and search for food. Grouper hunts prey in open water while eel have the ability to penetrate coral reefs. Consequently, grouper tracks prey and send signals to the eel to carry out the cooperative or symbiotic pursuit and hunting process [37, 38]. To implement the EGO mathematically, the following processes can be used.
The process of exploration is the process of tracking prey by the grouper; grouper seeks to find the best OF based on the location of the prey, while the eel location is chosen randomly that rests nearby close to location of the prey. This process is modeled by the following equations:
The process of sending a signal from grouper to moray eel, after grouper’s prey escapes to the coral reef, the grouper sends a signal to a nearby moray eel in the crevice by head shaking and moving its dorsal fin. This process is modeled by the following equations:
The process of exploitation (associative process) is the process of cooperative or symbiotic participation to attack prey, and in this process, the chances of catching prey increase and this process is modeled by the following equations:
A flow chart has been represented in Figure 3 for optimal location and sizing of PVDG in RDN using EGO.

Flowchart of the proposed EGO. DG, distributed generation; EGO, Eel and grouper optimizer.
In this paper, the proposed optimization algorithms have been implemented on the standard test of RDN such as IEEE 69 BUS and on the practical RDN of the Iraqi distribution grid, which is BAQ-CENTER-ALTABO-SARYA 77 BUS.
IEEE 69 BUS, as shown in Figure 4, consists of 68 lines, with a base voltage of 12.66 kV and a base MVA of 100 MVA. Bus 1 or Node 1 (green node) is the slack bus, the red nodes are load buses, and the blue nodes are connection buses (load buses but not connected to distribution transformers); the total active power load is 3802 kW while the total reactive power load is 2694 kVAR [39]. The total APL is 224.96 kW, the total RPL is 102.14 kVAR, the VDI is 0.0266, and the VSI is 0.9017. These values represent the power flow results of the IEEE 69 BUS at the base case. To demonstrate the effectiveness of the proposed optimization algorithms carried out in two cases as a single OF and compared with previous papers, the third case is applied on multi OFs using proposed optimization algorithms.
One-line diagram of IEEE 69 BUSES.
To detect the optimal location and capacity of PVDGs with APL as a single OF, the simulation results of optimization algorithms (MGO and EGO) provided in Table 1. observed that the APL is minimized from 224.96 kW to (71.19 and 71.00) kW for optimization techniques (MGO and EGO), respectively. The EGO has the best result compared with MGO, and also from the convergence behavior shown in Figure 5, it is observed that EGO converges to the best solution (minimum APL) compared with MGO. While Figure 6 shows the boxplot for the proposed techniques, the superiority of the EGO technique is demonstrated over the MGO technique.
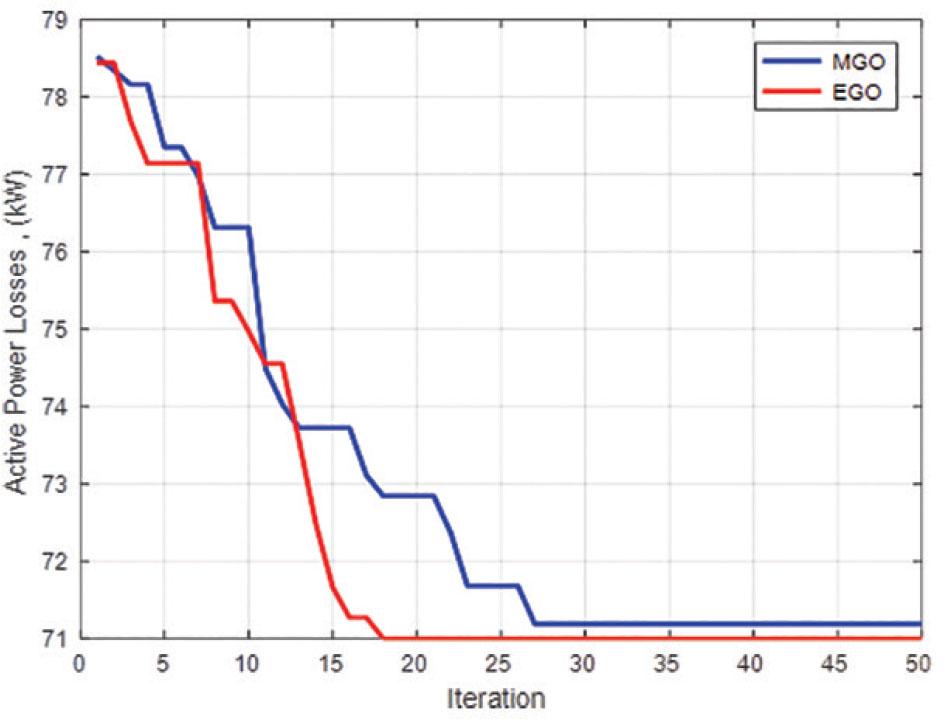
The convergence curve of APL (IEEE 69 BUS). APL, active power loss; EGO, Eel and grouper optimizer; MGO, mountain gazelle optimizer.
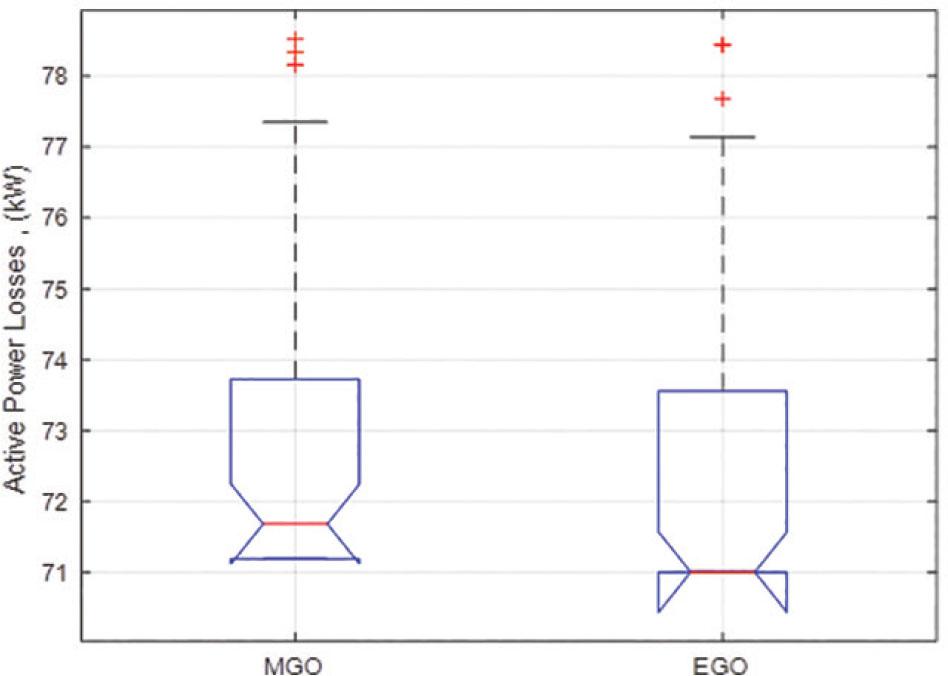
The boxplot of APL (IEEE 69 BUS). APL, active power loss; EGO, Eel and grouper optimizer; MGO, mountain gazelle optimizer.
Results of PVDG with minimized APL (IEEE 69 BUS)
| MGO | EGO | |
|---|---|---|
| DG location | 16, 61, 64 | 9, 18, 61 |
| DG size (kW) | 549.6, 1,482.7, 278.3 | 841.6, 449.3, 1,498.4 |
| APL (kW) | 71.19 | 71.00 |
APL, active power loss; DG, distributed generation; EGO, Eel and grouper optimizer; MGO, mountain gazelle optimizer.
On the other hand, the overall performances of RDN are enhanced when minimized by APL, where it is observed that the voltage profile is improved as shown in Figure 7, and all the buses’ voltages have become more the minimum voltage limit (0.95 V) after incorporating PVDG. In addition, to demonstrate the effectiveness of the proposed algorithms, the results are compared with the results of previous papers, as given in Table 2.
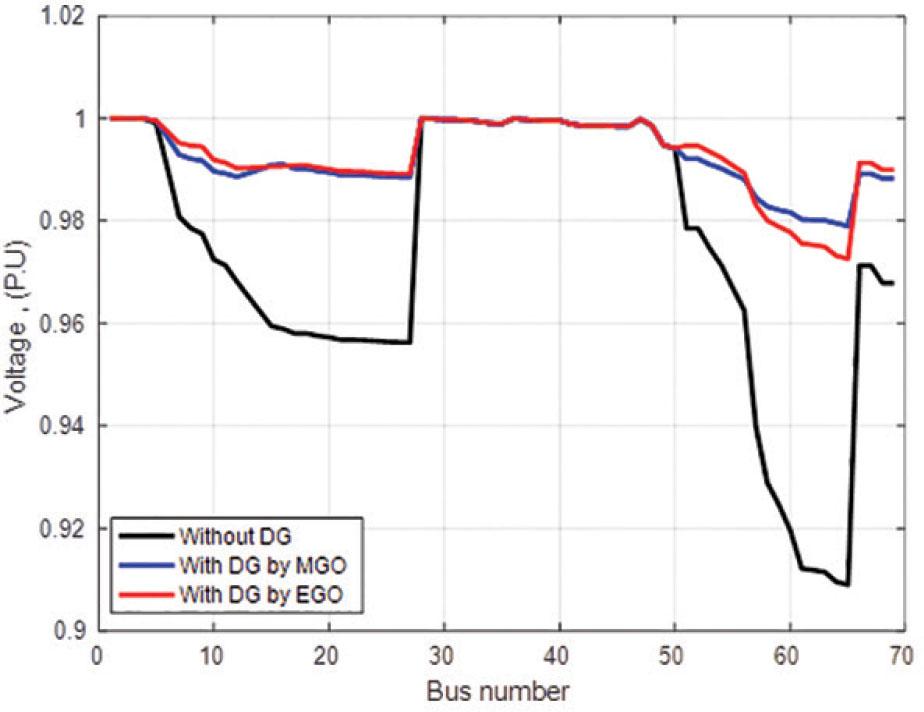
The voltage profile of case1 (IEEE 69 BUS). DG, distributed generation; EGO, Eel and grouper optimizer; MGO, mountain gazelle optimizer.
Comparison results of PVDG with minimized APL (IEEE 69 BUS)
| Method | DG location | DG size (kW) | APL (kW) |
|---|---|---|---|
| TLBO [16] | 15, 61, 63 | 591.9, 818.8, 900.3 | 72.4 |
| QTLBO [16] | 18, 61, 63 | 533.4, 1,198.6, 567.2 | 71.6 |
| JAYA [17] | 12, 50, 61 | 1,016, 100, 2,000 | 75.83 |
| MTLBO [17] | 20, 57, 62 | 446, 477, 1,836 | 77.36 |
| GWO [17] | 12, 50, 61 | 792, 586, 2,000 | 73.43 |
| SIMBO-Q [18] | 17, 61, 67 | 428.5, 1,500, 486.3 | 71.4 |
| QOSIMBO-Q [18] | 9, 17, 61 | 831.4, 453.8, 1,500 | 71.0 |
| FWA [19] | 27, 61, 65 | 225.8, 1,198.6, 408.5 | 77.85 |
| HSA [20] | 63, 64, 65 | 1,302.4, 369, 101.8 | 86.77 |
| BFOA [21] | 27, 61, 65 | 295.4, 1,345.1, 447.6 | 75.23 |
| HHO [22] | 12, 61, 62 | 734.1, 1,191.2, 762.3 | 74.14 |
| HGSO [23] | 15, 57, 61 | 598.63, 200, 1,796.9 | 72.33 |
| AMWOA [24] | 11, 18, 64 | 602, 589, 145 | 71.41 |
| MPSO [25] | 17, 61, 64 | 531, 1,490, 290 | 71.1 |
| Propose MGO | 16, 61, 64 | 549.6, 1,482.7, 278.3 | 71.19 |
| Propose EGO | 9, 18, 61 | 841.6, 449.3, 1,498.4 | 71.0 |
APL, active power loss; DG, distributed generation; EGO, Eel and grouper optimizer; MGO, mountain gazelle optimizer.
The simulation results of optimization algorithms (MGO and EGO) to find the optimal placement and size of PVDG with VSI as a single OF are given in Table 3; while the value of VSI is 0.9017 at base case, this value is maximized by using optimization techniques (MGO and EGO) to (0.9921 and 0.9947) respectively, and the value of VSI for EGO is better than the value of VSI for MGO. Figure 8 shows the convergence characteristics of optimization algorithms and is observed that EGO is close to best solution (maximum VSI) compared with MGO. While Figure 9 illustrates the boxplot for the proposed techniques, in which the superiority of EGO technique is demonstrated over MGO technique.

The convergence curve of VSI (IEEE 69 BUS). EGO, Eel and grouper optimizer; MGO, mountain gazelle optimizer; VSI, voltage stability index.

The boxplot of VSI (IEEE 69 BUS). VSI, voltage stability index.
Results of PVDG with maximized VSI (IEEE 69 BUS)
| MGO | EGO | |
|---|---|---|
| DG location | 26, 60, 64 | 23, 59, 61 |
| DG size (kW) | 1,032.8, 1,046.7, 1,083.4 | 1,306.3, 1,133.8, 1,084.5 |
| VSI (P.U) | 0.9921 | 0.9947 |
| 1/VSI (P.U) | 1.0079 | 1.0053 |
DG, distributed generation; EGO, Eel and grouper optimizer; MGO, mountain gazelle optimizer; VSI, voltage stability index.
On the other hand, the overall performances of RDN are enhanced when maximized with VSI. It is observed that the voltage profile is enhanced as shown in Figure 10, and all the buses’ voltages have become more than the minimum voltage limit (0.95 V) after inserting of PVDG. In addition, to demonstrate the effectiveness of the proposed algorithms, the results are compared with the results of previous papers, as given in Table 4.

The voltage profile of case2 (IEEE 69 BUS). DG, distributed generation; EGO, Eel and grouper optimizer; MGO, mountain gazelle optimizer.
Comparison results of PVDG with maximized VSI (IEEE 69 BUS)
| Method | DG location | DG size (kW) | VSI (P.U) | 1/VSI (P.U) |
|---|---|---|---|---|
| TLBO [16] | 27, 60, 61 | 702.6, 1171.6, 1163 | 0.9762 | 1.0244 |
| QTLBO [16] | 22, 61, 62 | 1193.1, 1196.7, 1191.4 | 0.9770 | 1.0235 |
| SIMBO-Q [18] | 21, 63, 64 | 1384.1, 1500, 1055.5 | 0.9770 | 1.0235 |
| QOSIMBO-Q [18] | 12, 56, 63 | 1500, 1500, 1500 | 0.9771 | 1.0234 |
| Propose MGO | 26, 60, 64 | 1032.8, 1046.7, 1083.4 | 0.9921 | 1.0079 |
| Propose EGO | 23, 59, 61 | 1306.3, 1133.8, 1084.5 | 0.9947 | 1.0053 |
DG, distributed generation; EGO, Eel and grouper optimizer; MGO, mountain gazelle optimizer; VSI, voltage stability index.
In this case, MOF, such as APLI, RPLI, VDI, the inverse of VSI, and investment Cost of PVDG (ICDG) are considered to obtain the optimal allocation (placement and capacity) of PVDG for RDN. Table 5 shows the result of these MOF on standard of IEEE 69 BUS based on both optimization techniques of MGO and EGO. It is clear that the overall performance of IEEE 69 BUS has been improved after integrating PVDG in the network. Both optimization algorithms (MGO and EGO) have shown their effectiveness and superiority compared to base case results. As well as the value of MOF using EGO leads to faster and smoother convergence compared with MGO as shown in Figure 11, also Figure 12 exhibits the boxplot of the optimization techniques, and EGO technique is in dominance over MGO technique.

The convergence curve of MOF (IEEE 69 BUS). EGO, Eel and grouper optimizer; MGO, mountain gazelle optimizer.

The boxplot of MOF (IEEE 69 BUS). EGO, Eel and grouper optimizer; MGO, mountain gazelle optimizer.
Results of PVDG with MOF (IEEE 69 BUS)
| MGO | EGO | |
|---|---|---|
| DG location | 24, 51, 62 | 17, 30, 61 |
| DG size (kW) | 455.1, 990.7, 1,608.6 | 580.5, 854.1, 1,742.3 |
| APL (kW) | 72.91 | 71.75 |
| RPL (kVAR) | 36.46 | 35.95 |
| VDI (P.U) | 0.0058 | 0.0071 |
| VSI (P.U) | 0.9770 | 0.9722 |
| APLI (P.U) | 0.2447 | 0.2418 |
| RPLI (P.U) | 0.2630 | 0.2603 |
| ICDG ($) | 0.1227 | 0.1207 |
| MOF | 0.3319 | 0.3316 |
APL, active power loss; APLI, active power loss index; DG, distributed generation; EGO, Eel and grouper optimizer; MGO, mountain gazelle optimizer; RPL, reactive power loss; RPLI, reactive power loss index; VDI, voltage deviation index; VSI, voltage stability index.
Moreover, to clarify the effectiveness of the proposed optimization techniques to determine the optimal allocation of PVDG on the performance of IEEE 69 BUS, the extent of enhancement in voltage profile is shown in Figure 13, while Figure 14 shows the extent of reduction in RPL.

The voltage profile of case3 (IEEE 69 BUS). DG, distributed generation; EGO, Eel and grouper optimizer; MGO, mountain gazelle optimizer.
RPL of case3 (IEEE 69 BUS). DG, distributed generation; EGO, Eel and grouper optimizer; MGO, mountain gazelle optimizer; RPL, reactive power loss.
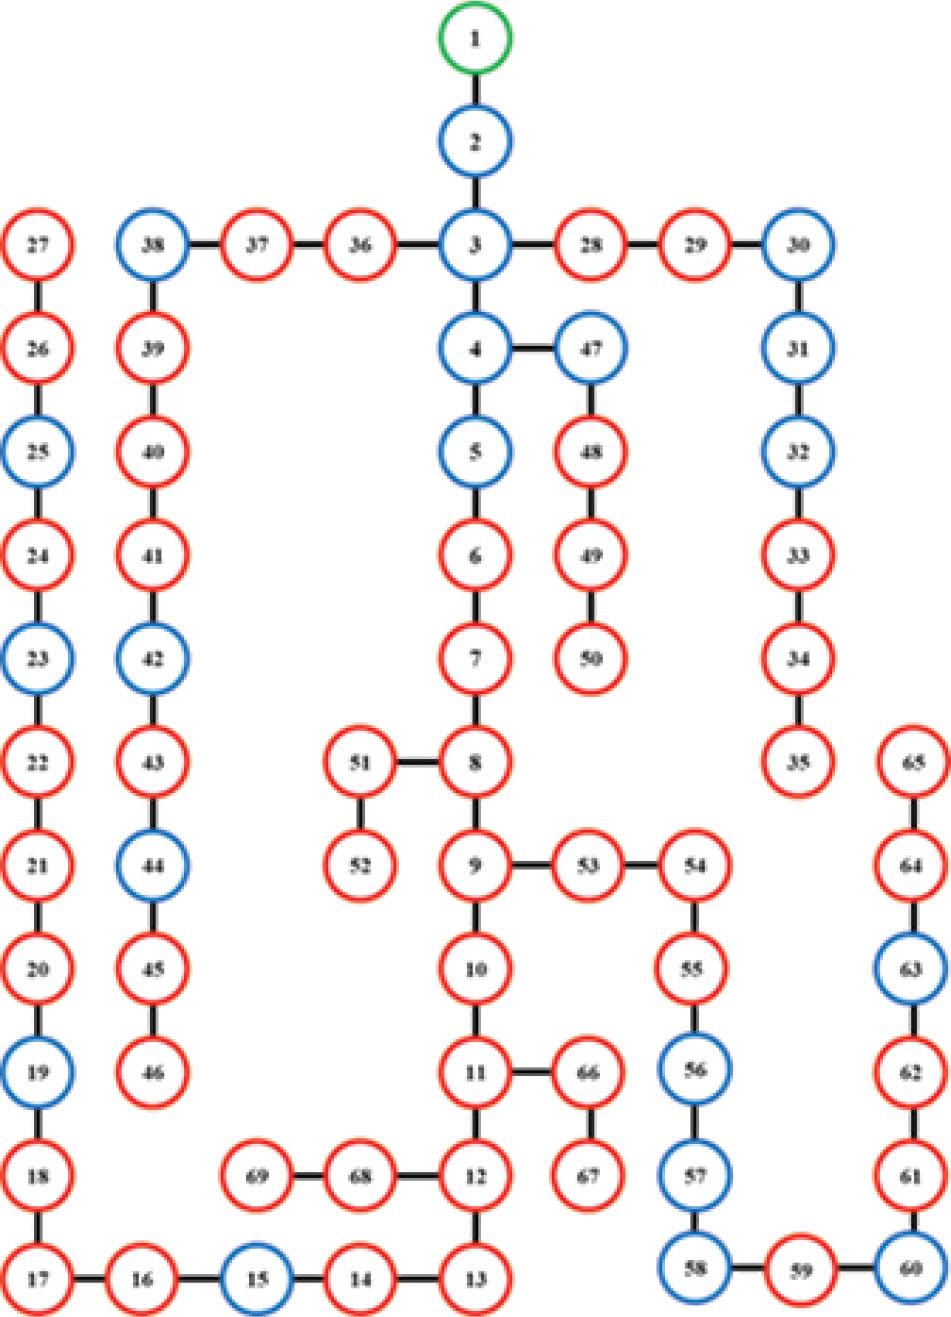
BAQ-CENTER-ALTABO-SARYA 77 BUS consists of 76 lines, the base voltage is 11 kV, the base MVA is 100 MVA. The one-line diagram is shown in Figure 15, node 1 (green node) is the slack bus, the red nodes are load buses, and the blue nodes are connection buses (load buses but not connected to distribution transformers); the total active power load is 21,426 kW while the total reactive power load is 13,259 kVAR. The total APL is 711.77 kW, the total RPL is 495.51 kVAR, the VDI is 0.0317, and the VSI is 0.8802. These values represent the power flow results of BAQ-CENTER-ALTABO-SARYA 77 BUS at base case. To prove the efficiency and effectiveness of the proposed techniques (MGO and EGO), the practical network of Iraqi 77 bus has been tested to obtain the optimal location and capacity of PVDG based on MOF and the results are given in Table 6. The system performance is clearly improved after adding PVDG.
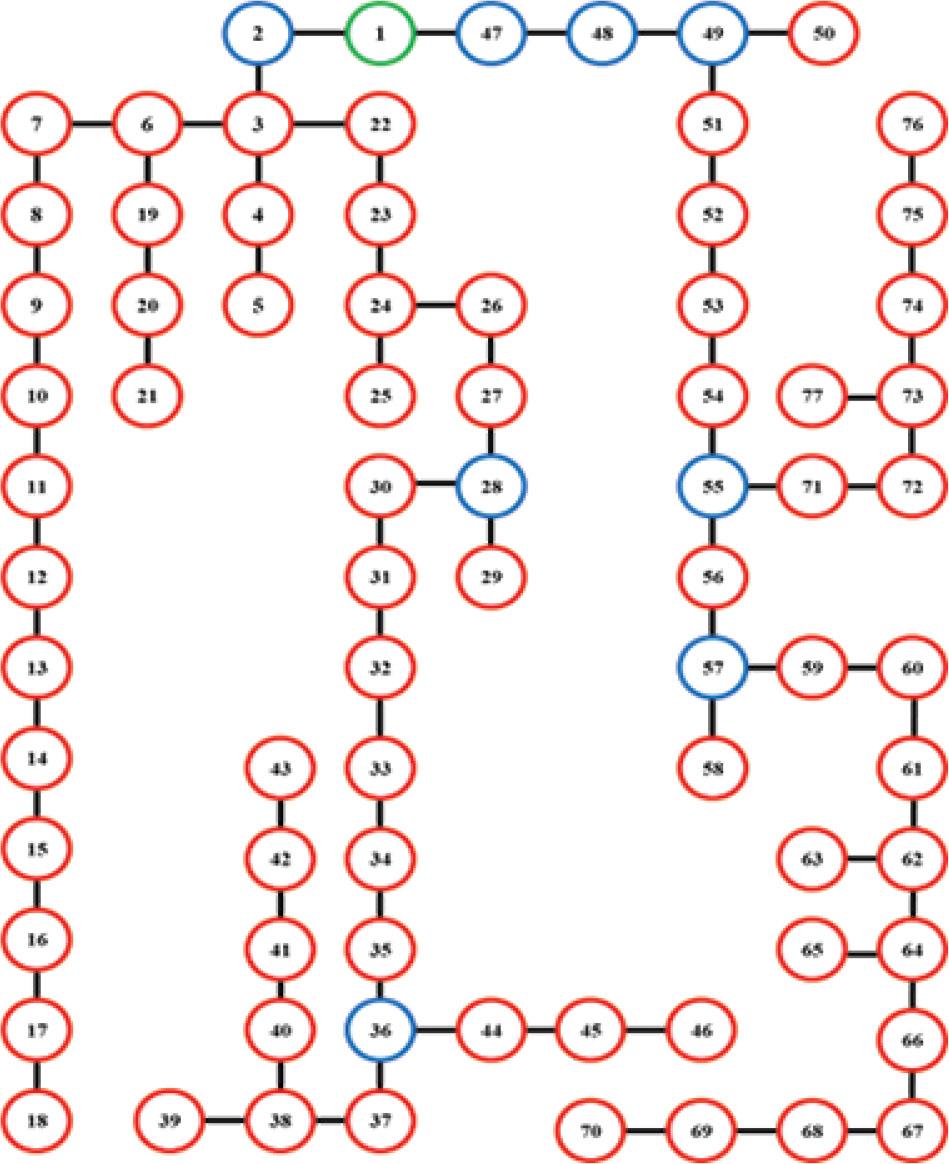
One-line diagram of IRAQI 77 BUSES.
Results of PVDG with MOF (IRAQI 77 BUS)
| MGO | EGO | |
|---|---|---|
| DG location | 18, 41, 63 | 11, 40, 66 |
| DG size (kW) | 2,595.4, 2,796.3, 2,407.3 | 2,697.5, 2,860.7, 2,346.5 |
| APL (kW) | 367.75 | 361.41 |
| RPL (kVAR) | 257.75 | 253.45 |
| VDI (P.U) | 0.0214 | 0.0215 |
| VSI (P.U) | 0.9174 | 0.9172 |
| APLI (P.U) | 0.3406 | 0.3367 |
| RPLI (P.U) | 0.3421 | 0.3384 |
| ICDG ($) | 0.3135 | 0.3177 |
| MOF | 0.4215 | 0.4209 |
APL, active power loss; APLI, active power loss index; DG, distributed generation; EGO, Eel and grouper optimizer; MGO, mountain gazelle optimizer; RPL, reactive power loss; RPLI, reactive power loss index; VDI, voltage deviation index; VSI, voltage stability index.
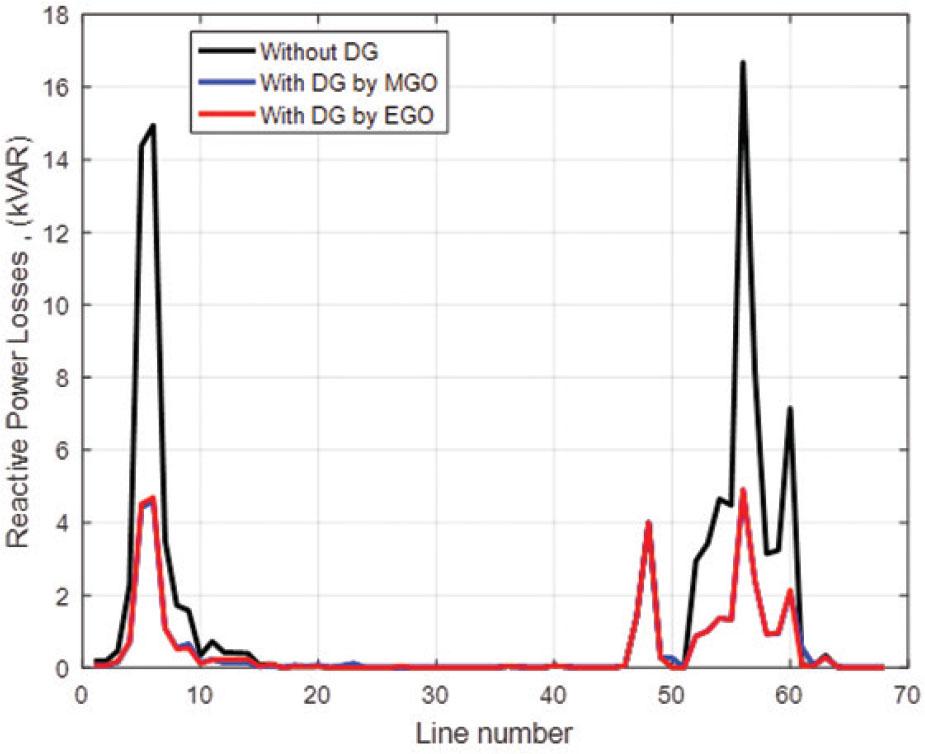
Furthermore, when comparing the proposed algorithms, it is noted that EGO technique is superior to MGO technique, and it is noted that EGO technique converges to the optimal solution faster and with fewer iterations as shown in Figure 16, and the same in Figure 17 the boxplot shows precedence and dominance of EGO over MGO. Therefore, the behavior and performance of Iraqi 77 bus will improve after injecting PVDG, while the increasing level of voltage profile and VSI are introduced in Figure 18 and Figure 19 respectively; meanwhile, the reductions of APL and RPL are presented in Figure 20 and Figure 21, respectively.

The convergence curve of MOF (IRAQI 77 BUS). EGO, Eel and grouper optimizer; MGO, mountain gazelle optimizer.

The boxplot of MOF (IRAQI 77 BUS). EGO, Eel and grouper optimizer; MGO, mountain gazelle optimizer.
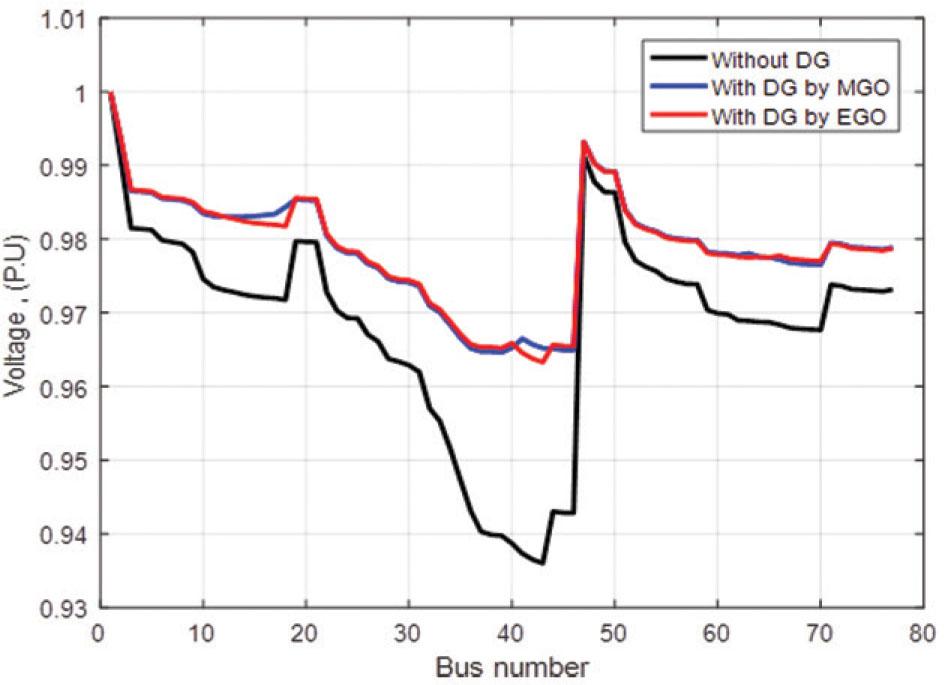
The voltage profile of MOF (IRAQI 77 BUS). DG, distributed generation; EGO, Eel and grouper optimizer; MGO, mountain gazelle optimizer.
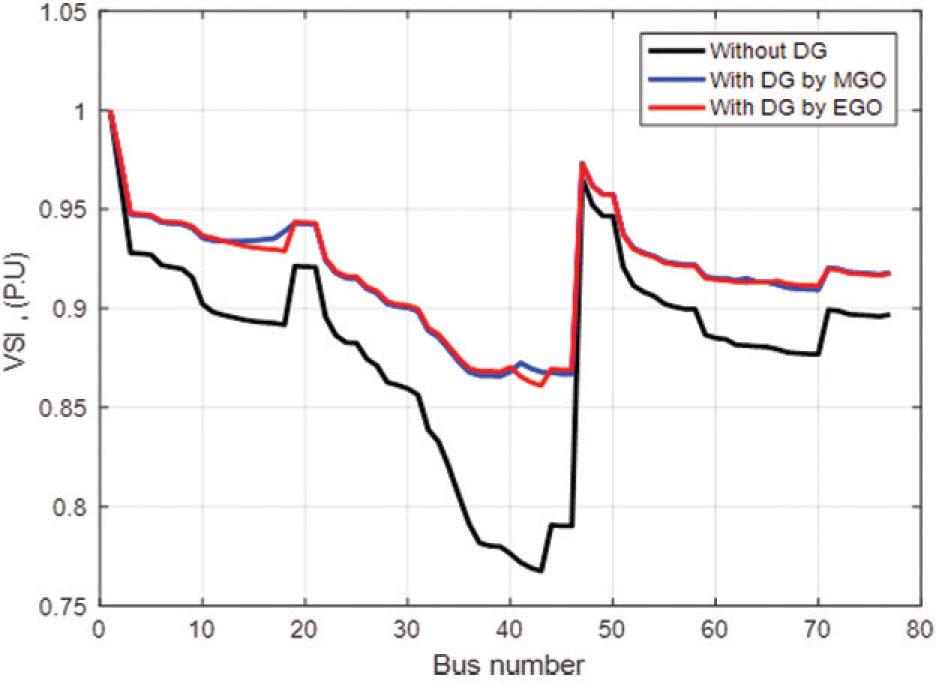
VSI of MOF (IRAQI 77 BUS). DG, distributed generation; EGO, Eel and grouper optimizer; MGO, mountain gazelle optimizer; VSI, voltage stability index.

APL of MOF (IRAQI 77 BUS). APL, active power loss; DG, distributed generation; EGO, Eel and grouper optimizer; MGO, mountain gazelle optimizer.

RPL of MOF (IRAQI 77 BUS). DG, distributed generation; EGO, Eel and grouper optimizer; MGO, mountain gazelle optimizer; RPL, reactive power loss.
Referring to the problems related to voltage deviation, voltage stability, power losses, and optimization allocation (siting and capacity) of Photovoltaic Distributed Generation (PVDG) in distribution system, this article proposes a modern approach of optimization techniques to solve these problems. The proposed optimization techniques are MGO and EGO. To demonstrate the effectiveness of these proposed optimization techniques and verify the accuracy of their results, a standard test system of IEEE 69 bus and a practical system of Iraqi 77 bus have been tested. The results showed the superiority of the proposed techniques compared to the techniques presented in previous literature. Furthermore, this article presented five OFs: APLI, RPLI, VDI, VSI, as the technical OFs, while the fifth OF is the Investment Cost of PVDG units (ICDG) as the economical OF. The simulation results showed a significant improvement in the performance of both standard RDN and practical RDN after integrated PVDG in the networks. On the other hand, the comparison between the proposed algorithms led to determining the precedence and dominance of EGO technique over the MGO technique to reach the best solution in single and multi OF. This article can be highlighted in the future work by analyzing and studying the impact of PVDG on the resilience of RDN in the event of earthquakes, typhoons, or strong winds. Moreover, in the future, work can be utilized by the proposed algorithms to detect the optimal locations and sizes of FACTS devices such as Static VAR Compensator (SVC) and Thyristor Controlled Series Compensator (TCSC).