
Table 1:
The EKF parameter details.
| Parameter | Information |
|---|---|
| The estimated state | |
| f | Non-linear model system |
| h | Measurement model system |
| vk | Measurement noise |
| zk | IMU measurement |
| Wk − 1 | Dynamic system noise |
| The estimated updates state | |
| V | The linear velocity of the robot |
| Δt | Time derivative |
| θ | The steering angle of the robot |
| Qk | Dynamic system noise matrix |
| Hk | IMU measurement matrix |
| Rk | Measurement noise matrix |
| Fk | Jacobians matrix, |
[i] EKF, extended Kalman Filter; IMU, inertial measurement unit.
Table 2:
The steps of the EKF-SLAM Algorithm.
| EKF-SLAM Algorithm |
|---|
|
[i] EKF, extended Kalman filter; KF, Kalman filter; SLAM, simultaneous localization and mapping.
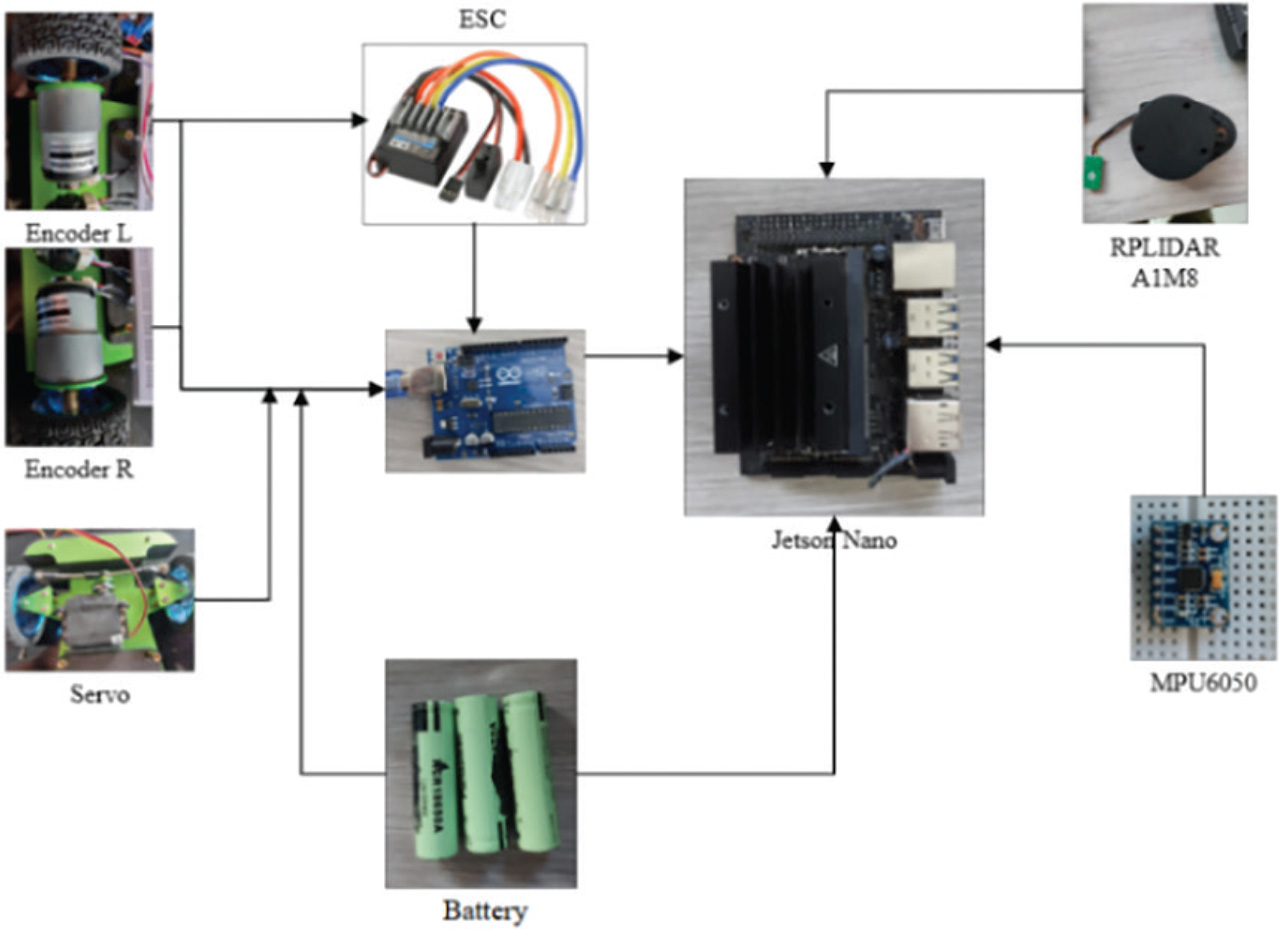
Figure 1:
The hardware wiring and schematics.
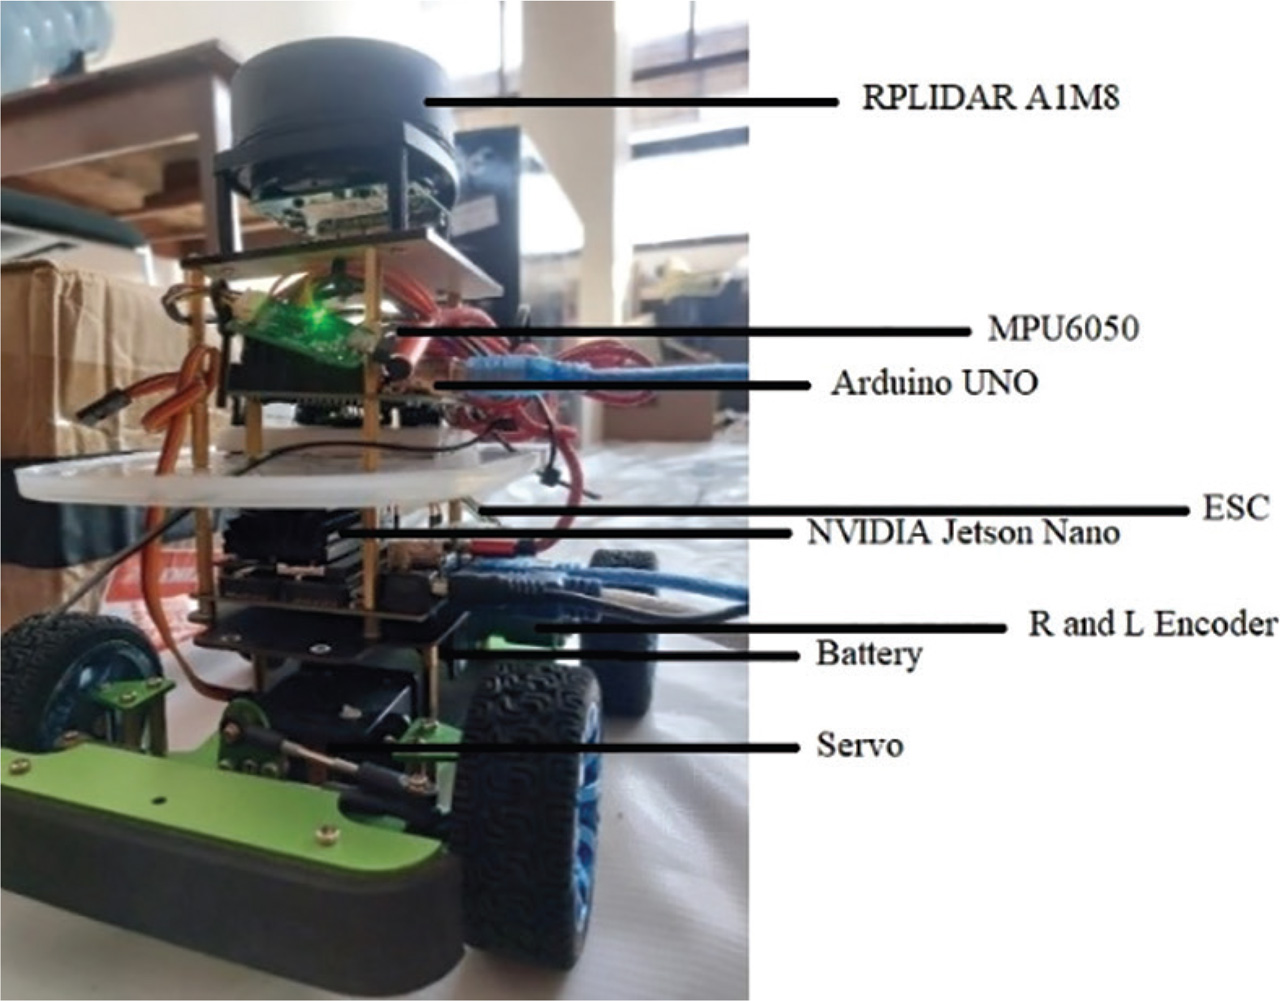
Figure 2:
The physical look of a robot.
Table 3:
The details of robot parameters.
| Parameter | Value |
|---|---|
| Battery | 12.6 V (DC) |
| Dimension | 242.9 × 192.2 mm |
| Steering servo | 9 kg/cm torque |
| Wheel motor | 240 RPM |
| Wireless | 2.4G/5G dual-band WIFI, Bluetooth 4.2 |
| Driving type | Ackerman steering dual gearmotor rear wheel drive |
[i] RPM, revolutions per minute.
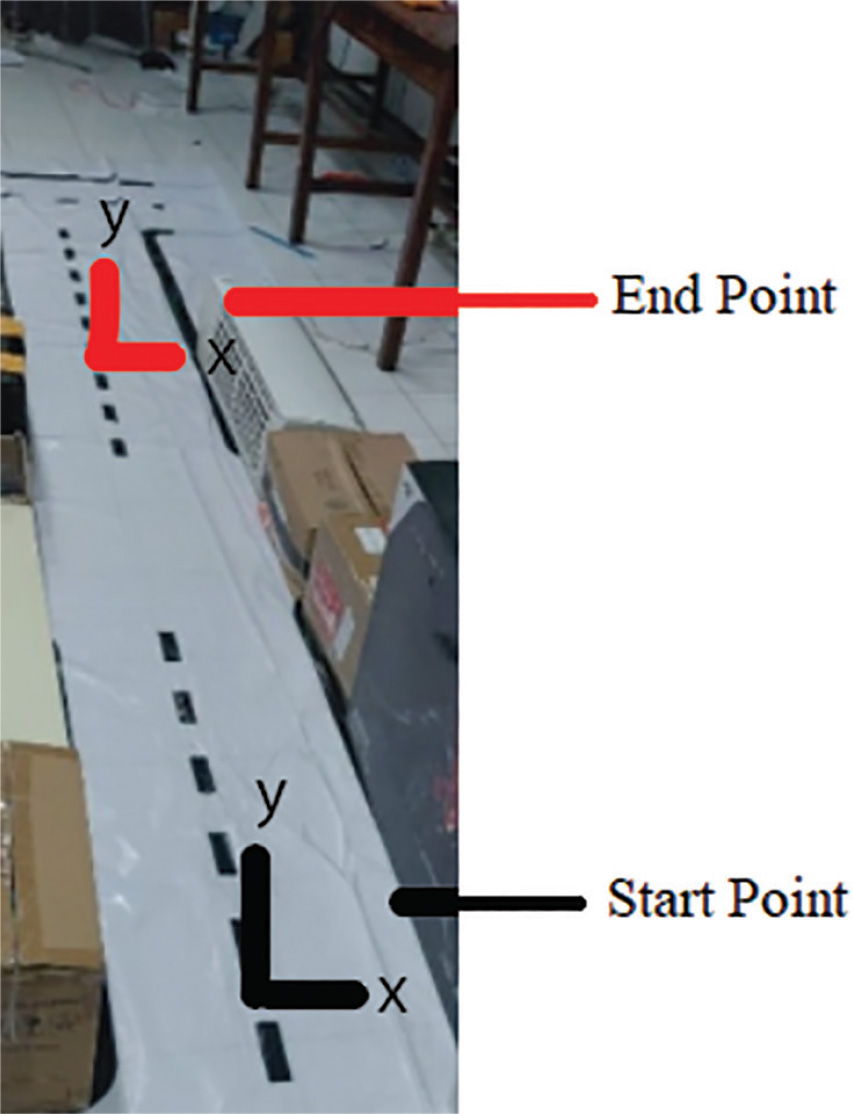
Figure 3:
The scenario of physical world and measurement.
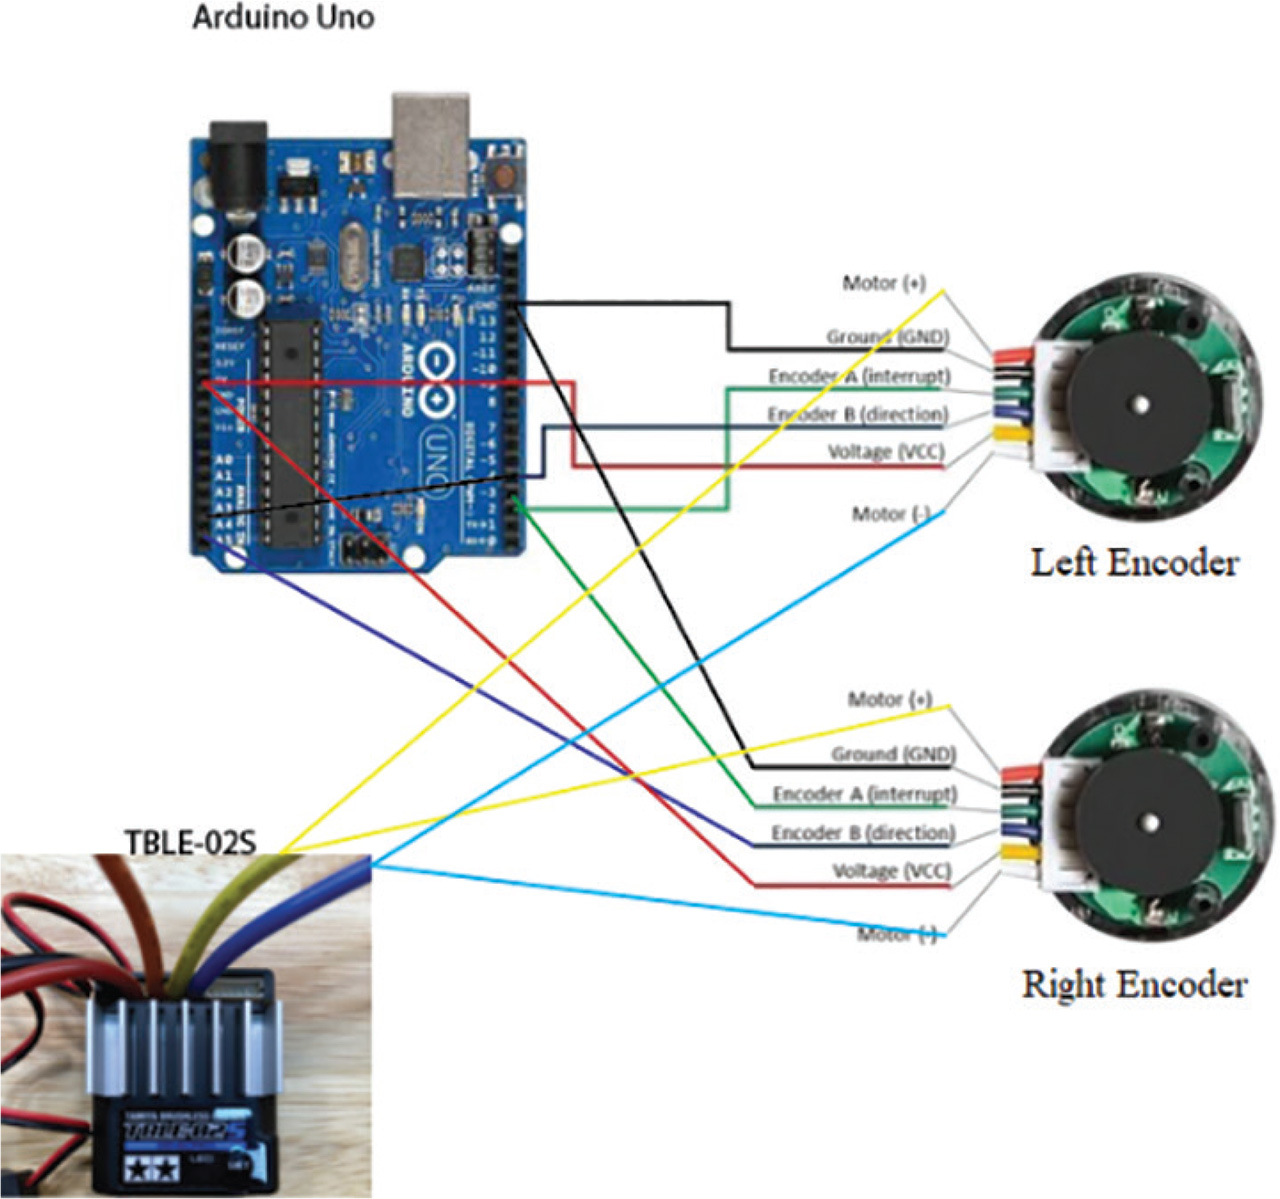
Figure 4:
Encoders' schematic diagram.
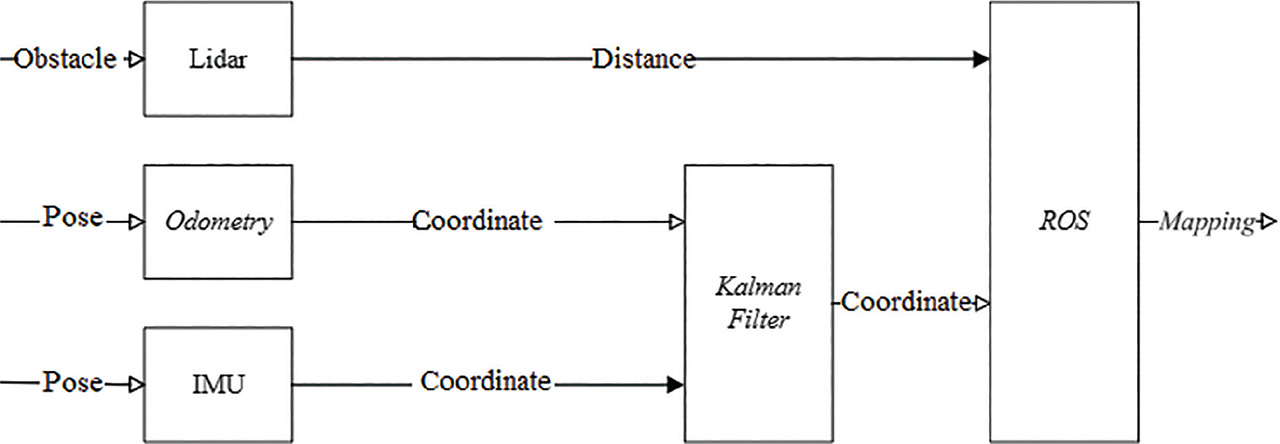
Figure 5:
The Localization and perception block diagram. ROS, robot operating system.
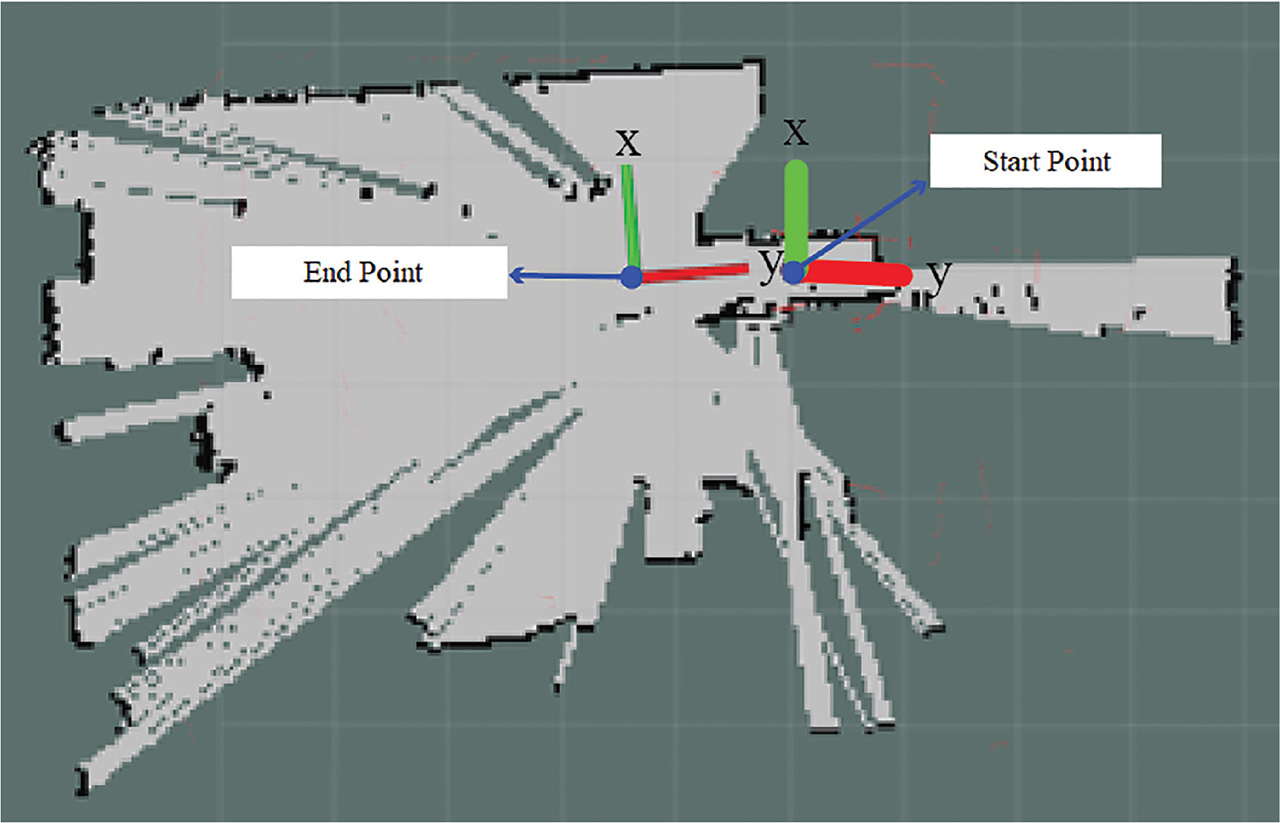
Figure 6:
The map generated using the Hector-SLAM algorithm. SLAM, Simultaneous localization and mapping.
Table 4:
The maximum and minimum distance values of the LiDAR data.
| Maximum (m) | Minimum (m) | |
|---|---|---|
| Measured data | 6.808 | 0.15 |
| Actual value (reference) | 6.54 | 0.09 |
| Error (%) | 4 | 67 |
[i] LiDAR, light detection and ranging.
Table 5:
Gyroscope orientation measurements.
| X orientation | Y orientation | X reference | Y reference | X error | Y error |
|---|---|---|---|---|---|
| −0.01 | −0.01 | 0 | 0 | −0.01 | −0.01 |
| −0.01 | −0.01 | 0 | 0 | −0.01 | −0.01 |
| −0.01 | 0.02 | 0 | 0 | −0.01 | 0.02 |
| −0.01 | 0.03 | 0 | 0 | −0.01 | 0.03 |
| −0.01 | 0.03 | 0 | 0 | −0.01 | 0.03 |
| 0.00 | 0.03 | 0 | 0 | 0.00 | 0.03 |
| −0.01 | 0.03 | 0 | 0 | −0.01 | 0.03 |
| 0.00 | 0.00 | 0 | 0 | 0.00 | 0.00 |
| 0.00 | 0.00 | 0 | 0 | 0.00 | 0.00 |
| −0.01 | 0.03 | 0 | 0 | −0.01 | 0.03 |
| Errors in average (%) | 1 | 2 | |||
Table 6:
Accelerometer measurements.
| X | Y | X reference | Y reference | X error | Y error |
|---|---|---|---|---|---|
| 0.02 | −0.02 | 0 | 0 | 0.02 | −0.02 |
| 0.01 | −0.01 | 0 | 0 | 0.01 | −0.01 |
| −0.03 | −0.02 | 0 | 0 | −0.03 | −0.02 |
| −0.06 | −0.02 | 0 | 0 | −0.06 | −0.02 |
| −0.07 | −0.02 | 0 | 0 | −0.07 | −0.02 |
| −0.06 | 0.01 | 0 | 0 | −0.06 | 0.01 |
| −0.06 | −0.03 | 0 | 0 | −0.06 | −0.03 |
| 0.01 | 0.01 | 0 | 0 | 0.01 | 0.01 |
| −0.01 | 0.00 | 0 | 0 | −0.01 | 0.00 |
| −0.06 | −0.02 | 0 | 0 | −0.06 | −0.02 |
| Error in average (%) | 4 | 2 | |||
Table 7:
The comparison of the encoder results and the reference in X-axis.
| X position from odometry | X reference | Error |
|---|---|---|
| 0.95 | 0.97 | 0.02 |
| 0.95 | 0.97 | 0.03 |
| 0.95 | 0.97 | 0.03 |
| 0.95 | 0.97 | 0.03 |
| 0.95 | 0.98 | 0.03 |
| 0.95 | 0.98 | 0.04 |
| 0.95 | 0.98 | 0.04 |
| 0.95 | 0.99 | 0.04 |
| 0.95 | 0.99 | 0.04 |
| 0.95 | 1.00 | 0.05 |
| Error in average (%) | 3 | |
Table 8:
The comparison of the encoder results and the reference in Y-axis.
| Y position from odometry | Y reference | Error |
|---|---|---|
| 0.02 | 0.02 | 0.00 |
| 0.02 | 0.02 | 0.00 |
| 0.02 | 0.02 | 0.00 |
| 0.02 | 0.02 | 0.00 |
| 0.02 | 0.02 | 0.00 |
| 0.01 | 0.02 | 0.01 |
| 0.01 | 0.02 | 0.01 |
| 0.02 | 0.02 | 0.02 |
| 0.07 | 0.02 | 0.05 |
| 0.07 | 0.02 | 0.05 |
| Error in average (%) | 2 | |
Table 9:
Comparison between the EKF positions and the reference.
| X position (EKF) | X reference | Y position (EKF) | Y reference | Error X | Error Y |
|---|---|---|---|---|---|
| 0.97 | 0.97 | 0.02 | 0.02 | 0.00 | 0.00 |
| 0.98 | 0.97 | 0.02 | 0.02 | 0.01 | 0.00 |
| 0.98 | 0.97 | 0.02 | 0.02 | 0.01 | 0.01 |
| 0.98 | 0.97 | 0.02 | 0.02 | 0.01 | 0.01 |
| 0.99 | 0.98 | 0.02 | 0.02 | 0.01 | 0.02 |
| 0.99 | 0.98 | 0.02 | 0.02 | 0.01 | 0.04 |
| 1.00 | 0.98 | 0.02 | 0.02 | 0.02 | 0.04 |
| 1.01 | 0.99 | 0.02 | 0.02 | 0.02 | 0.04 |
| 1.01 | 0.99 | 0.02 | 0.02 | 0.02 | 0.04 |
| 1.02 | 1.00 | 0.02 | 0.02 | 0.02 | 0.05 |
| Error in average (%) | 1 | 3 | |||
| RMSE | 0.11 | 0.15 | |||
[i] EKF, extended Kalman filter; RMSE, root mean square error.
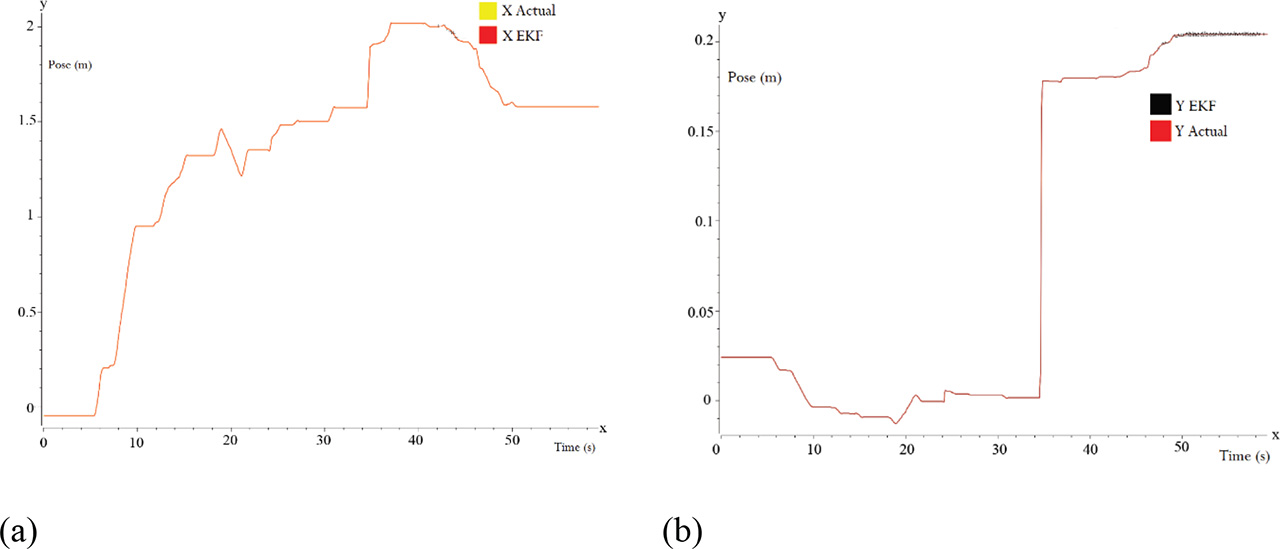
Figure 7:
Comparison of EKF position estimation results with references. During the experiment, we focus on two coordinates as the mobile robot moves—namely, the X and Y coordinates. Label A represents the robot's motion along the X coordinate, while label B corresponds to its movement along the Y coordinate. EKF, extended Kalman filter.
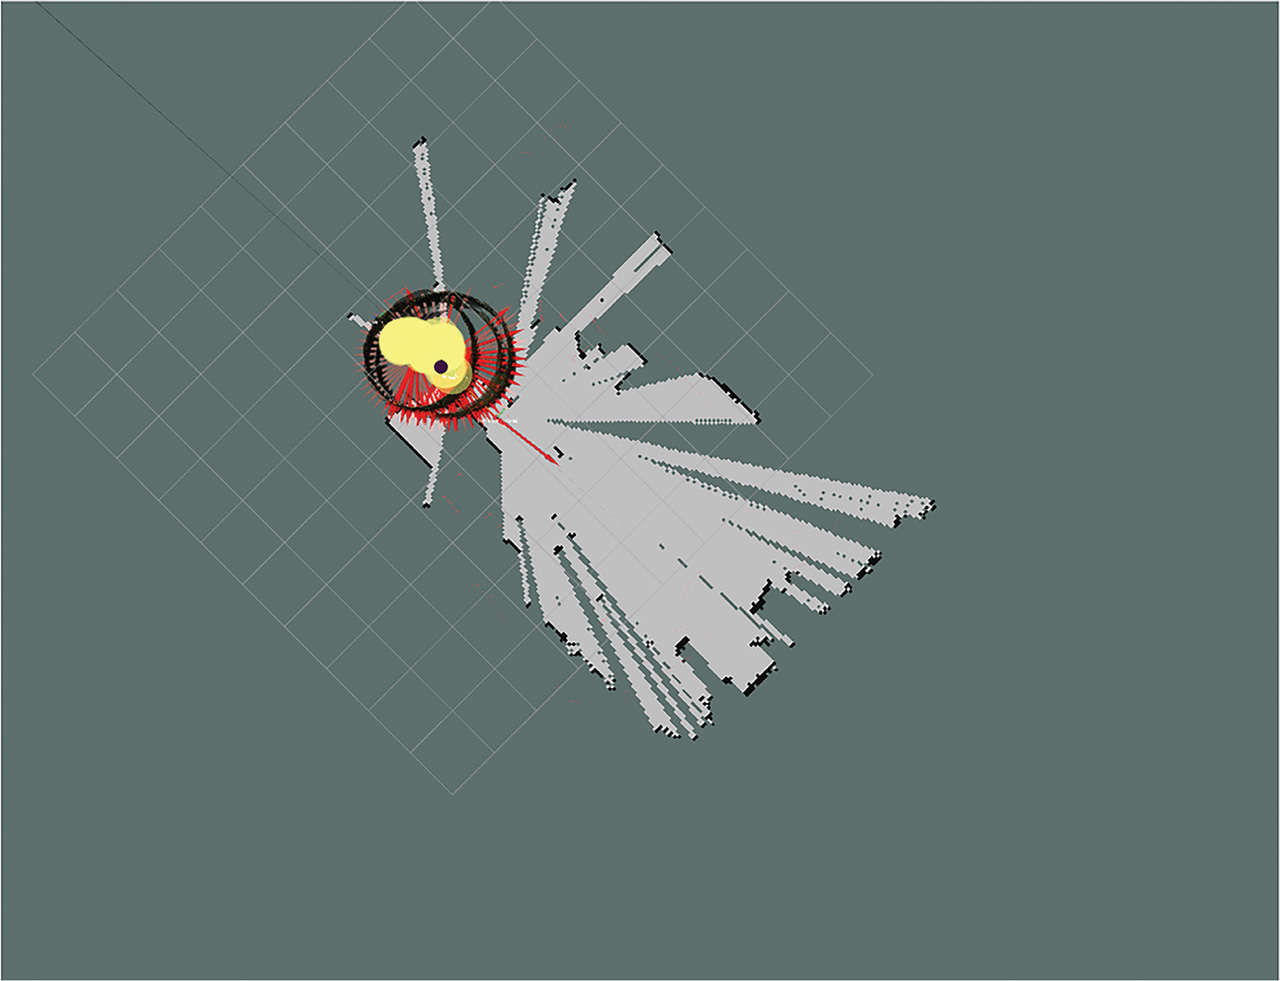
Figure 8:
RViz visualization.