
Figure 1
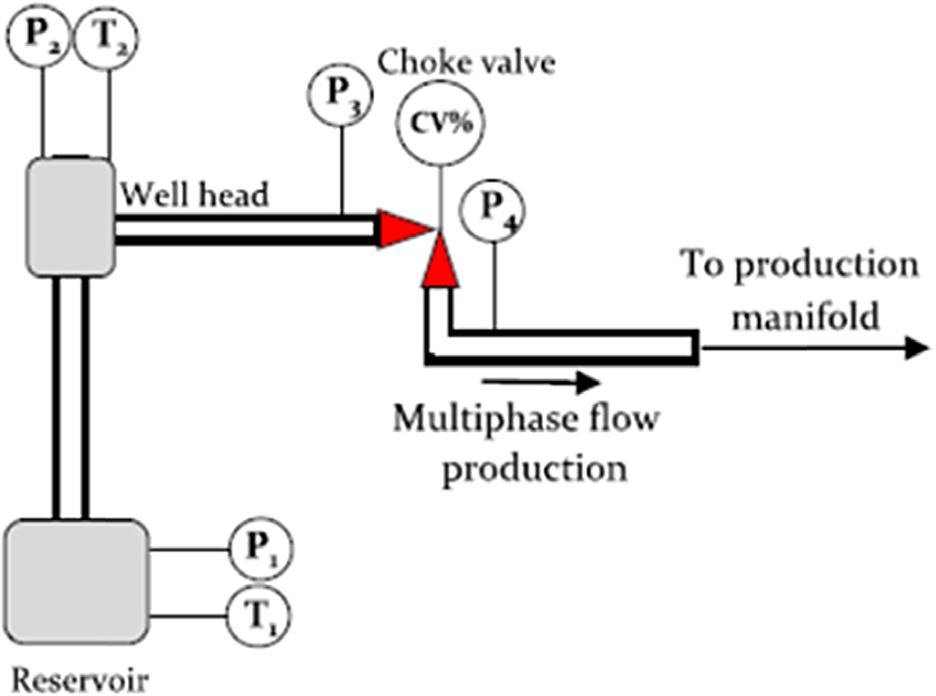
Figure 2
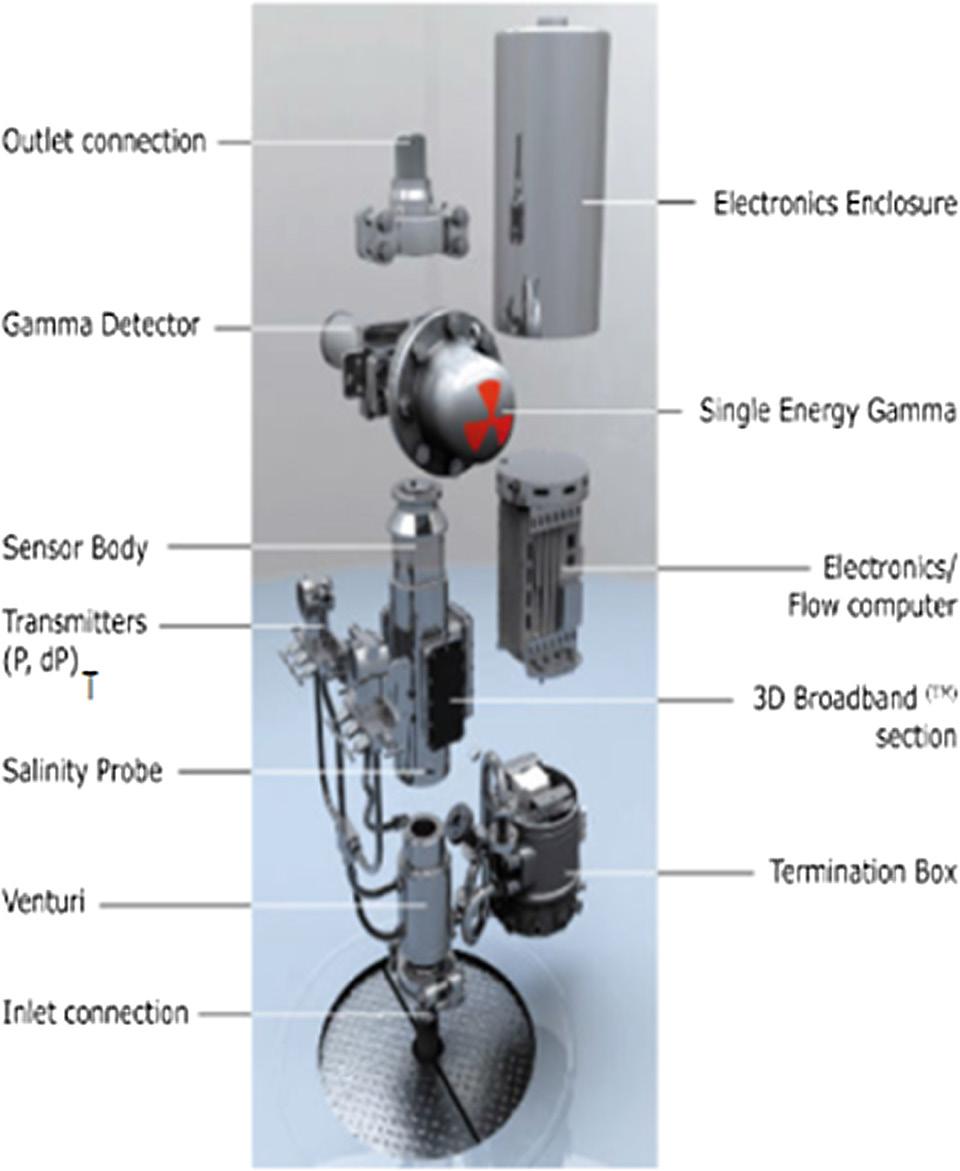
Figure 3
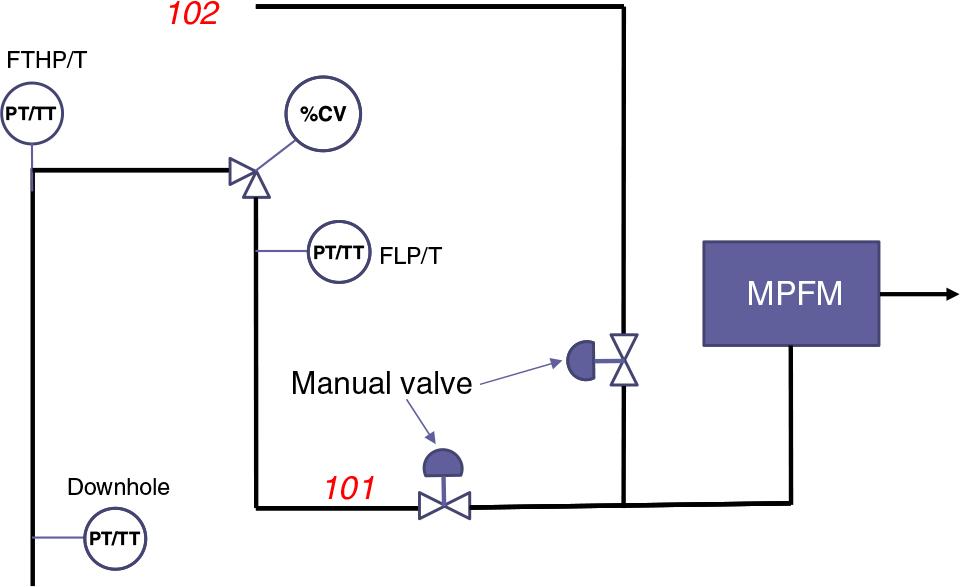
Figure 4
Figure 5
Figure 6
Figure 7
Figure 8
Figure 9
Figure 10
Figure 11
Figure 12
Figure 13
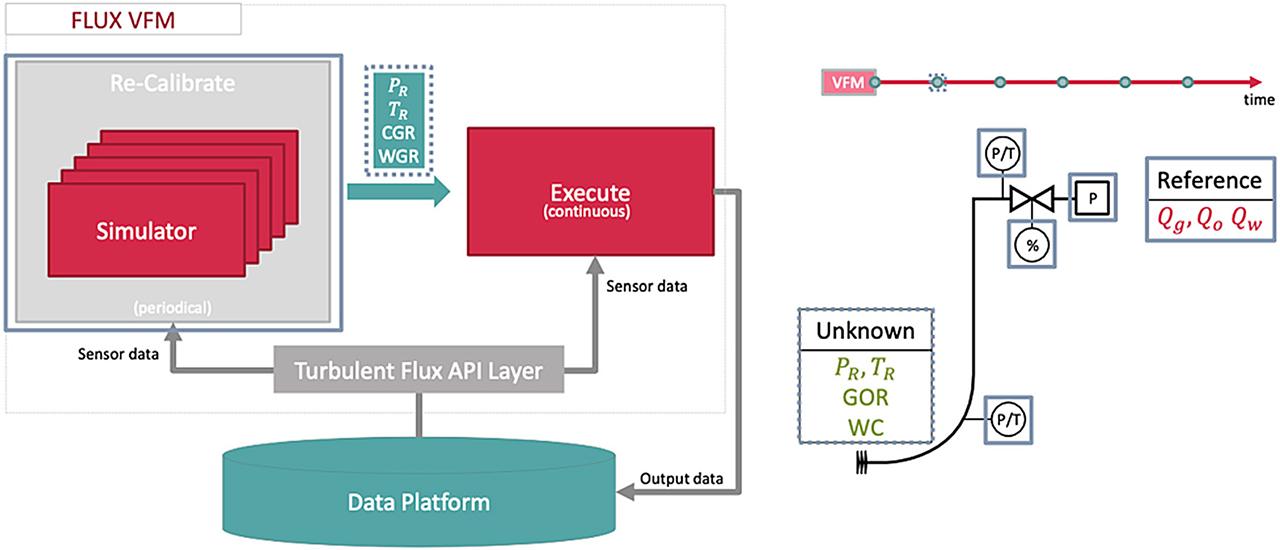
Figure 14
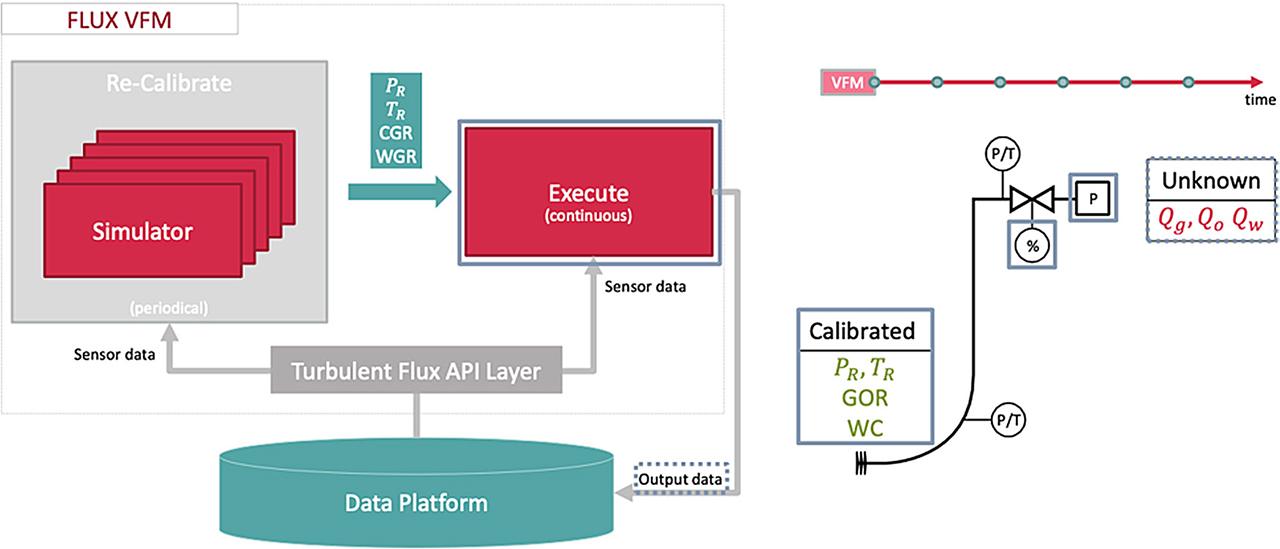
Figure 15
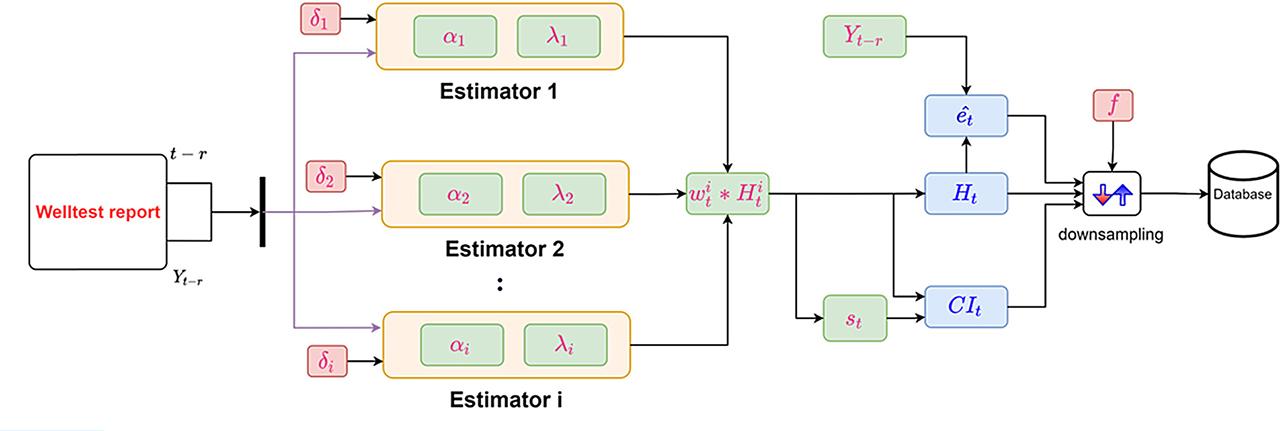
Figure 16
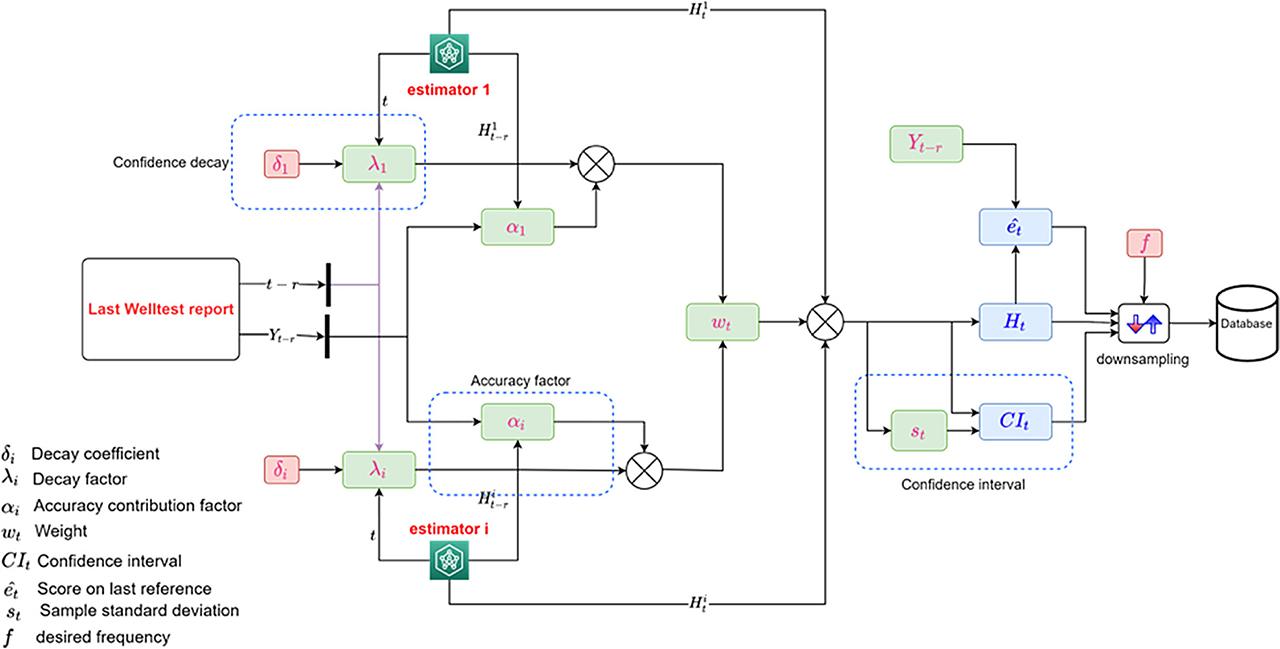
Figure 17
Figure 18
Figure 19
Figure 20
Figure 21
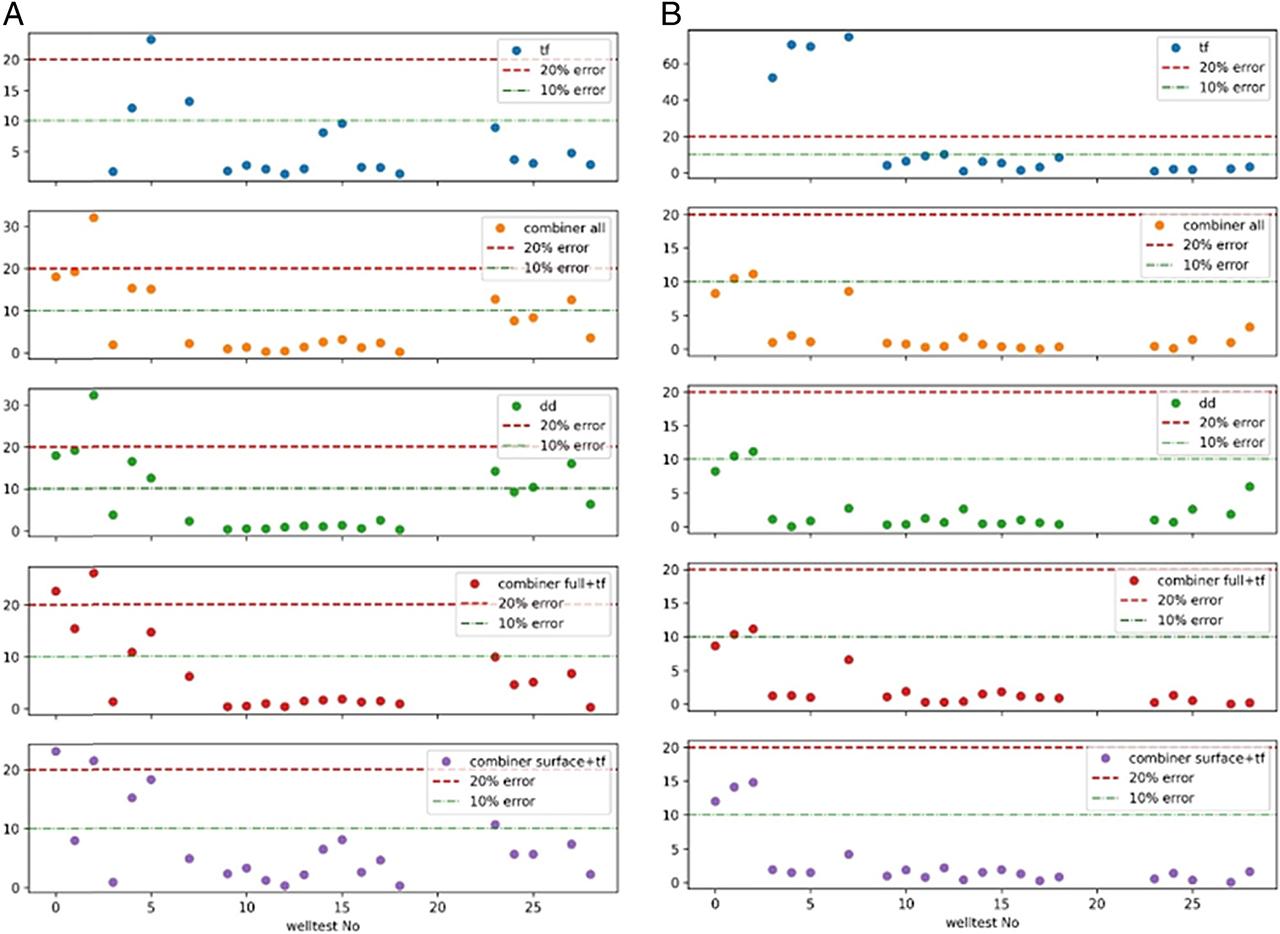
Figure 22
Figure 23
Figure 24
Pilot Experiment Parameters_
| Parameter | Detail |
|---|---|
| Producing Wells | Well 101 and Well 102 |
| Well-testing equipment | Shared MPFM |
| Flow type | Multiphase (3 phases) |
| Training data | 6 weeks multi-rate well-tests |
| Online test duration | 6 months |
| Measurements | Downhole P/T, Upstream P/T, downstream P/T, Choke opening |
| Data source | OSIsoft PI |
Flow rate deviation (delta Q) performance summary for data-driven VFM estimators_
| DD-VFM | |||||
|---|---|---|---|---|---|
| Well | Output | Full | Surface | Subsurface | Combiner |
| 101 | Qgas | 216 | 248 | 222 | 189 |
| Qoil | 242 | 263 | 377 | 248 | |
| Qwater | 0.5 | 0.3 | - | 0.2 | |
| 102 | Qgas | 68 | 135 | 106 | 90 |
| Qoil | 35 | 25 | 40 | 27 | |
| Qwater | 12 | 16 | 6 | 10 | |
Combiner group description_
| Type | Description |
|---|---|
| combiner-all | Combining the three DD-VFM estimator categories and TF-VFM |
| combiner-dd | Combining the three DD-VFM estimator categories only |
| combiner-full | Combining the full-type DD-VFM estimator and TF-VFM |
| combiner-surface | Combining the surface-type DD-VFM estimator and TF-VFM |
MAPE performance summary for data-driven VFM estimators_
| DD-VFM | |||||
|---|---|---|---|---|---|
| Well | Output | Full | Surface | Subsurface | Combiner-dd |
| 101 | Qgas | 16.6 | 19.2 | 16.9 | 13.9 |
| Qoil | 9.7 | 10.0 | 15.7 | 9.8 | |
| 102 | Qgas | 6.0 | 9.5 | 10.2 | 7.7 |
| Qoil | 3.1 | 2.3 | 3.8 | 2.5 | |
Format for well test report to be for both training and testing dataset_
| INPUT | OUTPUT | ||||||||||
|---|---|---|---|---|---|---|---|---|---|---|---|
| Date/Time | Well No | Flowing tubing head pressure (FTHP), psi | Flowing tubing head temperature (FTHT), °C | Differential pressure across the well (dPWell), psi | Differential temperature across the well (dTWell), °C | Choke opening (CV), % | Differential pressure across the choke (dPChoke) | Differential temperature across the choke (dTChoke) | Oil Flow Rate (bbl/day) | Gas Flow Rate (MMscf/day) | Water Flow Rate (bbl/day) |
| DD:MM:YYYY HH:MM:SS | 101 | – | – | – | – | – | – | – | – | – | – |
| DD:MM:YYYY HH:MM:SS | 102 | – | – | – | – | – | – | – | – | – | – |
| DD:MM:YYYY HH:MM:SS | 101 | – | – | – | – | – | – | – | – | – | – |
| DD:MM:YYYY HH:MM:SS | 102 | – | – | – | – | – | – | – | – | – | – |
Tested combiner VFM_
| Well | Output | Hybrid-VFM | Input Estimators |
|---|---|---|---|
| 101 | Qgas | combiner-all | [full, surface, subsurface, TF] |
| combiner-dd | [full, surface, subsurface] | ||
| combiner-full | [full, TF] | ||
| combiner-surface | [surface, TF] | ||
| Qoil | combiner-all | [full, surface, subsurface, TF] | |
| combiner-dd | [full, surface, subsurface] | ||
| combiner-full | [full, TF] | ||
| combiner-surface | [surface, TF] | ||
| Qwater | combiner-all | [full, surface, TF] | |
| combiner-dd | [full, surface] | ||
| combiner-full | [full, TF] | ||
| combiner-surface | [surface, TF] | ||
| 102 | Qgas | combiner-all | [full, surface, subsurface, TF] |
| combiner-dd | [full, surface, subsurface] | ||
| combiner-full | [full, TF] | ||
| combiner-surface | [surface, TF] | ||
| Qoil | combiner-all | [full, surface, subsurface, TF] | |
| combiner-dd | [full, surface, subsurface] | ||
| combiner-full | [full, TF] | ||
| combiner-surface | [surface, TF] | ||
| Qwater | combiner-all | [full, surface, subsurface, TF] | |
| combiner-dd | [full, surface, subsurface] | ||
| combiner-full | [full, TF] | ||
| combiner-surface | [surface, TF] |
Data-driven model category with the associated inputs and outputs for each well_
| Well | Model Category | Inputs | Output | Algorithm |
|---|---|---|---|---|
| 101 | full | CV, FTHP, FTHT, dPWell, dTWell, dPChoke, dTChoke | Qgas | AdaBoost |
| Qoil | RandomForest | |||
| Qwater | AdaBoost | |||
| surface | CV, FTHP, FTHT, dPChoke, dTChoke | Qgas | RandomForest | |
| Qoil | RandomForest | |||
| Qwater | AdaBoost | |||
| subsurface | FTHP, FTHT, dPWell, dTWell | Qgas | AdaBoost | |
| Qoil | RandomForest | |||
| 102 | full | CV, FTHP, FTHT, dPWell, dTWell, dPChoke, dTChoke | Qgas | Bagging |
| Qoil | RandomForest | |||
| Qwater | AdaBoost | |||
| surface | CV, FTHP, FTHT, dPChoke, dTChoke | Qgas | AdaBoost | |
| Qoil | RandomForest | |||
| Qwater | AdaBoost | |||
| subsurface | FTHP, FTHT, dPWell, dTWell | Qgas | RandomForest | |
| Qoil | AdaBoost | |||
| Qwater | Bagging |
Flow rate deviation (delta Q) performance for all VFM_
| Hybrid VFM (combiner) | ||||||
|---|---|---|---|---|---|---|
| Well | Output | DD-VFM | TF-VFM | All | Full+TF | Surface+TF |
| 101 | Qgas | 214 | 155 | 186 | 148 | 146 |
| Qoil | 278 | 221 | 220 | 126 | 146 | |
| Qwater | 0.2 | 15.4 | 0.6 | 0.6 | 0.7 | |
| 102 | Qgas | 83 | 85 | 77 | 54 | 87 |
| Qoil | 14 | 152 | 12.6 | 12 | 13 | |
| Qwater | 7 | 53 | 4 | 4 | 5 | |
MAPE performance summary for all VFM_
| Hybrid VFM (combiner) | ||||||
|---|---|---|---|---|---|---|
| Well | Output | DD-VFM | TF-VFM | All | Full+TF | Surface+TF |
| 101 | Qgas | 16.6 | 9.6 | 11.8 | 9.0 | 8.7 |
| Qoil | 9.7 | 8.3 | 8.5 | 4.7 | 5.5 | |
| 102 | Qgas | 6.0 | 5.6 | 4.9 | 3.6 | 5.4 |
| Qoil | 3.1 | 17.5 | 1.3 | 1.2 | 1.3 | |