
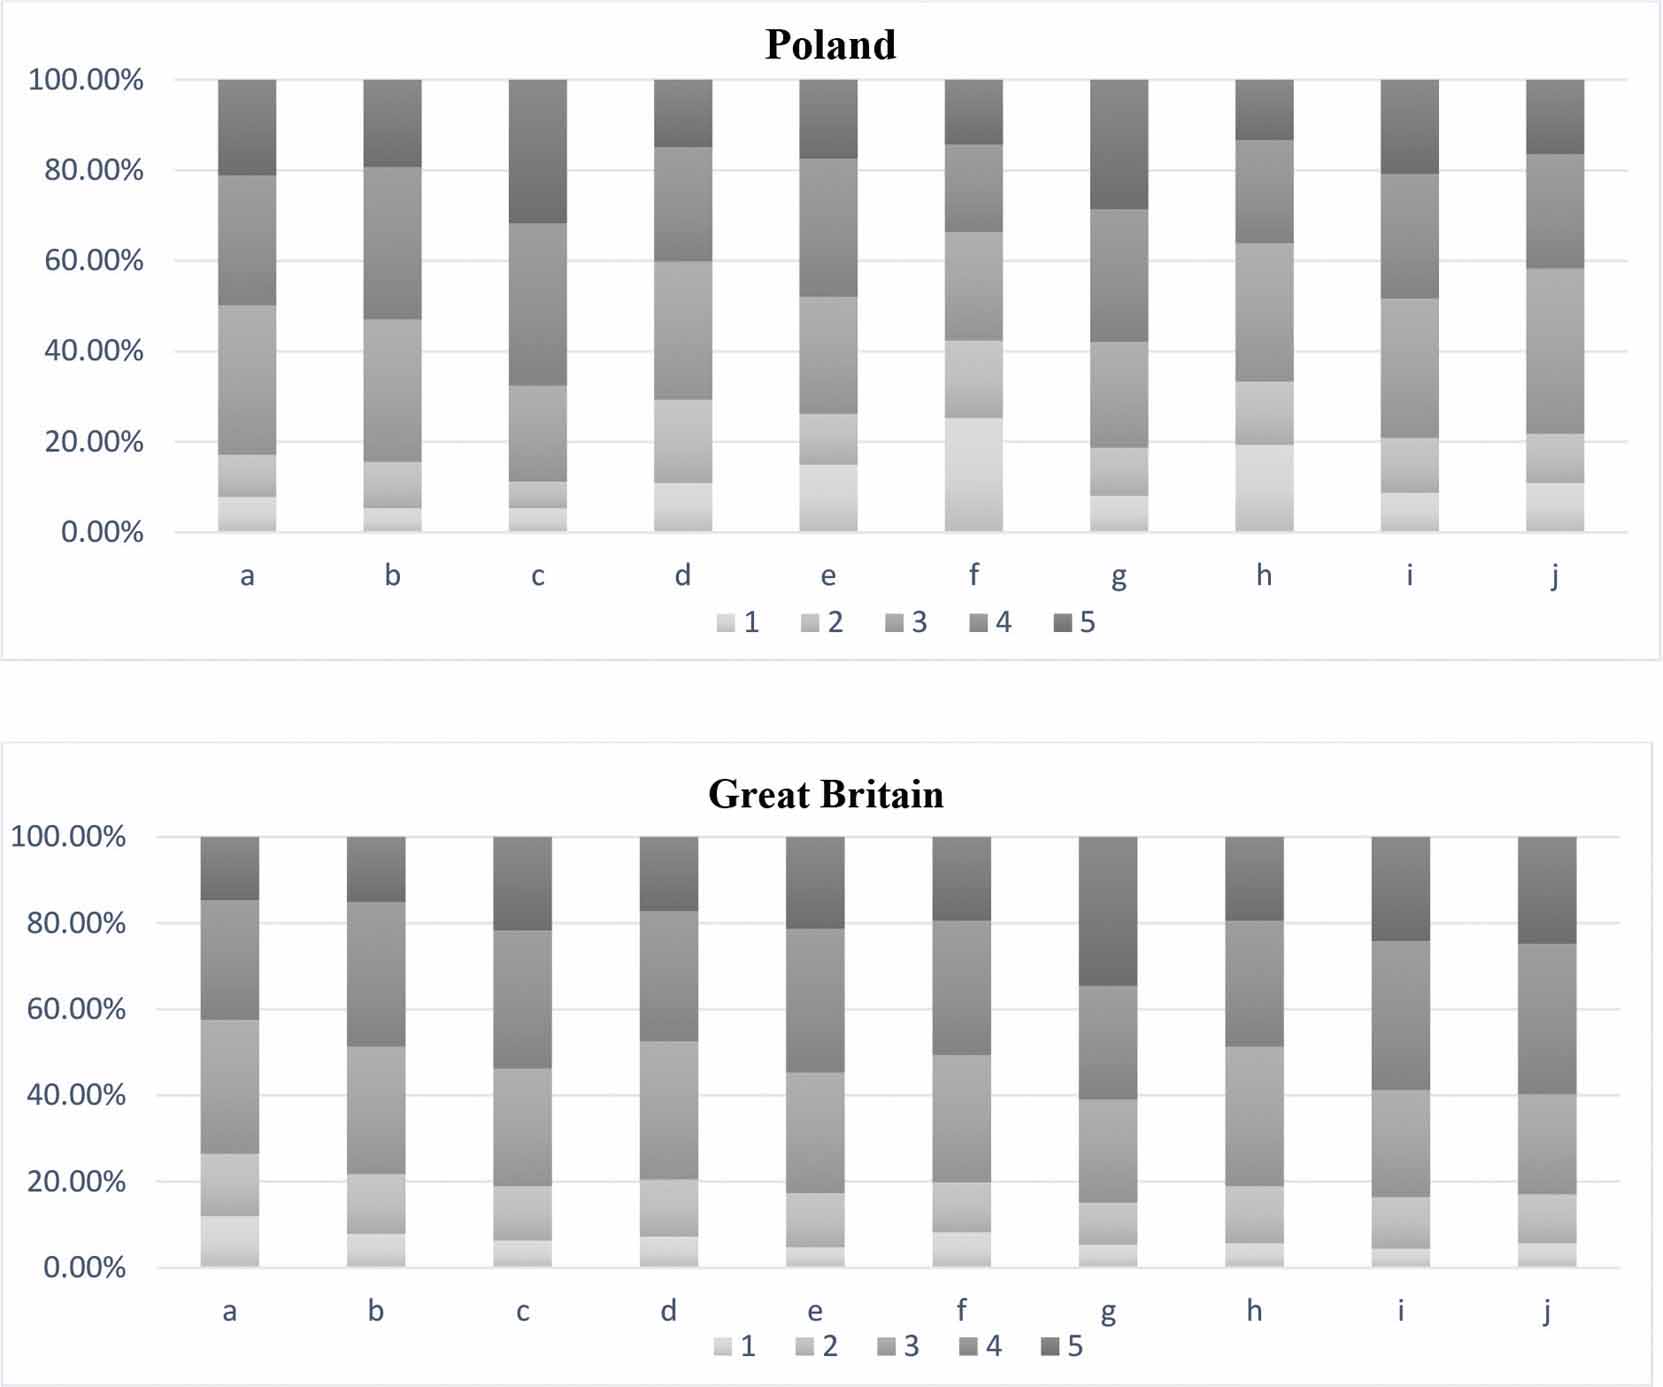
Figure 1.
Assessment of enterprises’ activities on social media impacting purchase decisions of Gen Z respondents –results of studies conducted in Poland and Great Britain in 2023. a. Publishing information about what is new in the offer; b. Presenting an application of a specific product/service; c. Publishing information about special offers; d. Presenting a test carried out by an expert; e. Recommendation from a known person; f. Participation in a competition; g. Receiving a discount coupon; h. Making the wall available for asking questions; i. An enterprise’s positive image; j. Social responsibility, social campaigns. where – 1 means the least impact, 5 – means the biggest impact.
Source: Own work.
Table 1.
Results of the Mann–Whitney U test examining the relationship between assessments of enterprises’ social media activities impacting purchase decisions and the gender of Gen Z respondents – results of studies conducted in Poland in 2023
| Variables | Sum of ranks female | Sum of ranks male | U | Z | p |
|---|---|---|---|---|---|
| Publishing information about what is new in the offer & gender | 23,859.50 | 27,821.50 | 11,769.50 | -1.37 | 0.1717 |
| Presenting an application of a specific product/service & gender | 24,114.50 | 27,566.50 | 12,024.50 | -1.05 | 0.2925 |
| Publishing information about special offers & gender | 22,935.00 | 28,746.00 | 10,845.00 | -2.54 | 0.0109 |
| Presenting a test carried out by an expert & gender | 24,596.00 | 27,085.00 | 12,506.00 | -0.44 | 0.6571 |
| Recommendation from a known person & gender | 23,789.00 | 27,892.00 | 11,699.00 | -1.44 | 0.1489 |
| Participation in a competition & gender | 23,928.50 | 27,752.50 | 11,838.50 | -1.26 | 0.2064 |
| Receiving a discount coupon & gender | 22,737.00 | 28,944.00 | 10,647.00 | -2.76 | 0.0058 |
| Making the wall available for asking questions & gender | 23,563.00 | 28,118.00 | 11,473.00 | -1.72 | 0.0853 |
| An enterprise’s positive image & gender | 24,233.00 | 27,448.00 | 12,143.00 | -0.90 | 0.3701 |
| Social responsibility, social campaigns & gender | 23,136.00 | 28,545.00 | 11,046.00 | -2.27 | 0.0231 |
Table 2.
Results of the Mann–Whitney U test examining the relationship between the assessments of enterprises’ social media activities impacting purchase decisions and the gender of Gen Z respondents – results of studies conducted in Great Britain in 2023
| Variables | Sum of ranks female | Sum of ranks male | U | Z | p |
|---|---|---|---|---|---|
| Publishing information about what is new in the offer & gender | 17,244.00 | 33,477.00 | 10,104.00 | 2.26 | 0.0241 |
| Presenting an application of a specific product/service & gender | 19,348.00 | 31,373.00 | 11,473.00 | -0.48 | 0.6314 |
| Publishing information about special offers & gender | 18,583.50 | 32,137.50 | 11,443.50 | 0.52 | 0.6051 |
| Presenting a test carried out by an expert & gender | 17,626.50 | 33,094.50 | 10,486.50 | 1.77 | 0.0772 |
| Recommendation from a known person & gender | 17,523.00 | 33,198.00 | 10,383.00 | 1.91 | 0.0568 |
| Participation in a competition & gender | 17,596.50 | 33,124.50 | 10,456.50 | 1.80 | 0.0713 |
| Receiving a discount coupon & gender | 16,387.50 | 34,333.50 | 9,247.50 | 3.34 | 0.0007 |
| Making the wall available for asking questions & gender | 18,137.50 | 32,583.50 | 10,997.50 | 1.10 | 0.2711 |
| An enterprise’s positive image & gender | 18,283.50 | 32,437.50 | 11,143.50 | 0.91 | 0.3620 |
| Social responsibility, social campaigns & gender | 17,718.50 | 33,002.50 | 10,578.50 | 1.65 | 0.0988 |
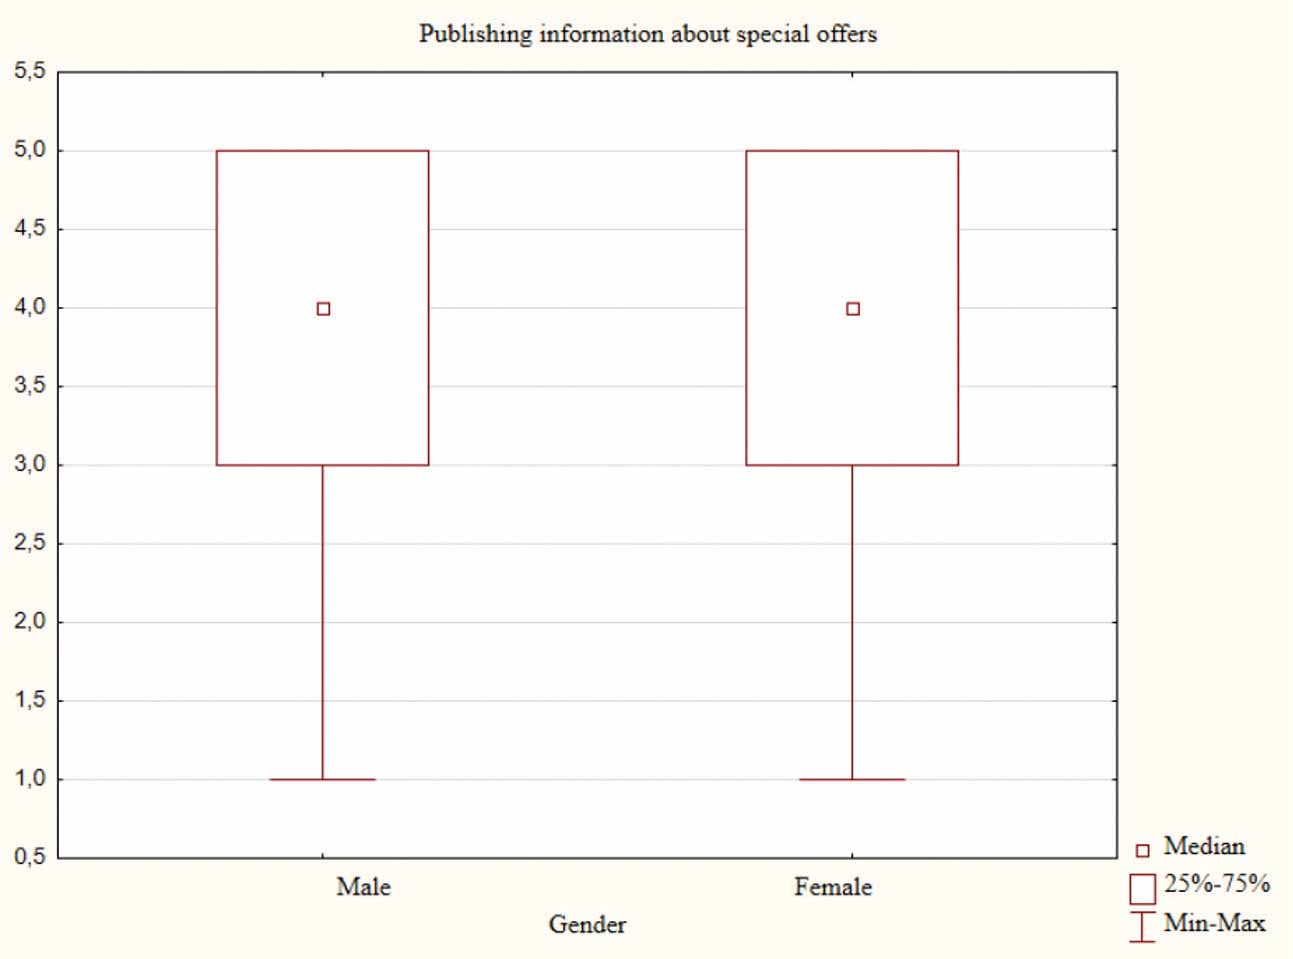
Figure 2.
Assessment of the impact of enterprises’ publishing information about special offers on social media on Gen Zers’ purchase decisions by the respondent’s gender in Poland in 2023.
Source: Own work.
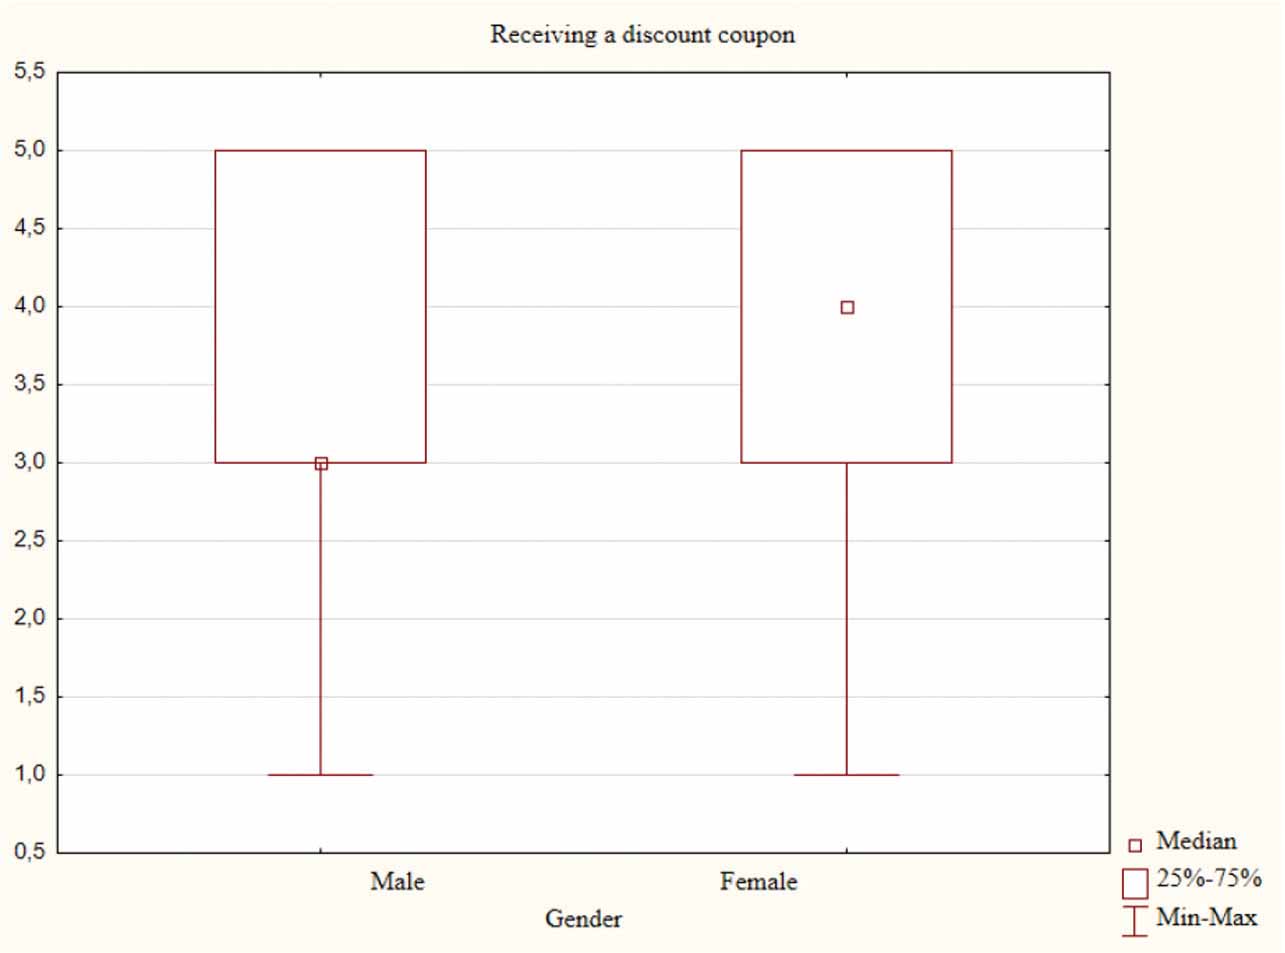
Figure 3.
Assessment of the impact of receiving a discount coupon on social media on Gen Zers’ purchase decisions by the respondent’s gender in Poland in 2023.
Source: Own work.
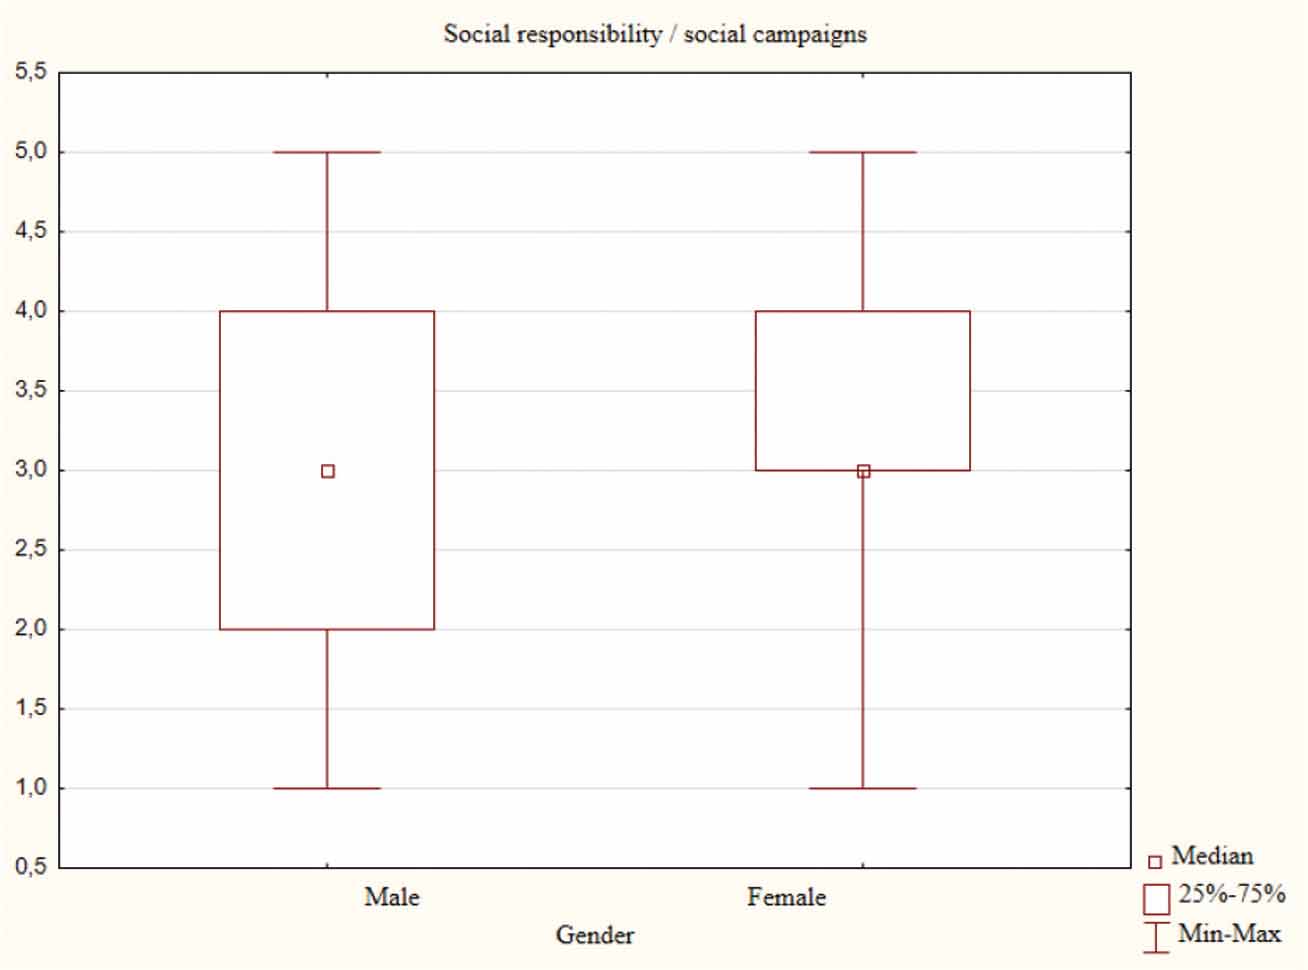
Figure 4.
Assessment of the impact of social responsibility/social campaigns run by enterprises on social media on Gen Zers’ purchase decisions by the respondent’s gender in Poland in 2023.
Source: Own work.
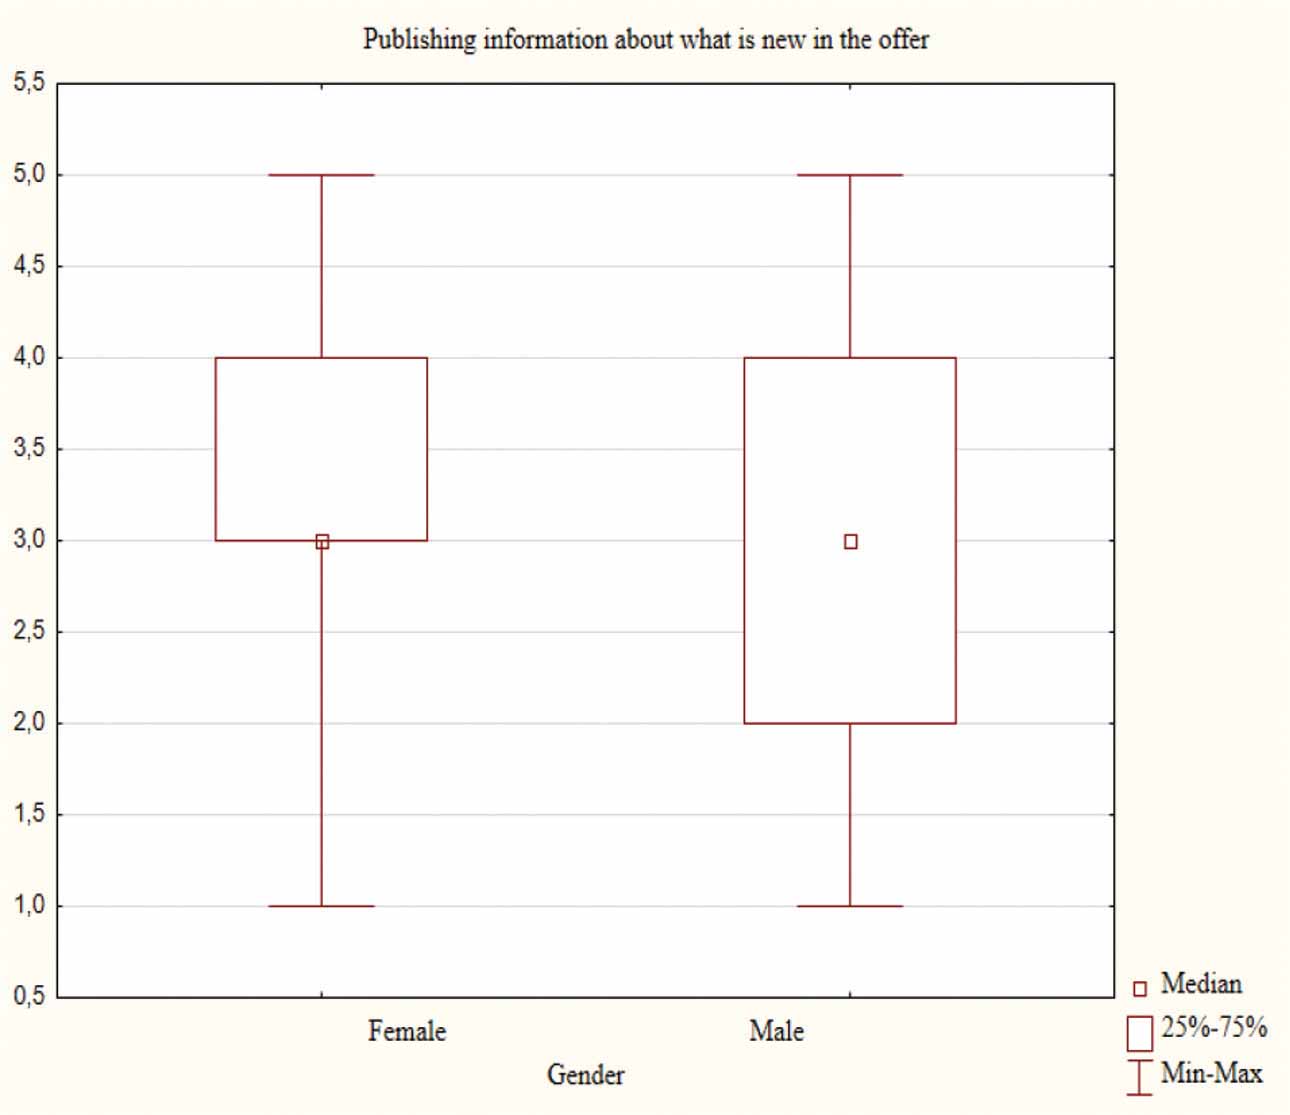
Figure 5.
Assessment of the impact of enterprises’ publishing information about what is new in the offer on social media on Gen Zers’ purchase decisions by the respondents’ gender in Great Britain in 2023.
Source: Own work.
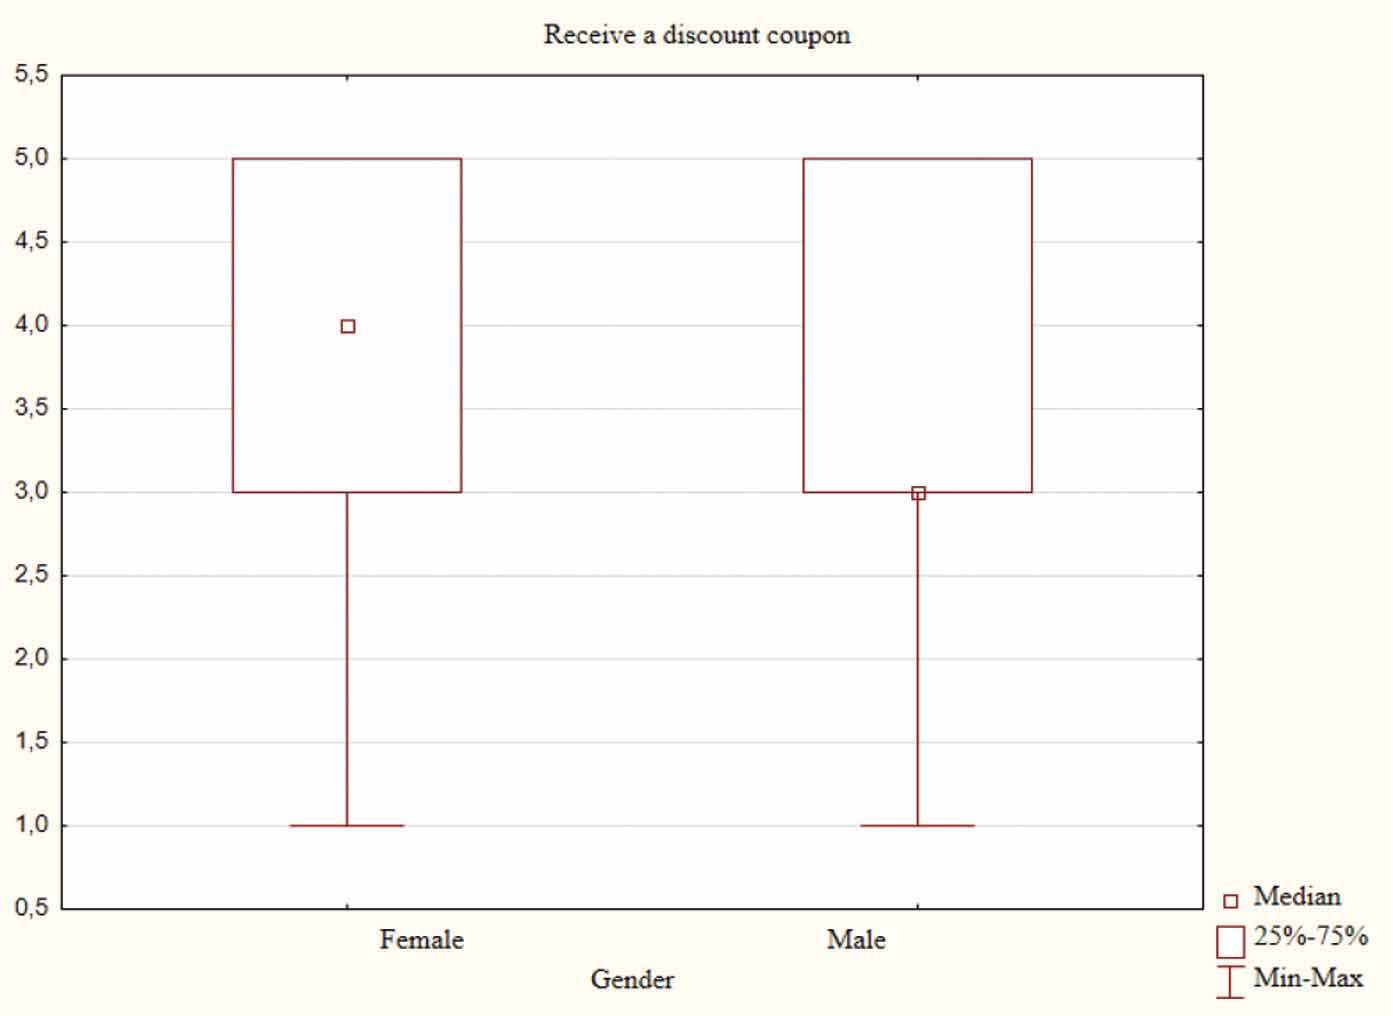
Figure 6.
Assessment of the impact of receiving a discount coupon on social media on Gen Zers’ purchase decisions by the respondents’ gender in Great Britain in 2023.
Source: Own work.
Table 3.
Spearman’s rank correlation coefficient displaying the relationship between the impact of enterprises’ social media activities on purchasing decisions and the respondents’ place of residence in Poland in 2023
| Variables | N of valid ones | Spearman’s rank R | t (N-2) | p |
|---|---|---|---|---|
| Publishing information about what is new in the offer & place of residence | 321 | 0.0452 | 0.8088 | 0.4192 |
| Presenting an application of a specific product/service & place of residence | 321 | 0.0131 | 0.2346 | 0.8146 |
| Publishing information about special offers & place of residence | 321 | 0.0266 | 0.4761 | 0.6343 |
| Presenting a test carried out by an expert & place of residence | 321 | 0.0512 | 0.9161 | 0.3603 |
| Recommendation from a known person & place of residence | 321 | 0.0643 | 1.1500 | 0.2510 |
| Participation in a competition & place of residence | 321 | 0.0618 | 1.1060 | 0.2695 |
| Receiving a discount coupon & place of residence | 321 | 0.0212 | 0.3787 | 0.7052 |
| Making the wall available for asking questions & place of residence | 321 | 0.0959 | 1.7208 | 0.0863 |
| An enterprise’s positive image & place of residence | 321 | 0.1302 | 2.3455 | 0.0196 |
| Social responsibility, social campaigns & place of residence | 321 | 0.0506 | 0.9054 | 0.3659 |
Table 4.
Spearman’s rank correlation coefficient displaying the relationship between the impact of enterprises’ activities on social media on purchase decisions and the respondents’ place of residence in Great Britain in 2023
| Variables | N of valid ones | Spearman’s rank R | t (N-2) | p |
|---|---|---|---|---|
| Publishing information about what is new in the offer & place of residence | 318 | 0.0542 | 0.9653 | 0.3351 |
| Presenting an application of a specific product/service & place of residence | 318 | 0.1009 | 1.8025 | 0.0724 |
| Publishing information about special offers & place of residence | 318 | 0.1069 | 1.9109 | 0.0569 |
| Presenting a test carried out by an expert & place of residence | 318 | 0.0020 | 0.0356 | 0.9717 |
| Recommendation from a known person & place of residence | 318 | 0.0230 | 0.4085 | 0.6832 |
| Participation in a competition & place of residence | 318 | 0.0502 | 0.8927 | 0.3727 |
| Receiving a discount coupon & place of residence | 318 | 0.1072 | 1.9181 | 0.0560 |
| Making the wall available for asking questions & place of residence | 318 | 0.1545 | 2.7796 | 0.0058 |
| An enterprise’s positive image & place of residence | 318 | 0.0612 | 1.0901 | 0.2765 |
| Social responsibility, social campaigns & place of residence | 318 | 0.1162 | 2.0798 | 0.0385 |
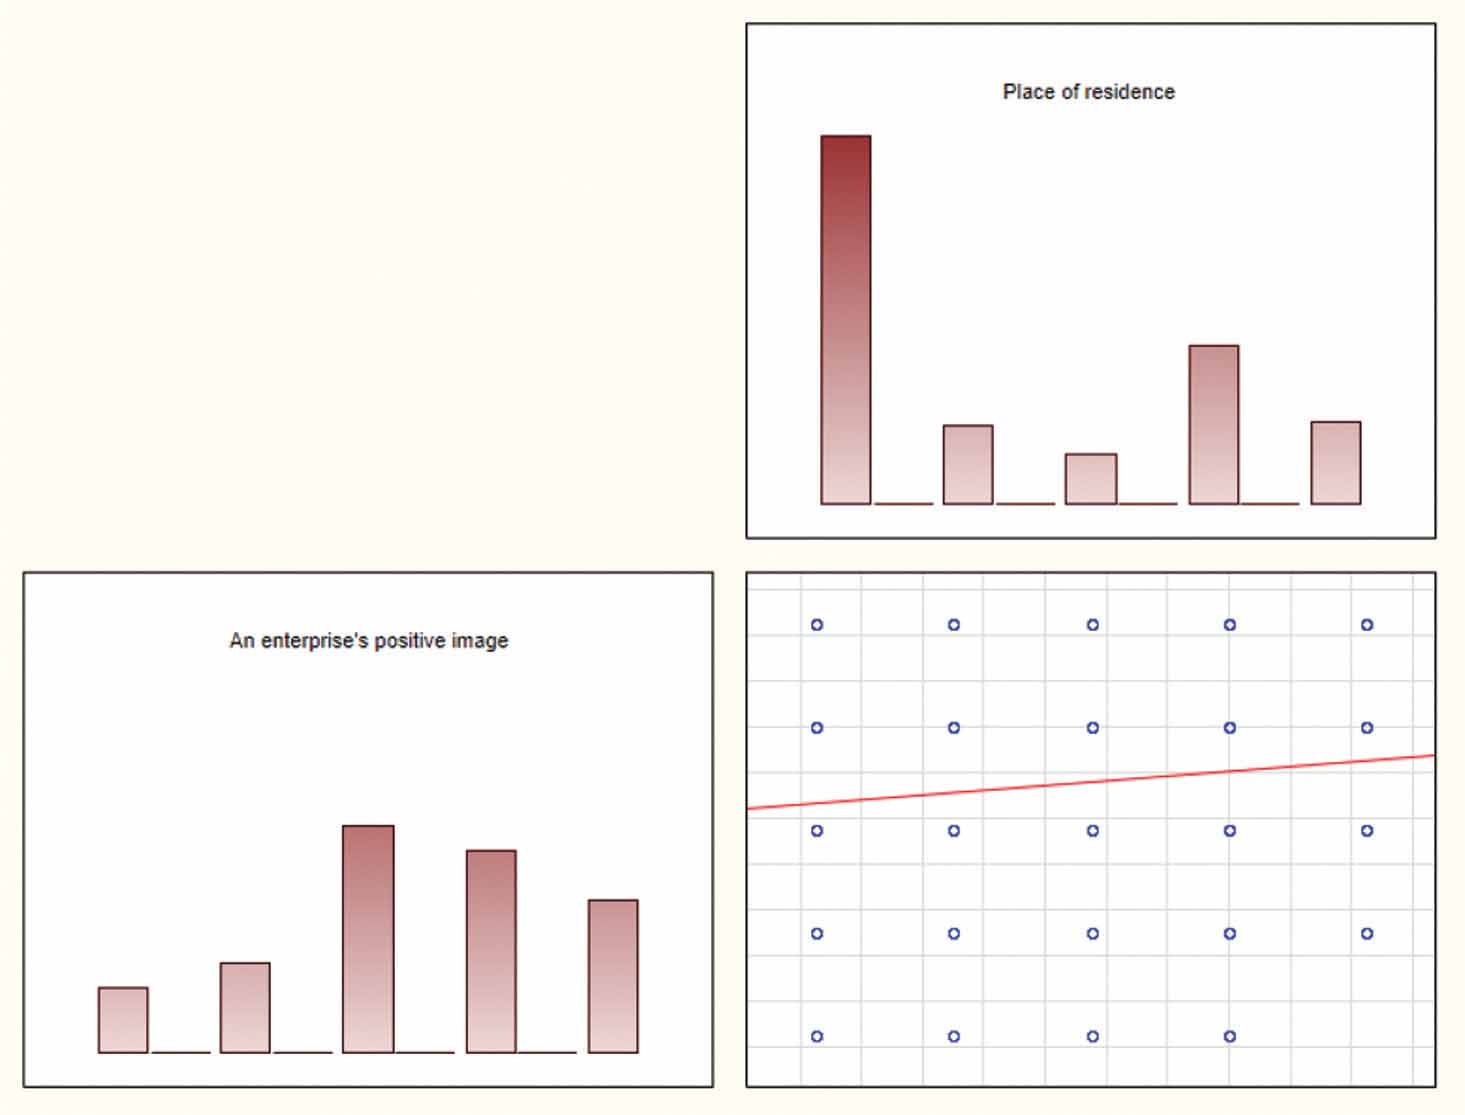
Figure 7.
Spearman’s rank correlation coefficient displaying the relationship between the rating of an enterprise’s positive image on social media and the respondent’s place of residence in Poland in 2023.
Source: Own work.
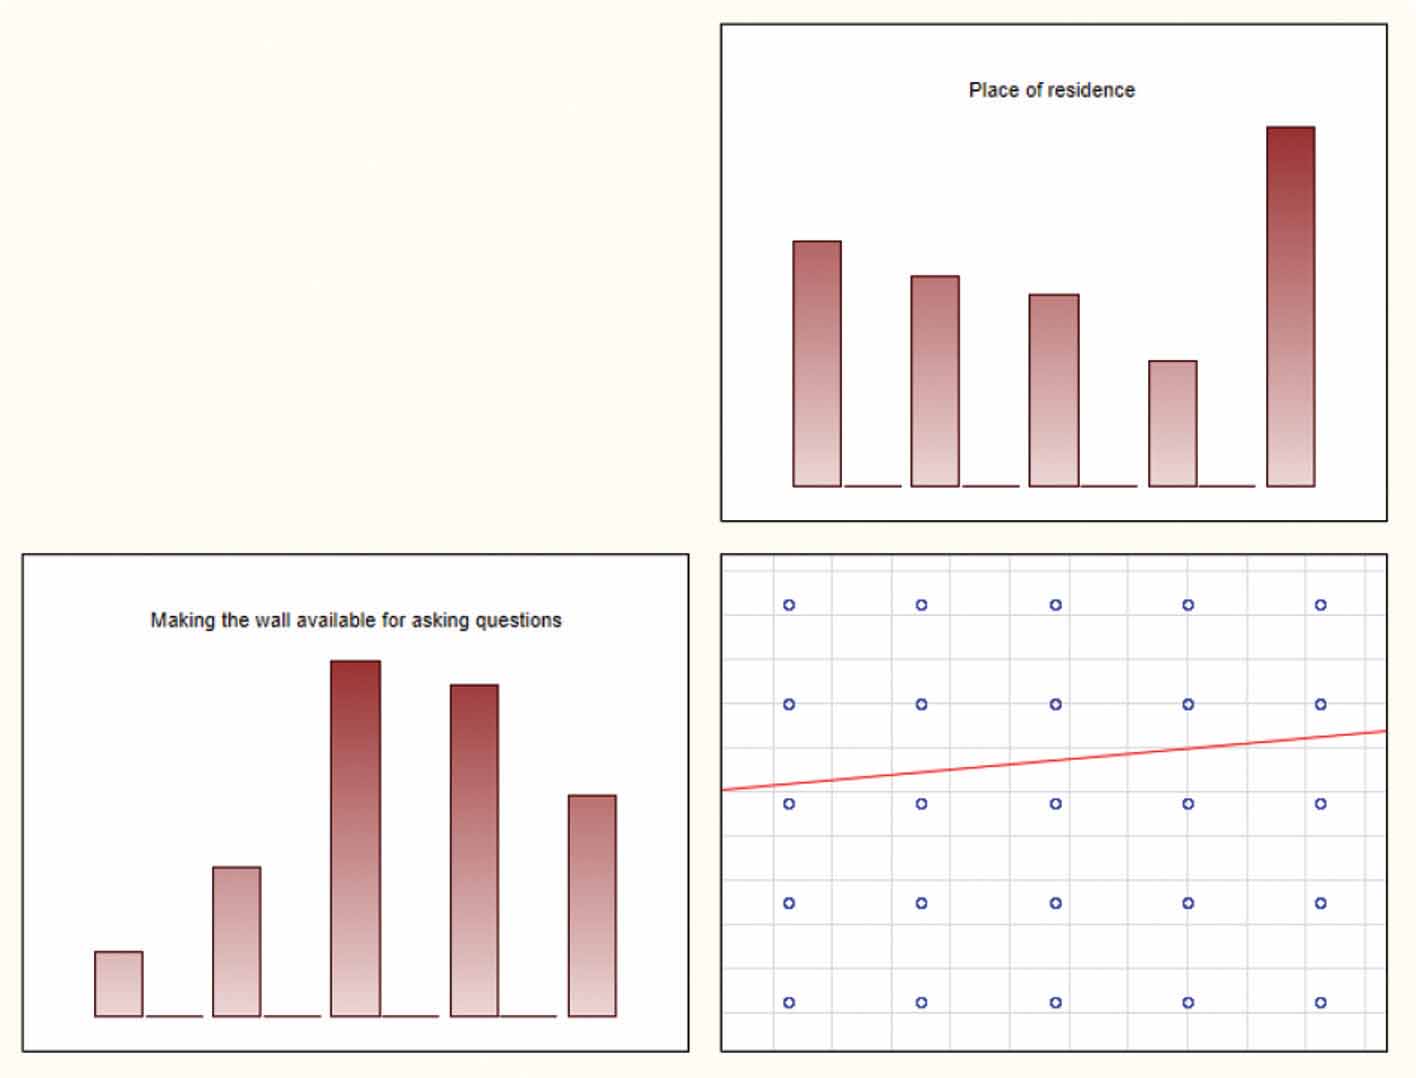
Figure 8.
Spearman’s rank correlation coefficient revealing the relationship between the rating of enterprises making the wall available for asking questions and the respondent’s place of residence in Great Britain in 2023.
Source: Own work.
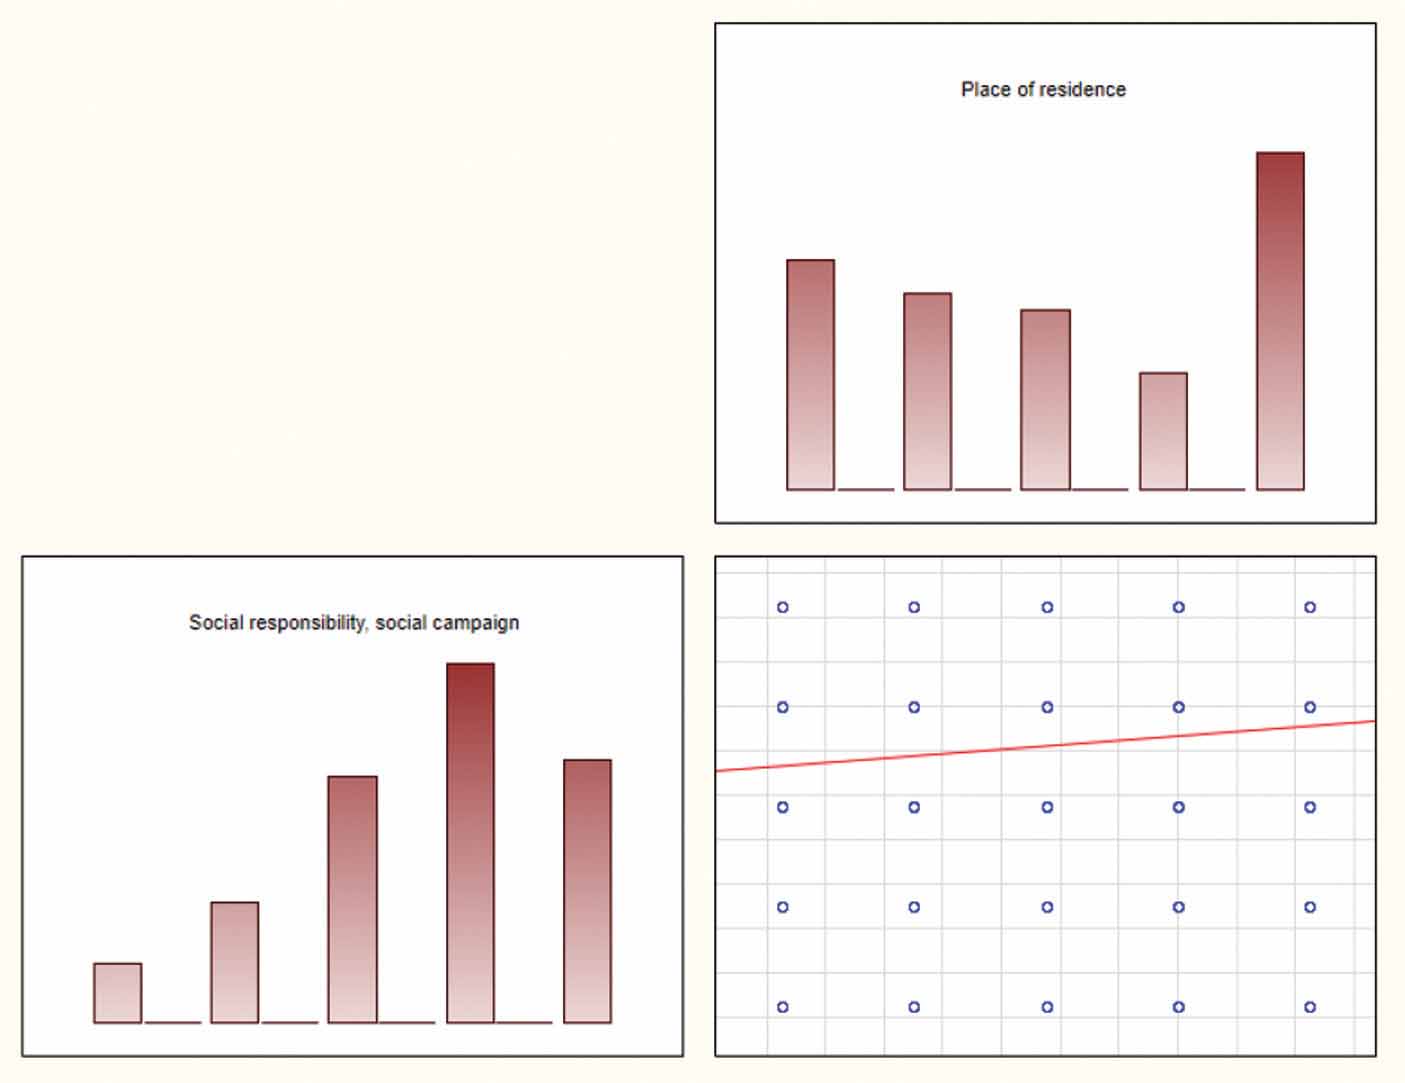
Figure 9.
Spearman’s rank correlation coefficient displaying the relationship between the rating of enterprises’ social responsibility on social media and the respondent’s place of residence in Great Britain in 2023.
Source: Own work.