
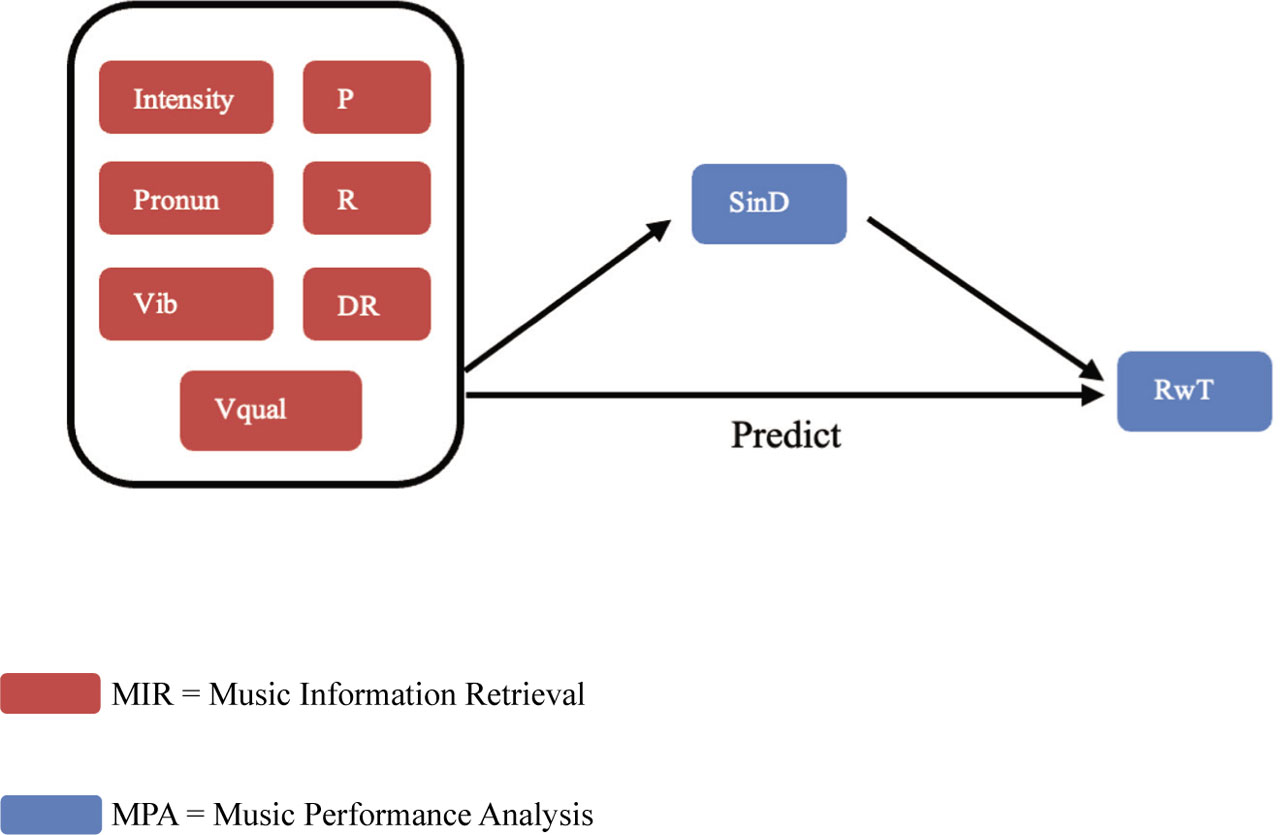
Figure 1.
The singing efficiency prediction model. RwT: rework times; SinD: singing duration; DR: dynamic range.

Figure 2.
A qualified wave diagram.
Table 1.
RwT correlated with the acoustic variables.
Table 2.
Linear regression analysis examining the relationship between predictive variables and SinD.
| Model Variables | B | S.E | β | 95% CI | AIC | R2 | ∆R2 | |
|---|---|---|---|---|---|---|---|---|
| LL | UL | |||||||
| Step 1 | 1,633.49 | 0.24*** | 0.23 | |||||
| R | −0.601 | 0.097 | −0.27*** | −0.075 | −0.039 | |||
| P | 0.012 | 0.007 | 0.072** | −0.936 | −0.626 | |||
| DR | −0.038 | 0.017 | −0.09** | −0.010 | 0.016 | |||
| Pronun | −0.168 | 0.110 | −0.06 | −0.032 | 0.035 | |||
| Vib | −0.001 | 0.000 | −0.053 | −0.429 | 0.099 | |||
| Vqual | −0.087 | 0.140 | −0.025 | −0.001 | 0.000 | |||
| Step 2 | 1,542.07 | 0.40*** | 0.40 | |||||
| Intensity | −0.826 | 0.082 | −0.44*** | −0.988 | −0.664 | |||
| Step 3 | 1,163.11 | 0.45*** | 0.45 | |||||
| SinD | −0.057 | 0.009 | −0.27*** | −0.075 | −0.039 | |||
Table 3.
Mediation effect test of SinD.
Table 4.
Mediation effect size of SinD.
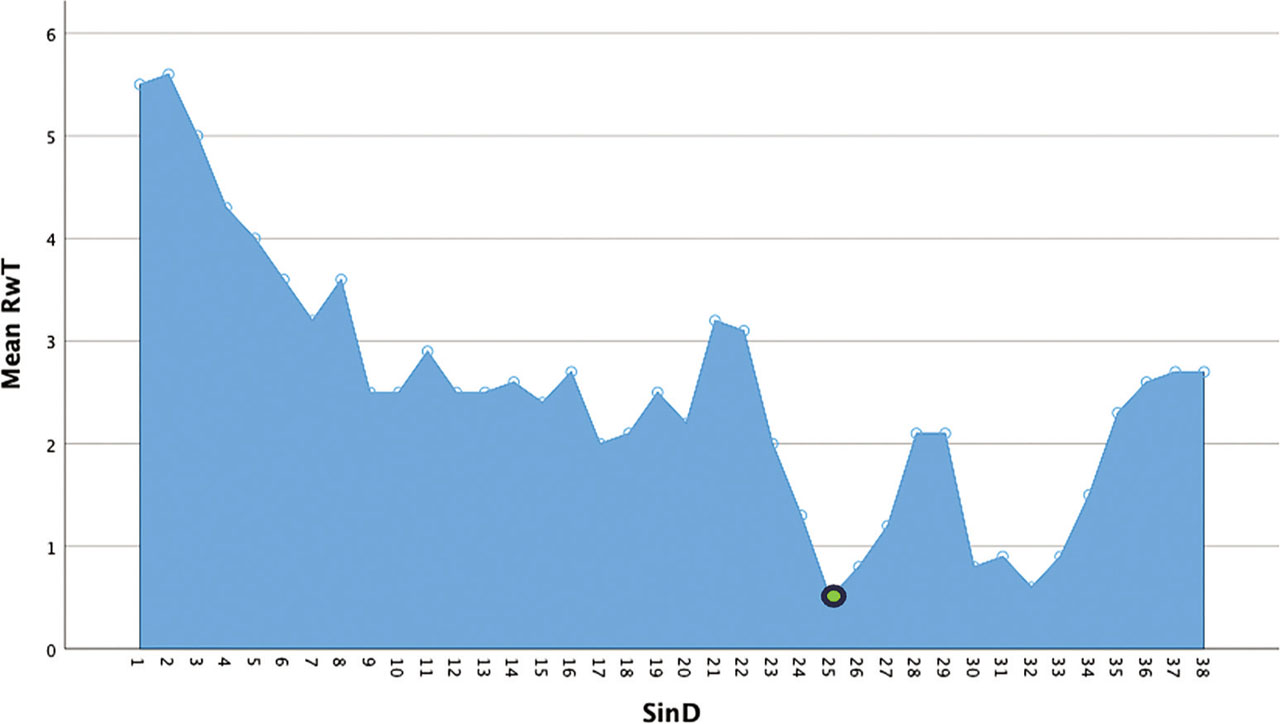
Figure 3.
Mean RwT changed by SinD. RwT: rework times; SinD: singing duration.
Table 5.
Frequency of the acoustic best performance in each part of the song.
| Duration | Variable | |||
|---|---|---|---|---|
| RwT = 0 | Intensity 3 75 | R = 6 | P £ 50 | |
| Verse 1 | 12 (15.0%) | 26 (32.5%) | 30 (37.5%) | 77 (96.25%) |
| Chorus 1 | 11 (13.75%) | 28.75 (35.94%) | 55 (68.75%) | 78 (97.5%) |
| Verse 2 | 13 (16.25%) | 11 (27.5%) | 21 (52.5%) | 38 (95.0%) |
| Chorus 2 | 40 (50.0%) | 43 (53.75%) | 51 (63.75%) | 80 (100%) |
| Post-chorus | 38 (47.5%) | 45 (56.25%) | 58 (72.5%) | 79 (98.75%) |
| Outro | 6 (30.0%) | 8 (40.0%) | 10 (25.0%) | 18 (90.0%) |