
Table 1
LO codes and LOs for class VIII (science).
| LO code | LOs for class VIII (Science) |
|---|---|
| SCI703 | Classifies materials and organisms based on properties/characteristics |
| SCI704 | Conducts a simple investigation to seek answers to queries |
| SCI705 | Relates processes and phenomena with causes |
| SCI708 | Measures and calculates, e.g., temperature, pulse rate, speed of moving objects, time period of simple pendulum, etc. |
| SCI710 | Plots and interprets graphs |
| SCI711 | Constructs models using materials from the surroundings and explain their working |
| SCI801 | Differentiates materials, organisms and processes |
| SCI804 | Relates processes with phenomena with causes |
| SCI805 | Explains processes and phenomena |
| SCI807 | Measures angles of incidence and reflection |
| SCI811 | Applies learning of scientific concepts in day-to-day life |
| SCI813 | Makes efforts to protect environment |
Source: Adapted from NCERT (2017). Learning Outcomes at the secondary stages.
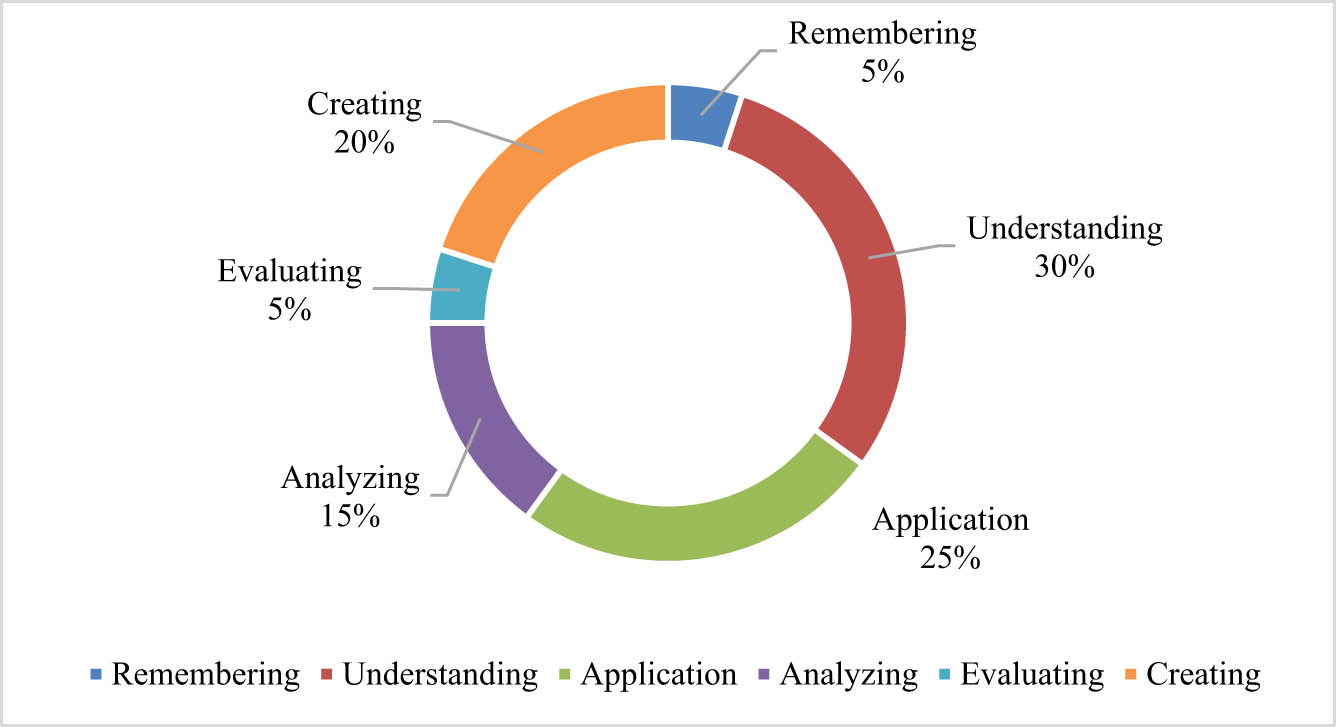
Figure 1
LO distribution in class VII, NCERT curriculum, 2017.
Source: Author’s Contribution
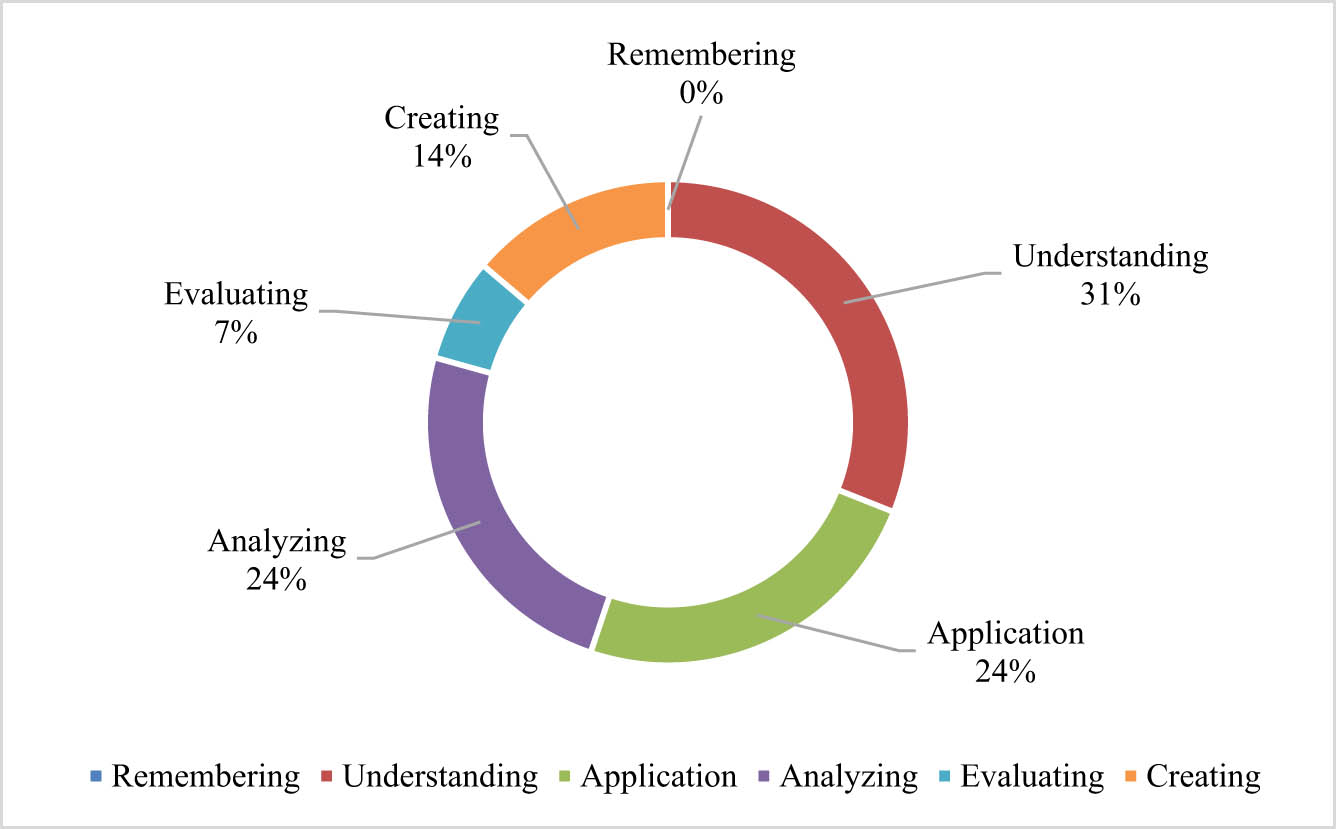
Figure 2
LO distribution of class VIII, NCERT curriculum, 2017.
Source: Author’s Contribution
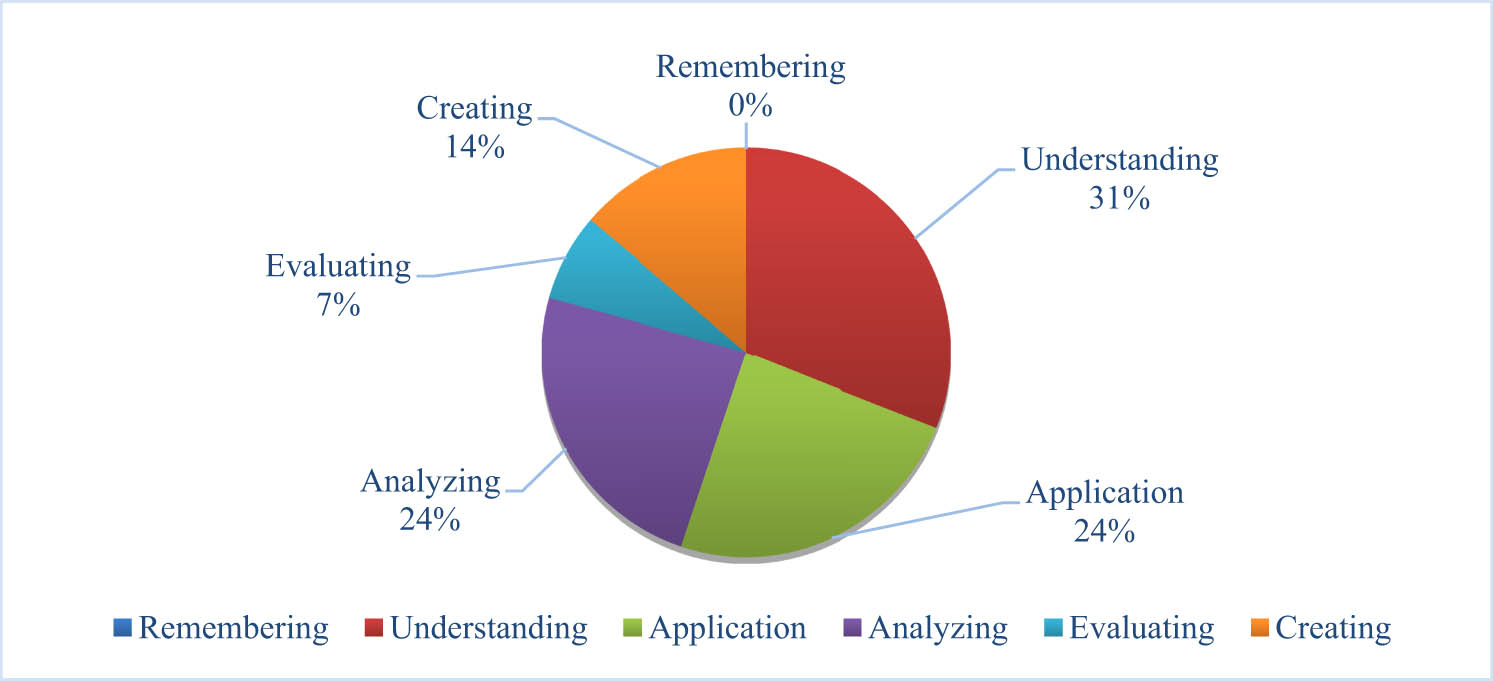
Figure 3
LO distribution of NAS 2017 and 2021.
Source: Author’s Contribution
Table 2
LO distribution in NCERT Curriculum and NAS.
| Cognitive domains | Curriculum (NCERT) | Curriculum (NCERT) | NAS (2017, 2021) |
|---|---|---|---|
| LOs class VII (%) | LOs class VIII (%) | LOs (%) | |
| Remembering | 5.55 | 5.55 | 0 |
| Understanding | 30.00 | 22.22 | 31.00 |
| Applying | 25.00 | 27.78 | 24.13 |
| Analysing | 15.00 | 16.67 | 24.13 |
| Evaluating | 5.00 | 5.55 | 6.89 |
| Creating | 20.00 | 22.22 | 13.79 |
Source: Author’s Contribution
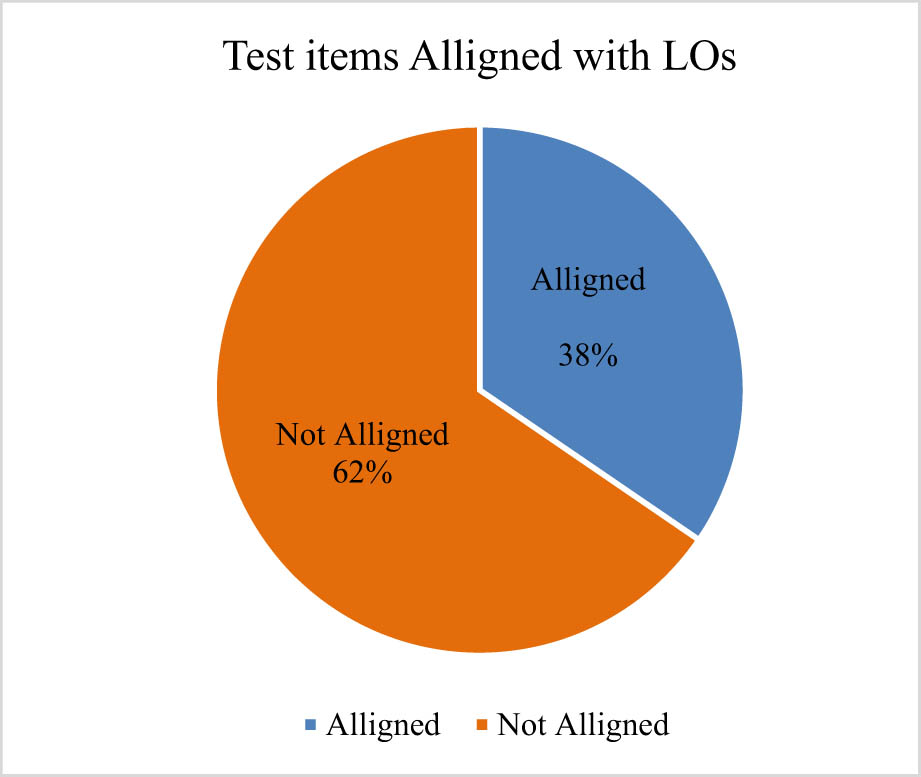
Figure 4
Test items alignment with NCERT LOs.
Source: Author’s Contribution
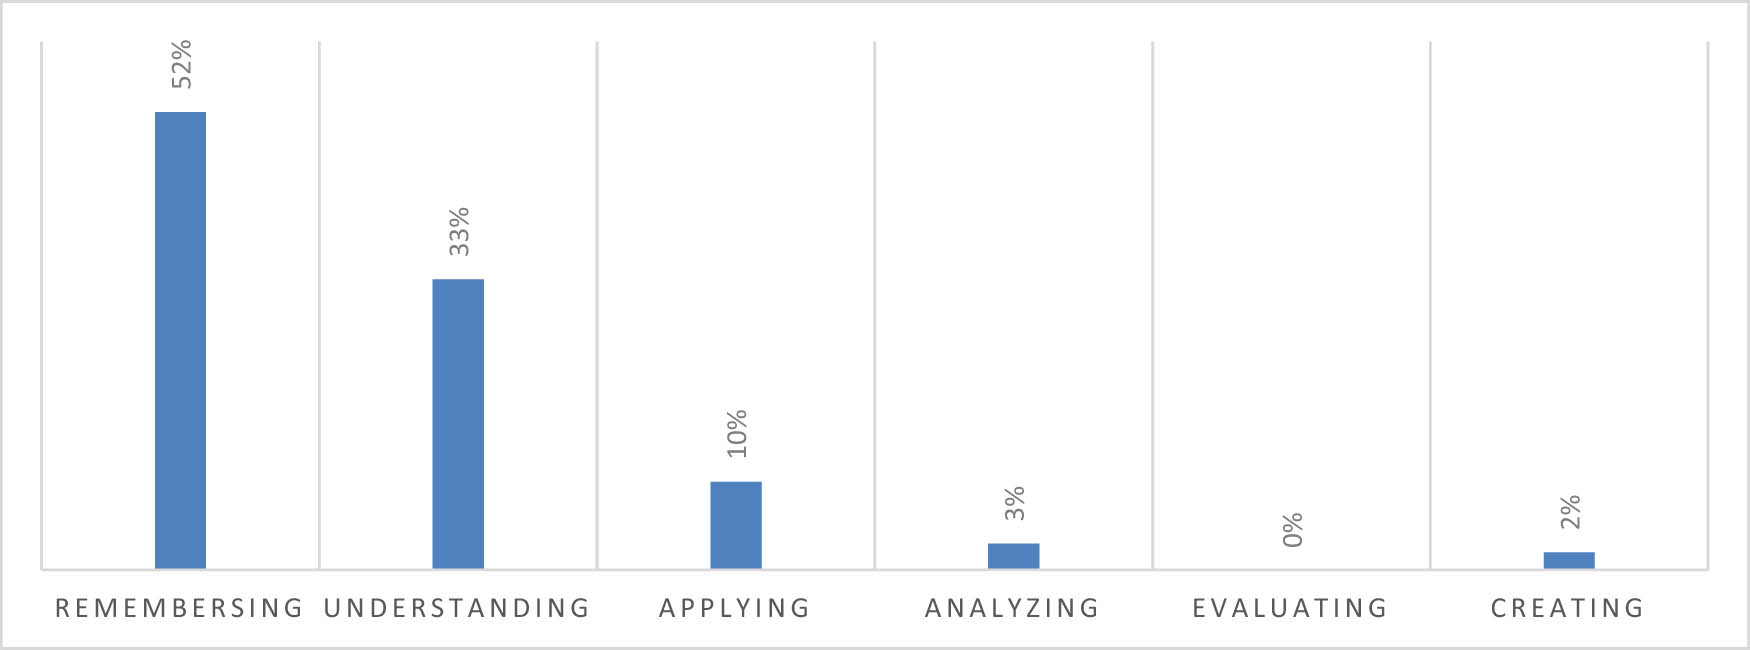
Figure 5
Test item alignment with cognitive levels.
Source: Author’s Contribution
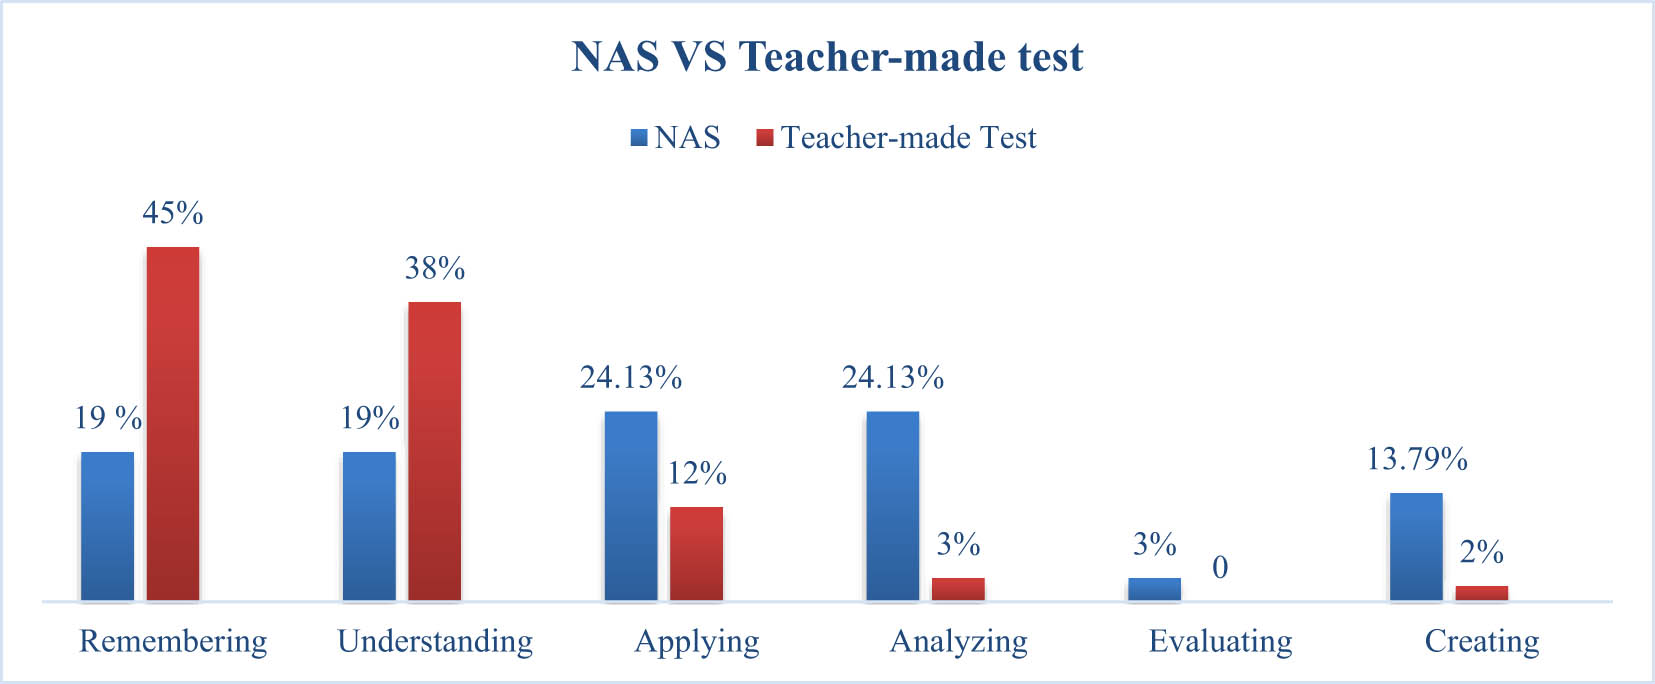
Figure 6
Comparison of items between NAS and the teacher-made test.
Source: Author’s Contribution
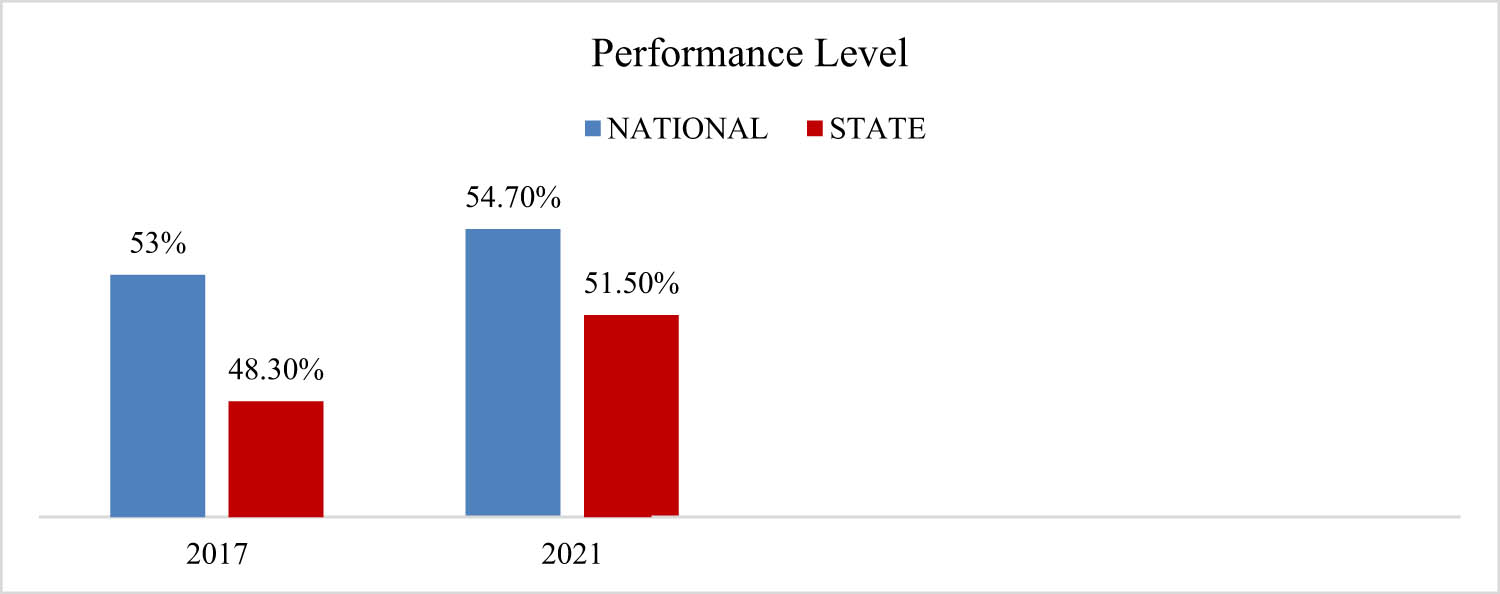
Figure 7
Performance in 2017 and 2021: state vs national.
Source: Author’s Contribution
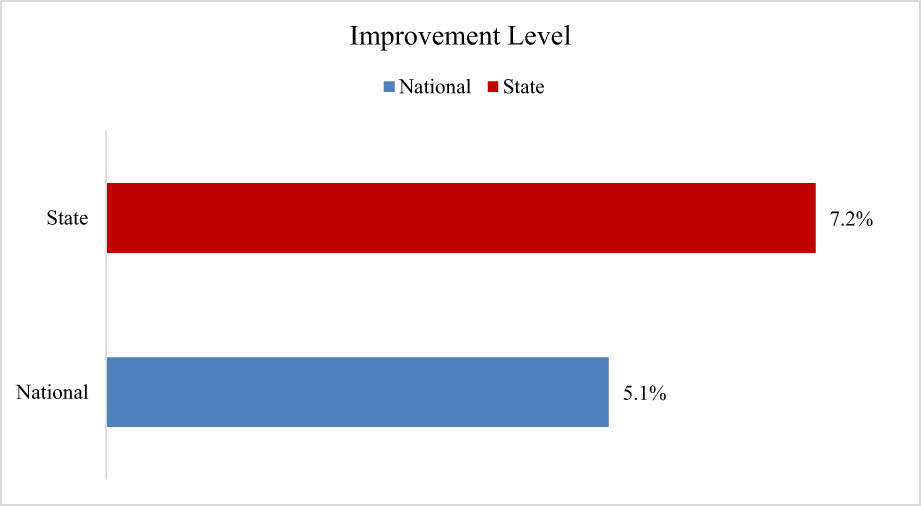
Figure 8
Improvement level: Odisha vs national.
Source: Author’s Contribution