
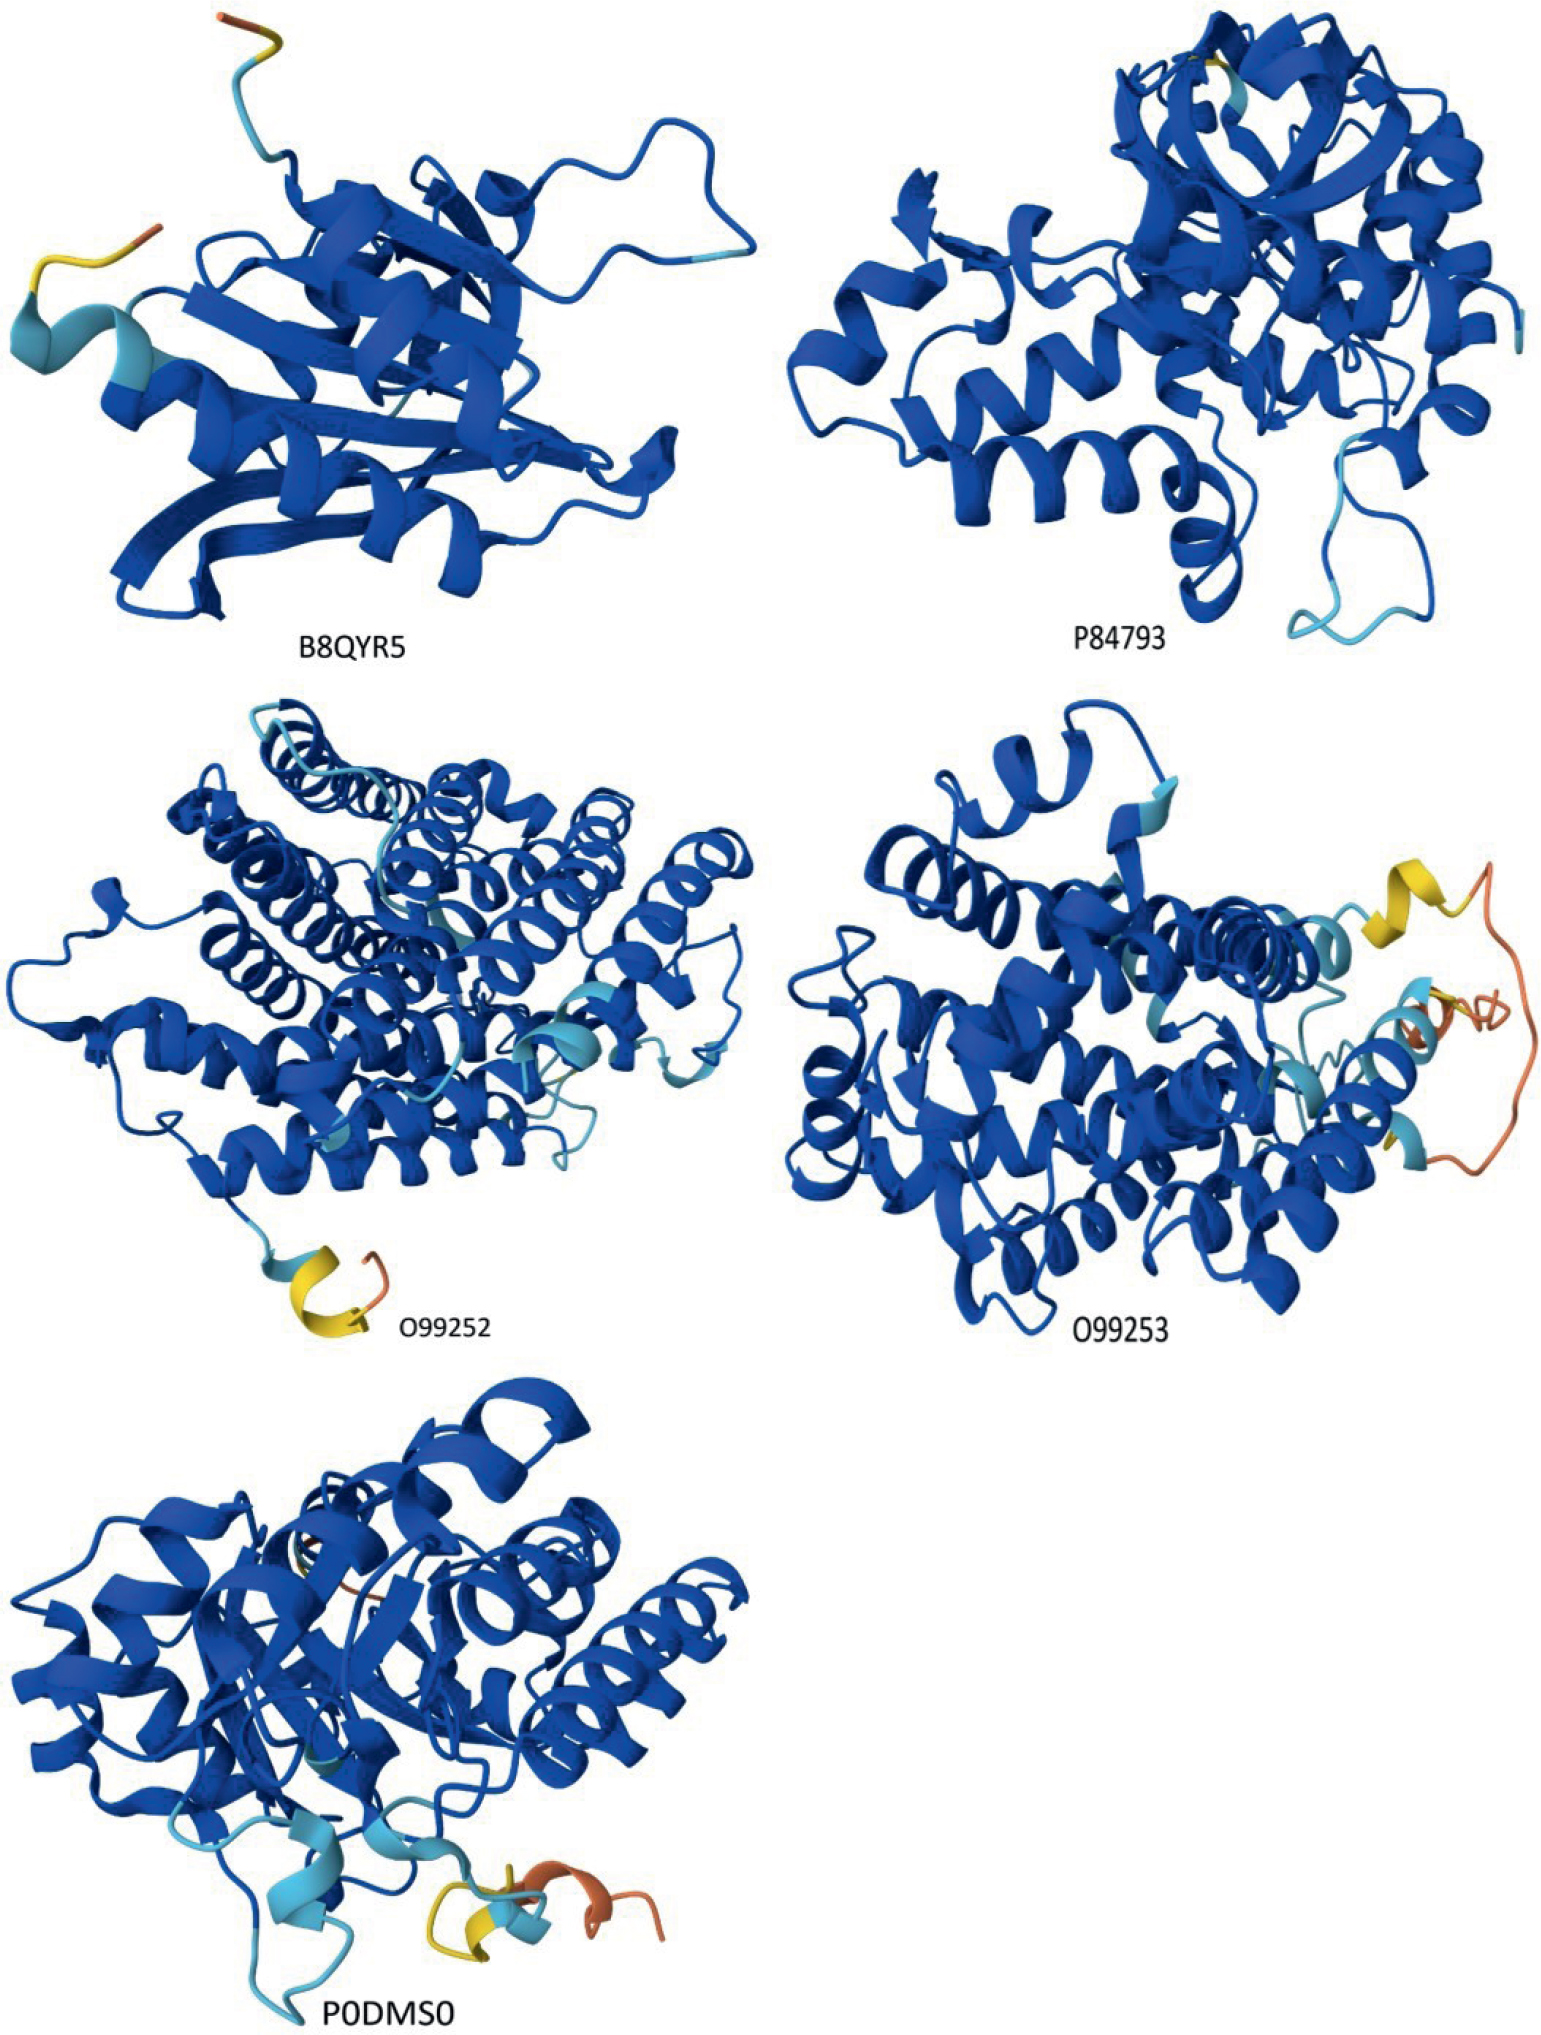
Fig. 1.
Three-dimensional structures of Plasmodium berghei proteins—Profilin (AFDB: B8QYR5), L-lactate dehydrogenase (AFDB: P84793), Cytochrome c oxidase subunit 1 (COI; AFDB: O99252), Cytochrome b (MT-CYB; AFDB: O99253), and Pyridoxal 5’-phosphate synthase subunit Pdx1 (AFDB: PODMsO)—retrieved from the UniProt protein database (https://www.uniprot.org/)
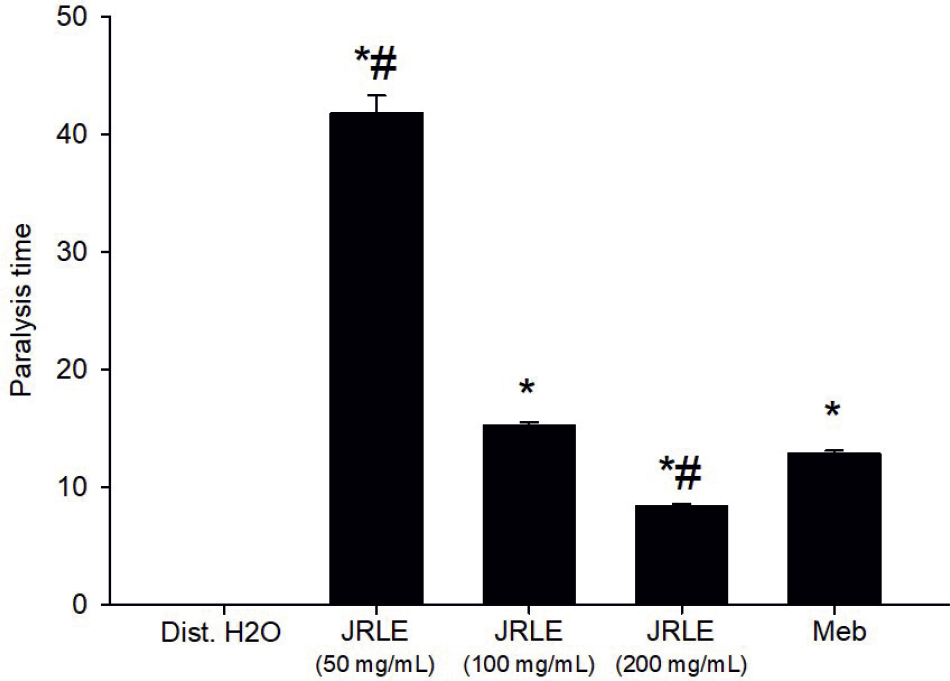
Fig. 2.
Time taken for paralysis of the earthworms, E. fetida, in various treatments. * Significance change with respect to those treated with dist. H2O, #Significance change compared to those treated with mebendazole.
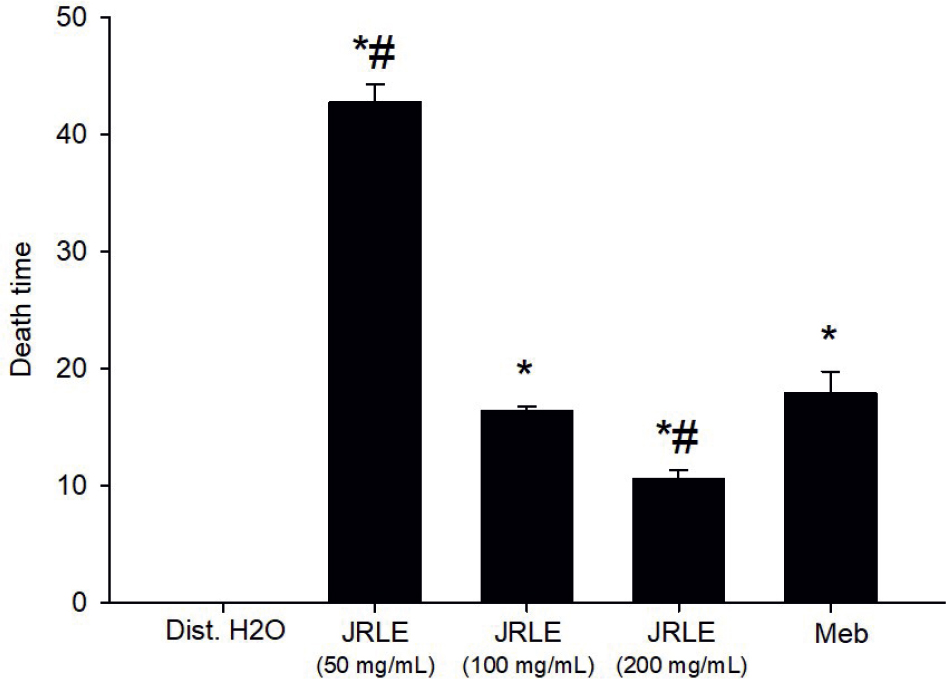
Fig. 3.
Time taken for the Death of the earthworms, E. fetida, in various treatments. * Significance change with respect to those treated with dist. H2O, #Significance change compared to those treated with mebendazole.
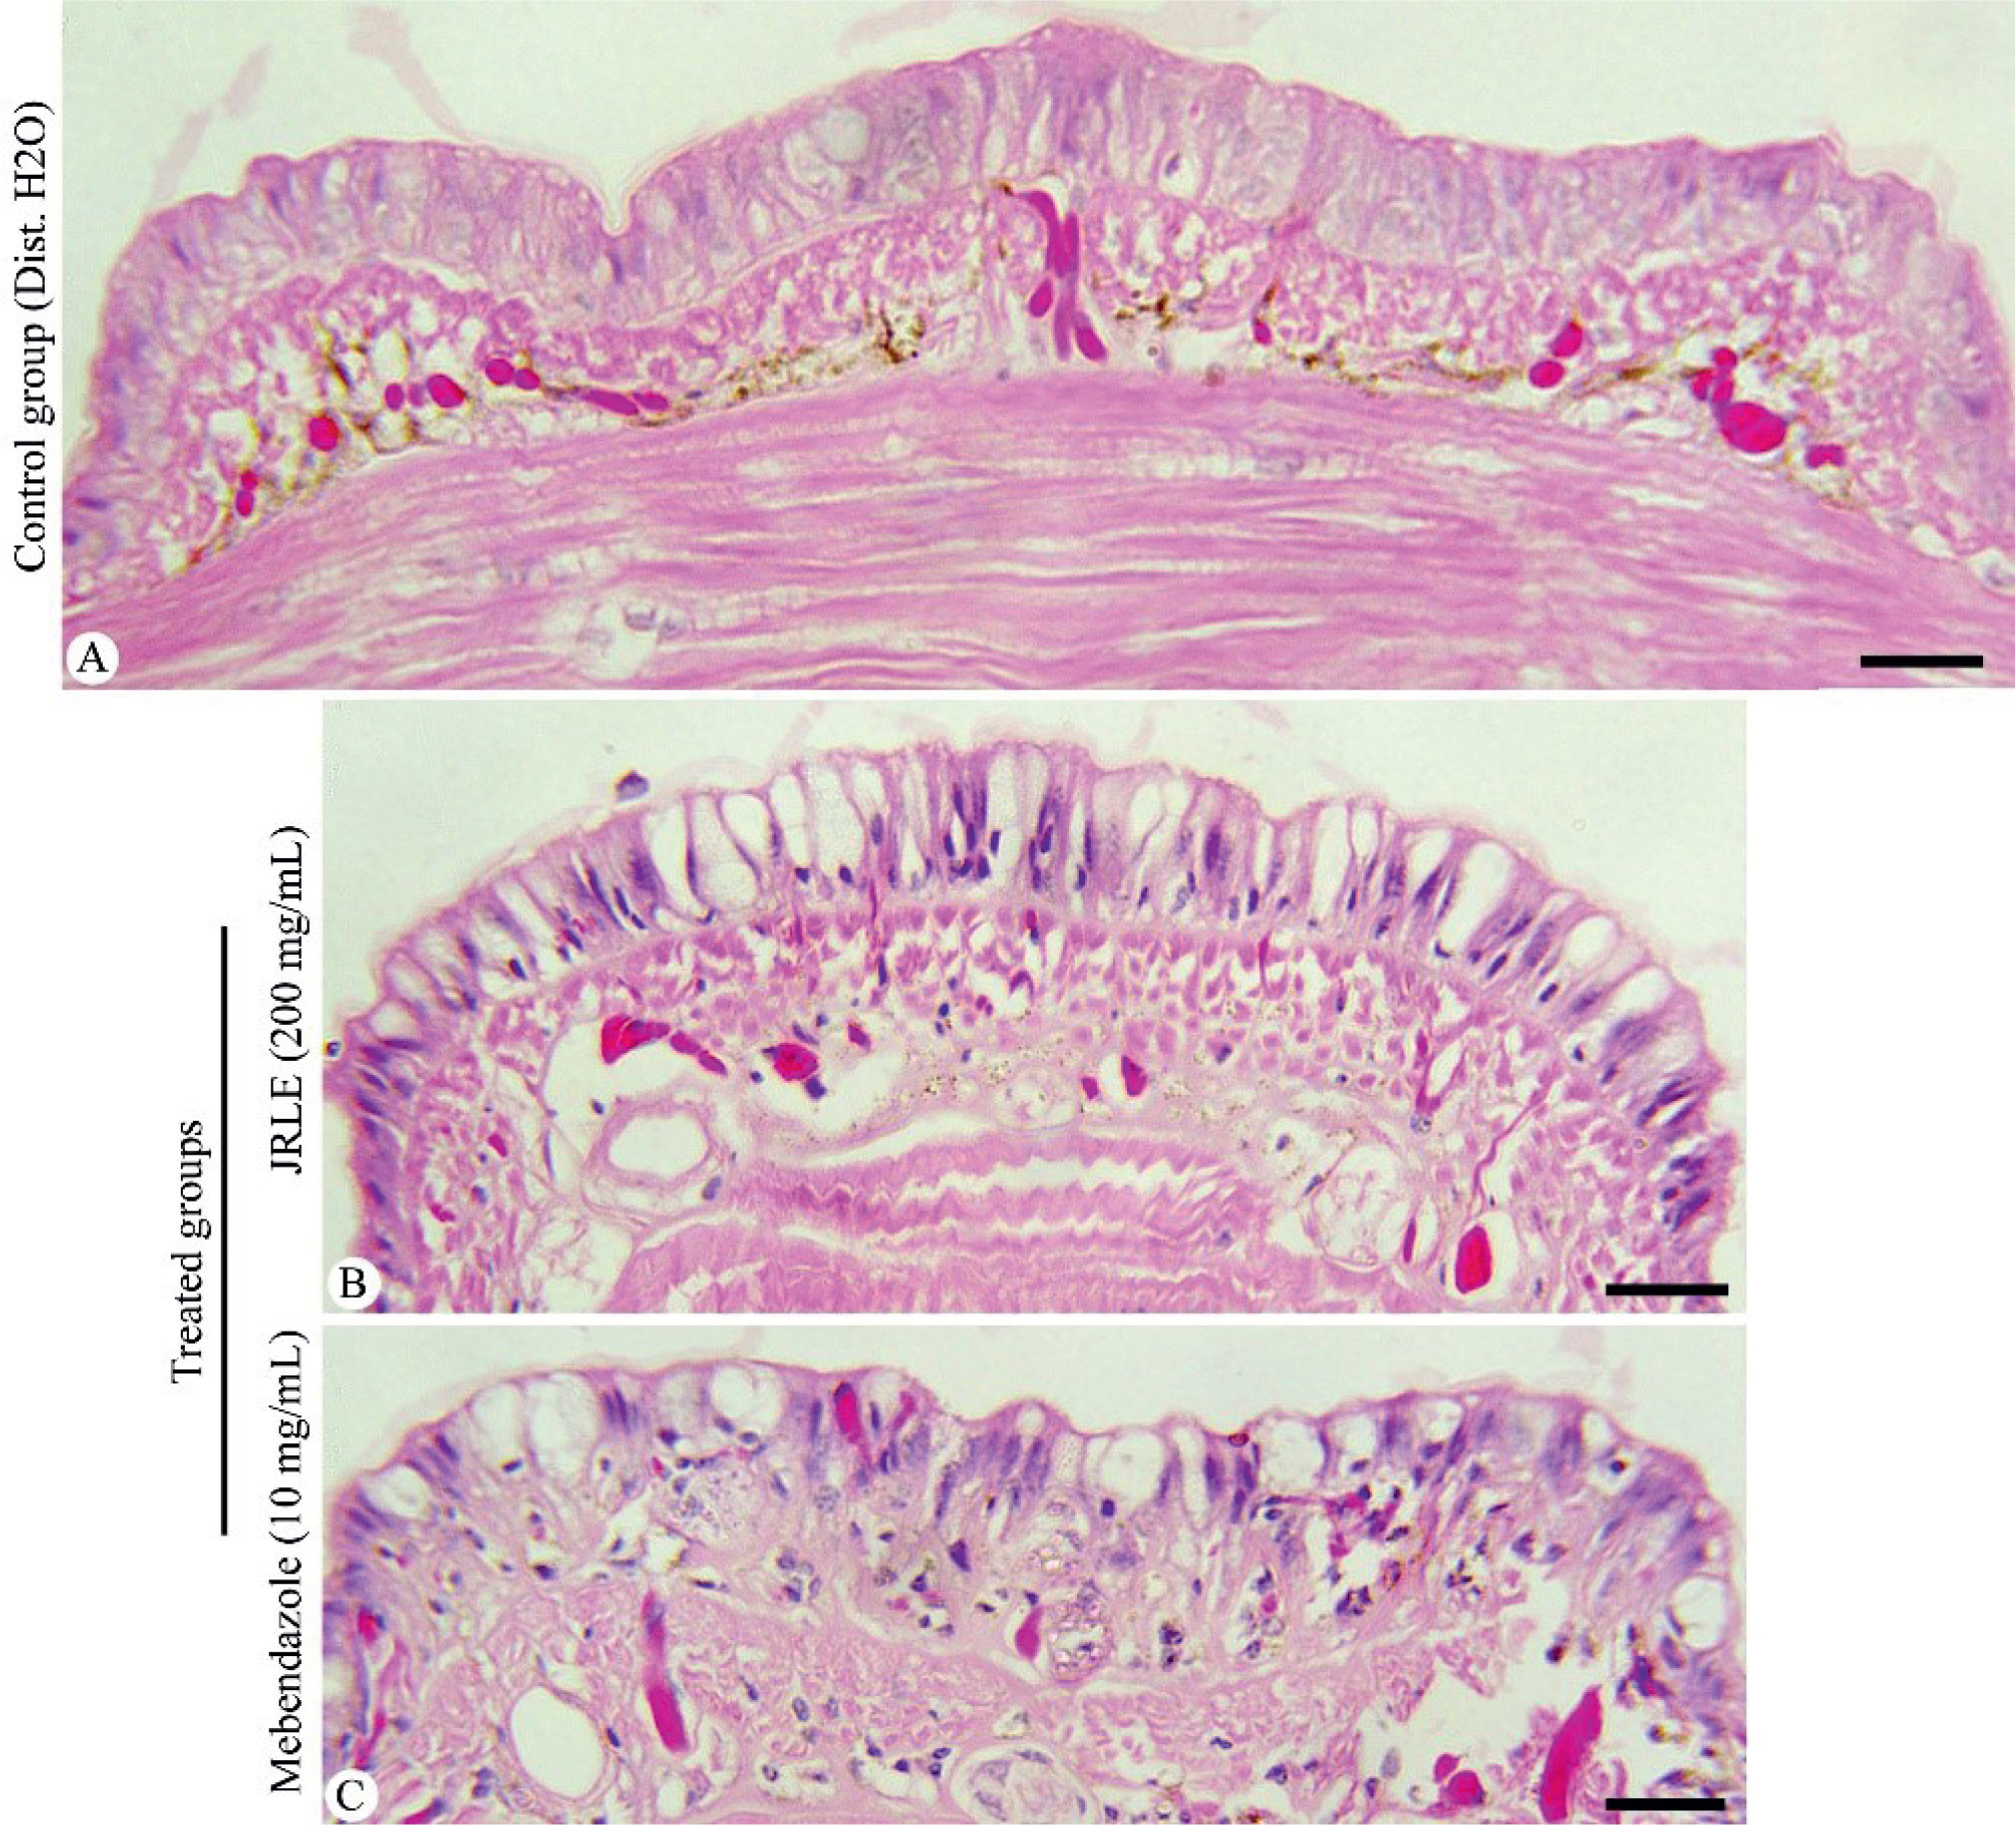
Fig. 4.
Histology of the cuticle of the earthworms, E. fetida, following various treatments. (A) The control group. (B) 200 mg/mL JRLE. (C) 10 mg/ml Mebendazole. Sections were stained with H&E. Scale bar = 10μm.
Table 1.
The docking scores and hydrogen bonds between the top ligands with different proteins.
| Compound name | PubChem Compound CID | Protein | Free energy of binding (Kcal/mol) | Residues involved in bonding | H-bonds distance (Å) | Number of bonds |
|---|---|---|---|---|---|---|
| Profilin | -6.440 | Lys72(2), Thr73, Thr75(2), Asp91 | 2.02,1.79,2.21,2.19,2.09,2.1 | 6H bonds | ||
| 3-O-Methyl-d-glucose | 8973 | L-lactate dehydrogenase | -7.582 | Asn127(2), Arg158, His182, Ser234, Pro235 | 1.67, 2.06, 1.79, 1.97, 1.94, 2.09 2.15, 2.01, 1.81, 1.89, 2.24, | 6H bonds |
| Pyridoxal 5’-phosphate synthase subunit | -9.103 | Asp27,Lys84, Gly156, Gly217, lie218, Phe238, Gly238 | 1.93,2.14 | 7H bonds | ||
| Profilin | -4.494 | Lys72, Asp91,Gly92 | 2.44,2.12,1.9 | 3H bonds | ||
| 4H-Pyran-4-one, 2,3-dihydro-3,5-dihydroxy-6-methyl- | 119838 | L-lactate dehydrogenase | -5.611 | Arg95+(S),His182,Arg158+(S) | 2.4,1.92,2.25 | 3H bonds +2 (S) |
| Pyridoxal 5’-phosphate synthase | -7.568 | Gly156, Gly217, Ser239 | 2.08,1.82,1.94 | 3H bonds | ||
| γ-Sitosterol | 457801 | - Cytochrome b | -8.392 | - Phe284 | 2.66 | IHbond |
| St¡gmasterol | 5280794 | -7.766 | 1.84 | IHbond | ||
| Heptanediamide, N,N’-dibenzoyloxy- | 569848 | Cytochrome c oxidase subunit 1 | -9.799 | Trp131(2), His248, His382, Arg446(2), Tyr250(P) | 1.82,2.47,2.21,1.98,2.06,2.71 | 6H Bond +1 (P) |
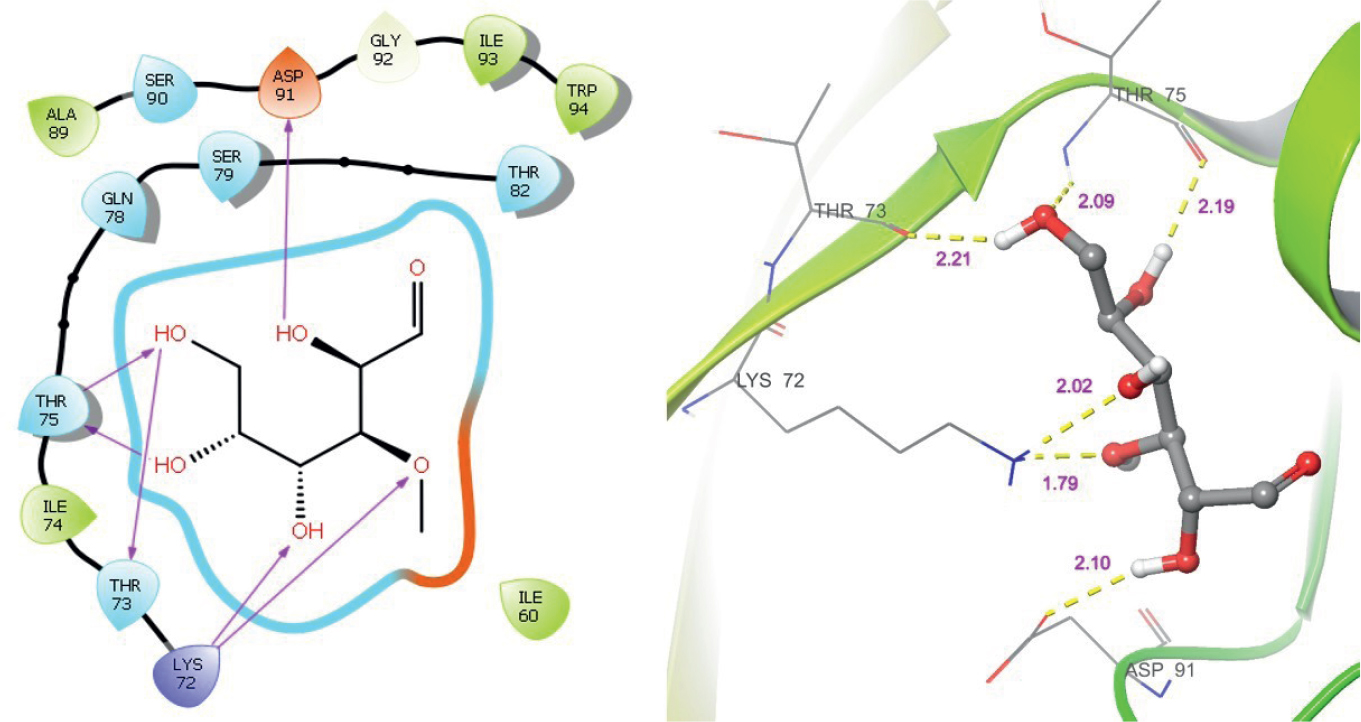
Fig. 5a.
The 2D and 3D interaction between Profilin and 3-O-Methyl-d-glucose. All hydrogen bonds are represented as yellow dashes, aromatic hydrogen bonds represented as cyan blue dashes, and pi-pi stacking represented as green dashes.
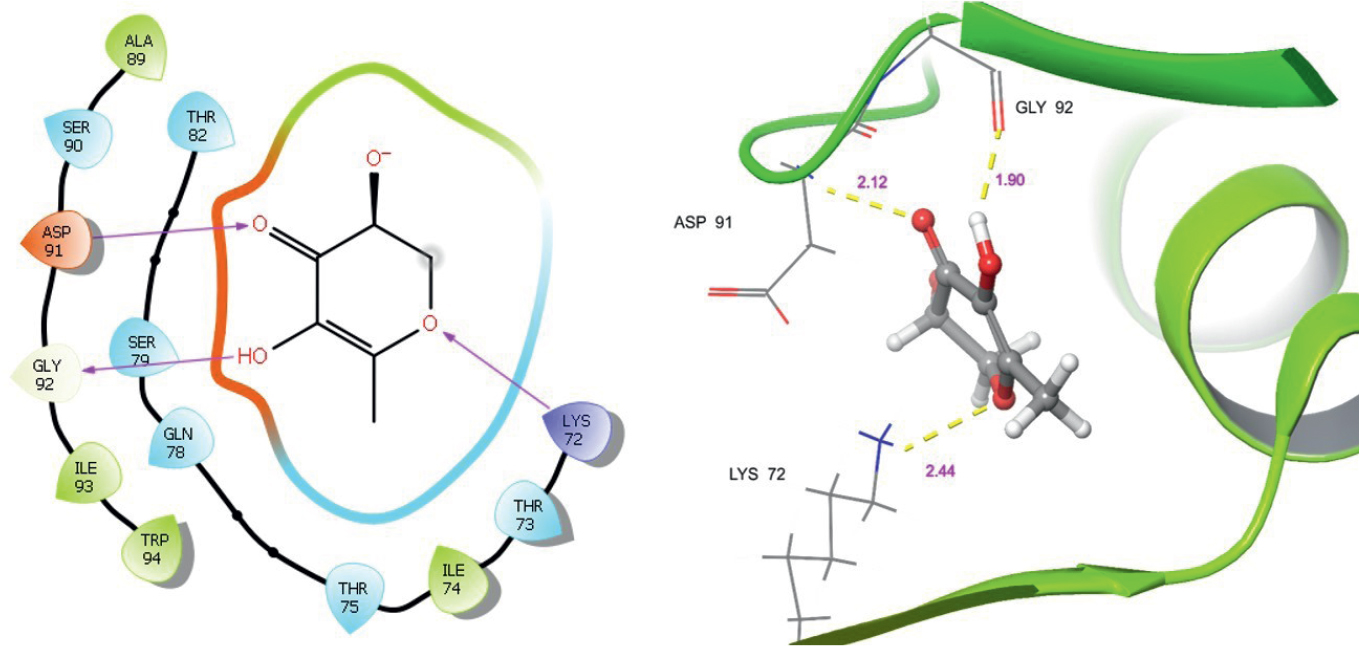
Fig. 5b.
The 2D and 3D interaction between Profilin and 4H-Pyran-4-one, 2,3-dihydro-3,5-dihydroxy-6-methyk All hydrogen bonds are represented as yellow dashes, aromatic hydrogen bonds represented as cyan blue dashes, and pi-pi stacking represented as green dashes.
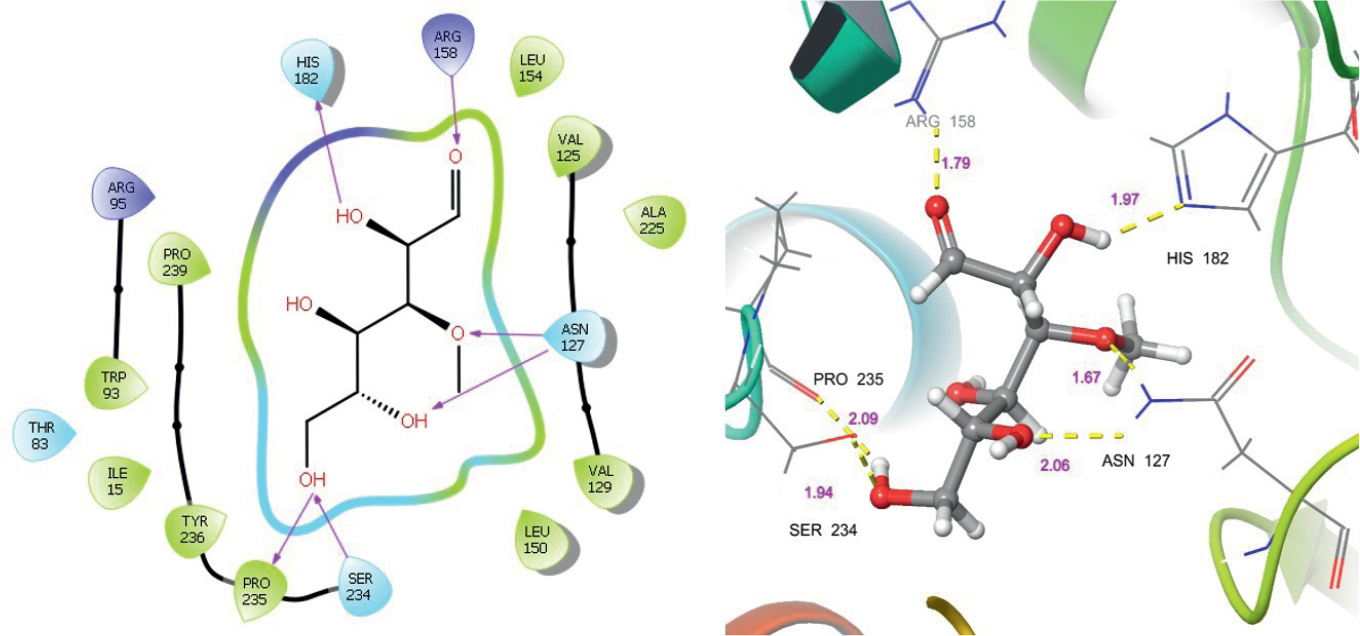
Fig. 5c.
The 2D and 3D interaction between L-lactate dehydrogenase and 3-O-Methyl-d-glucose. All hydrogen bonds are represented as yellow dashes, aromatic hydrogen bonds represented as cyan blue dashes, and pi-pi stacking represented as green dashes.
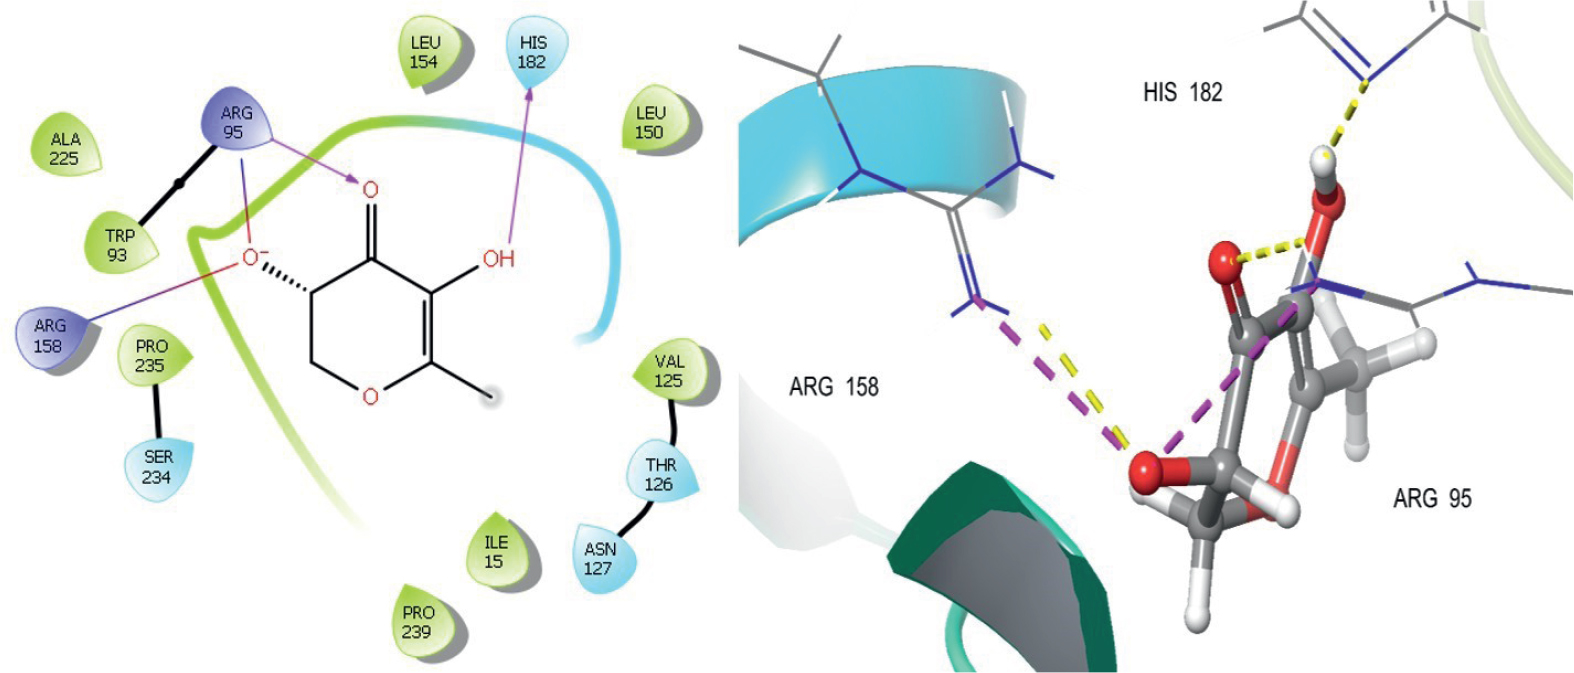
Fig. 5d.
The 2D and 3D interaction between L-lactate dehydrogenase and 4H-Pyran-4-one, 2,3-dihydro-3,5-dihydroxy-6-methyl-. All hydrogen bonds are represented as yellow dashes, aromatic hydrogen bonds represented as cyan blue dashes, and pi-pi stacking represented as green dashes.
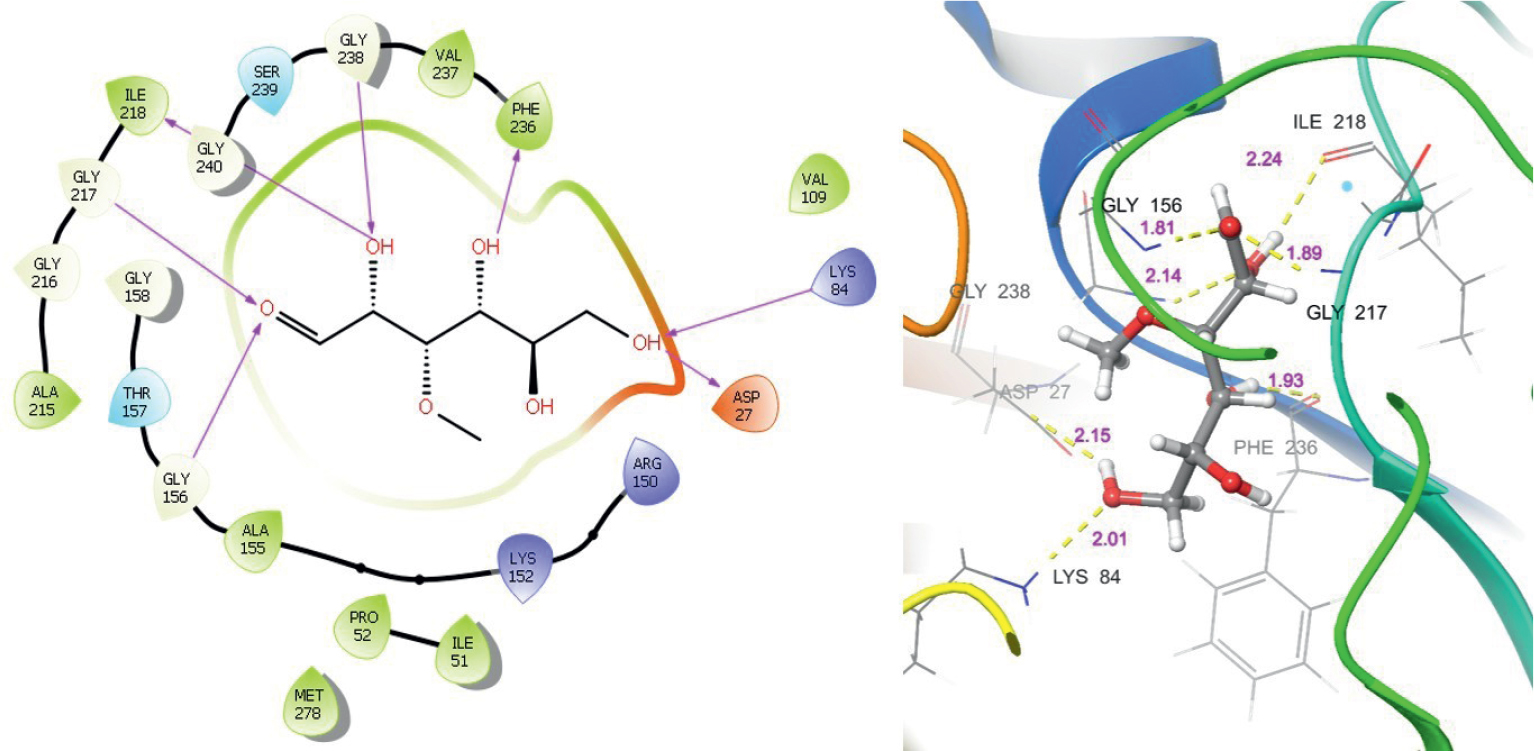
Fig. 5e.
The 2D and 3D interaction between Pyridoxal 5’-phosphate synthase and 3-O-Methyl-d-glucose. All hydrogen bonds are represented as yellow dashes, aromatic hydrogen bonds represented as cyan blue dashes, and pi-pi stacking represented as green dashes.
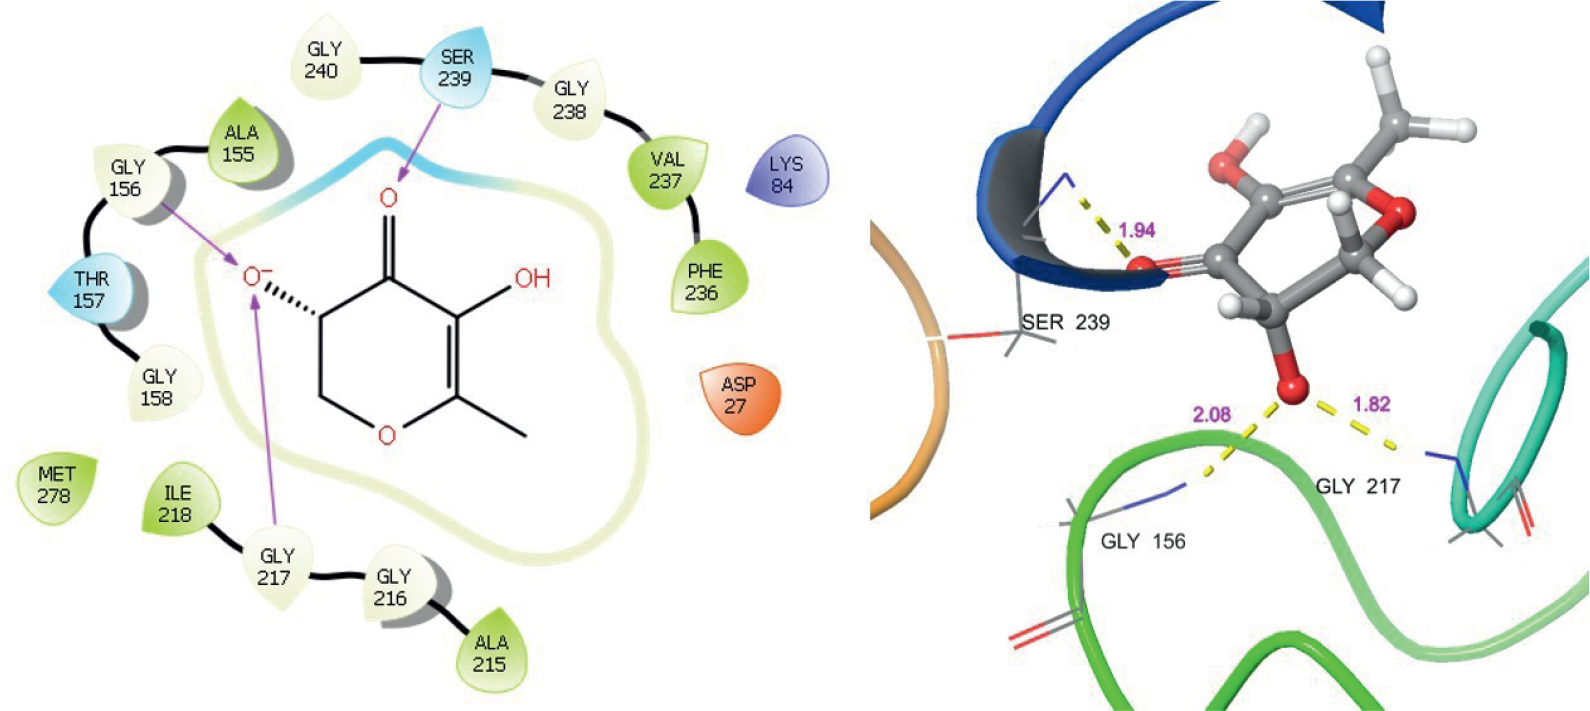
Fig. 5f.
The 2D and 3D interaction between Pyridoxal 5’-phosphate synthase and 4H-Pyran-4-one, 2,3-dihydro-3,5-dihydroxy-6-methyl-. All hydrogen bonds are represented as yellow dashes, aromatic hydrogen bonds represented as cyan blue dashes, and pi-pi stacking represented as green dashes.
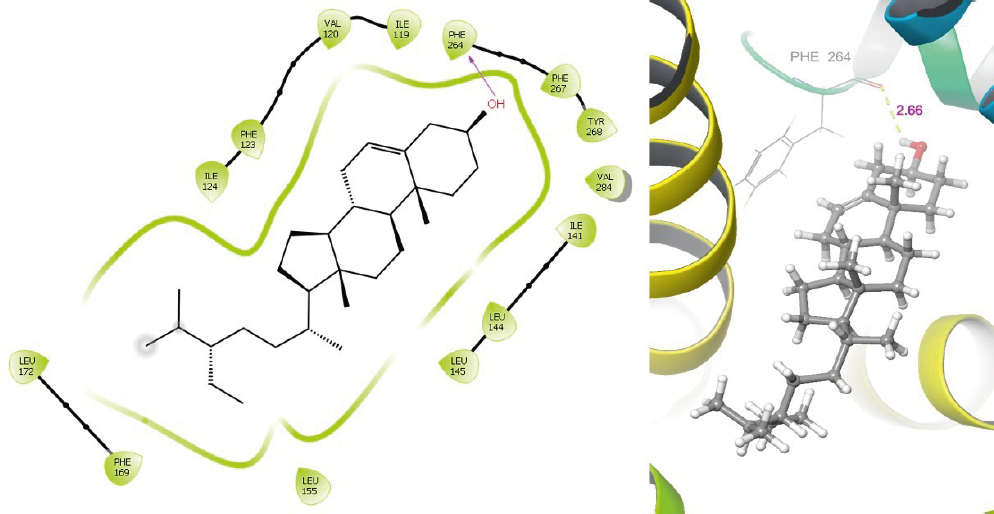
Fig. 5g.
The 2D and 3D interaction between Cytochrome b synthase and γ-Sitosterol. All hydrogen bonds are represented as yellow dashes, aromatic hydrogen bonds represented as cyan blue dashes, and pi-pi stacking represented as green dashes.
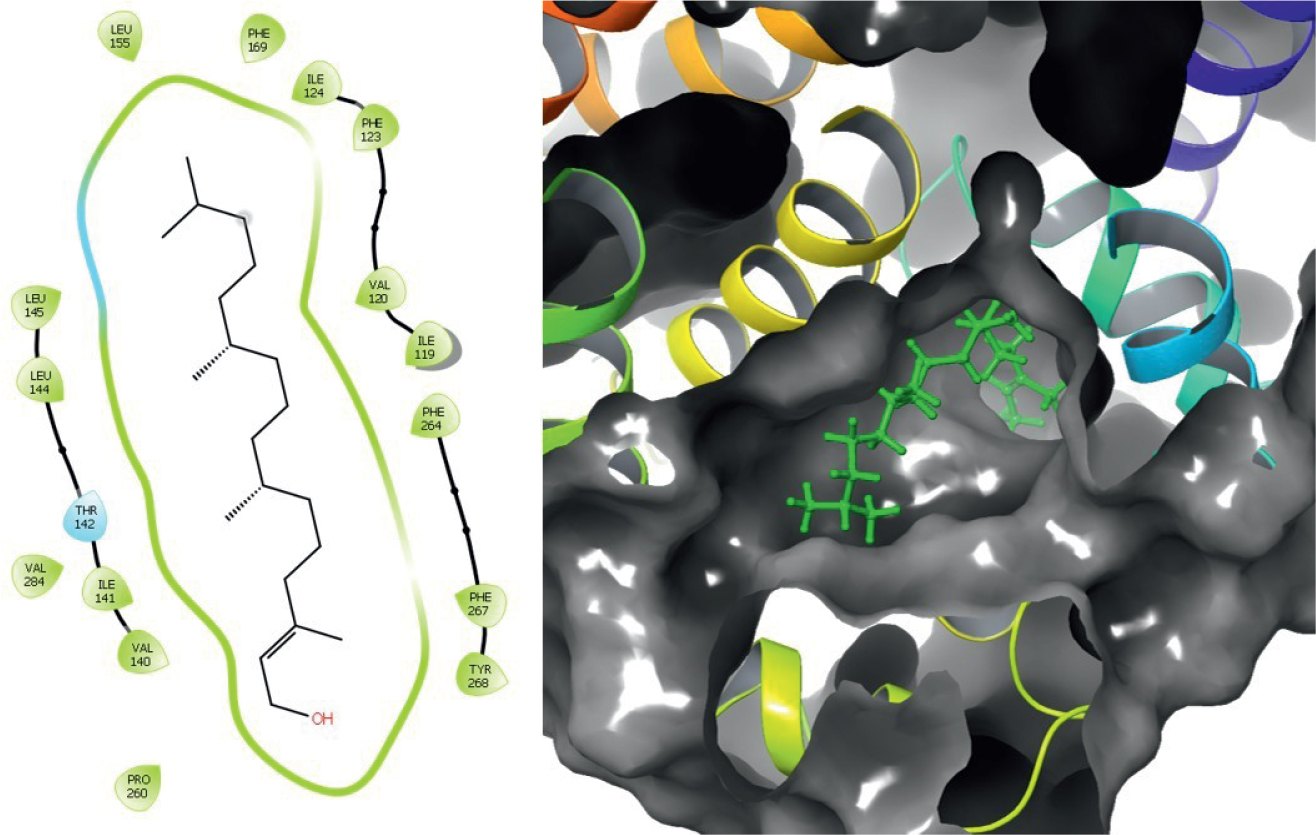
Fig. 5h.
The 2D and 3D interaction between Cytochrome b synthase and Stigmasterol. There is no interaction represented in 2D as the ligand has a good confirmation inside the receptor grid, which is reflected in a high docking score. All hydrogen bonds are represented as yellow dashes, aromatic hydrogen bonds represented as cyan blue dashes, and pi-pi stacking represented as green dashes.
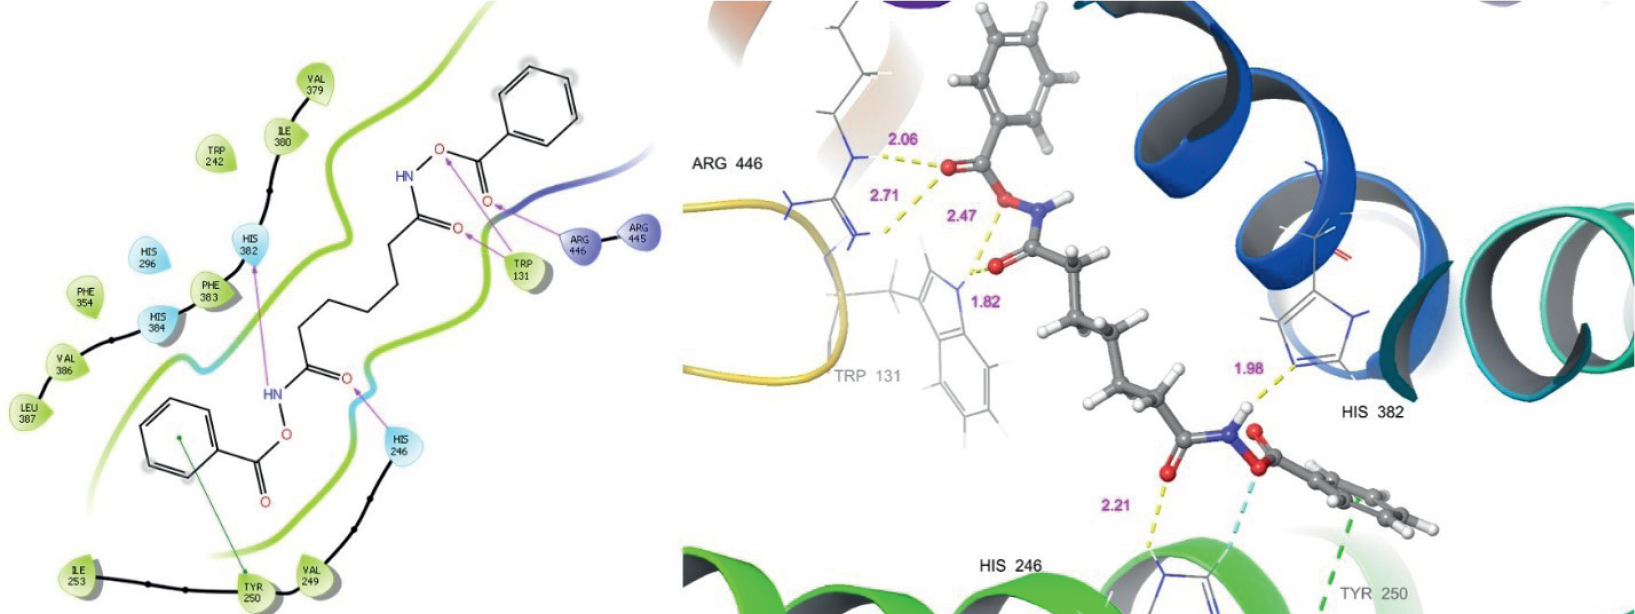
Fig. 5i.
The 2D and 3D interaction between Cytochrome c oxidase subunit and Heptanediamide, N,N’-di-benzoyloxy-. All hydrogen bonds are represented as yellow dashes, aromatic hydrogen bonds represented as cyan blue dashes, and pi-pi stacking represented as green dashes.