
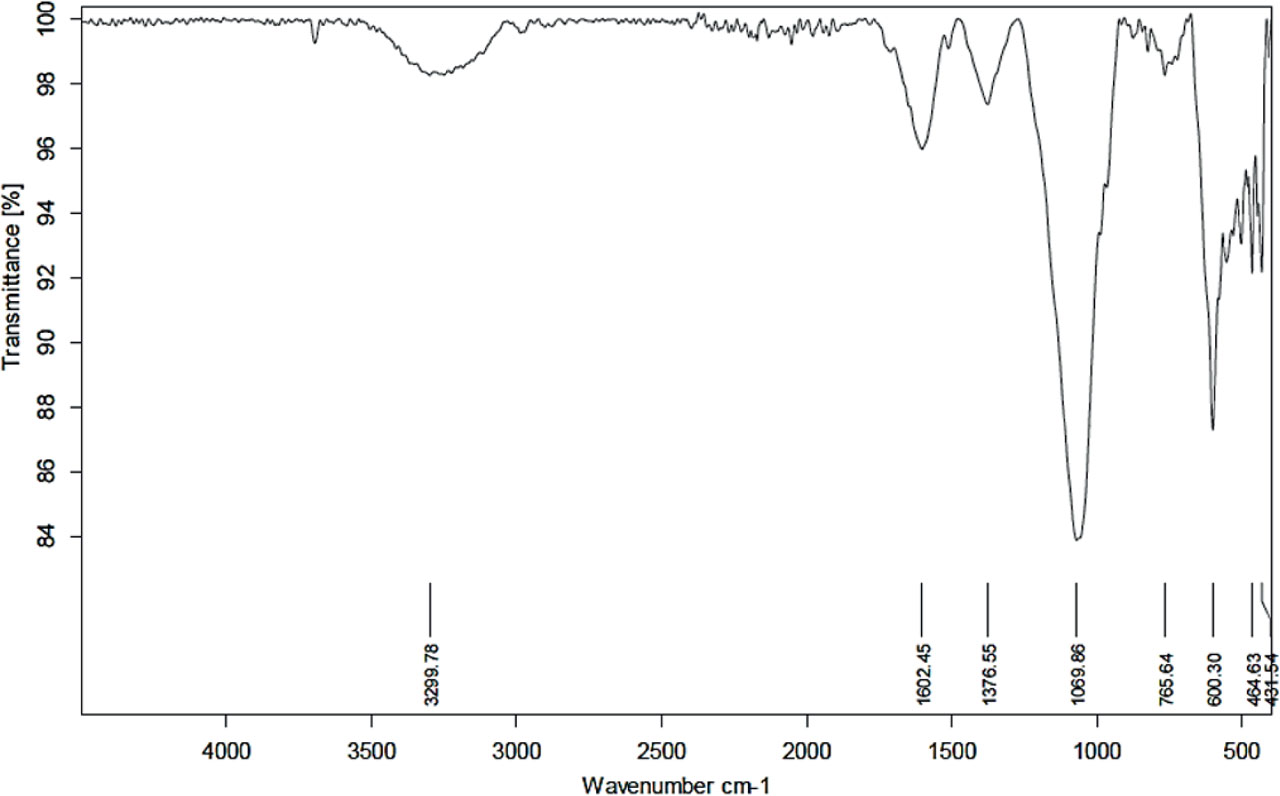
Fig. 1.
FTIR spectra of biosynthesis ZnO-NPs by Artemisia annua.
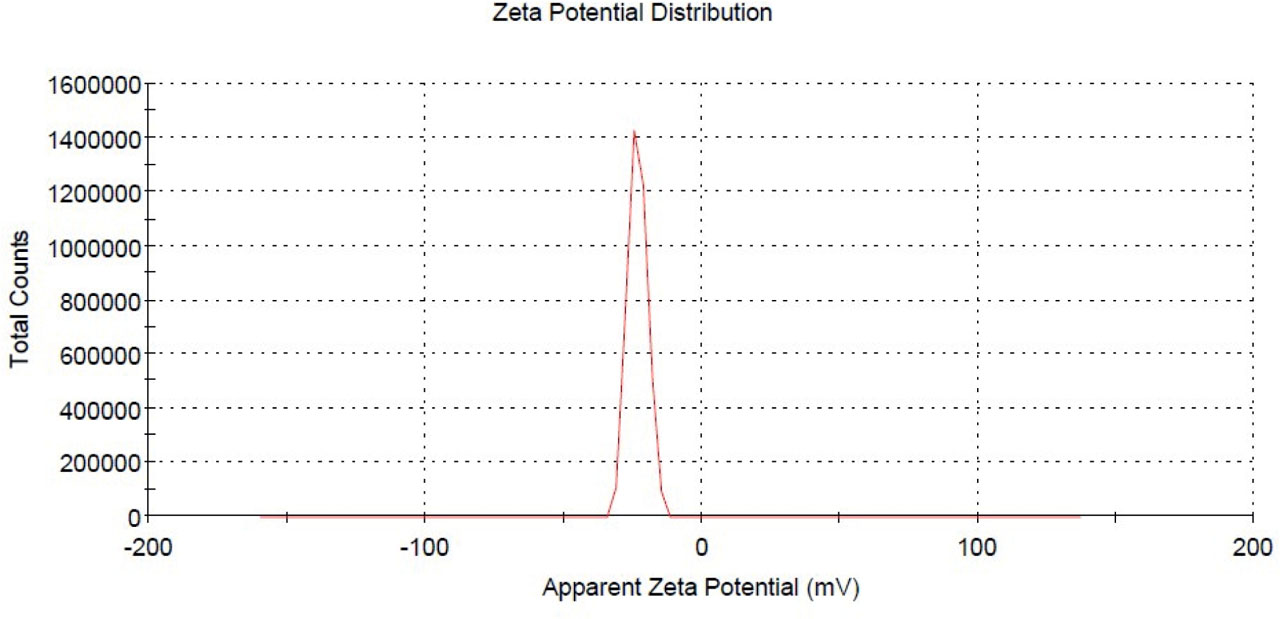
Fig. 2.
Zeta potential of biosynthesized ZnO-NPs by Artemisia annua.
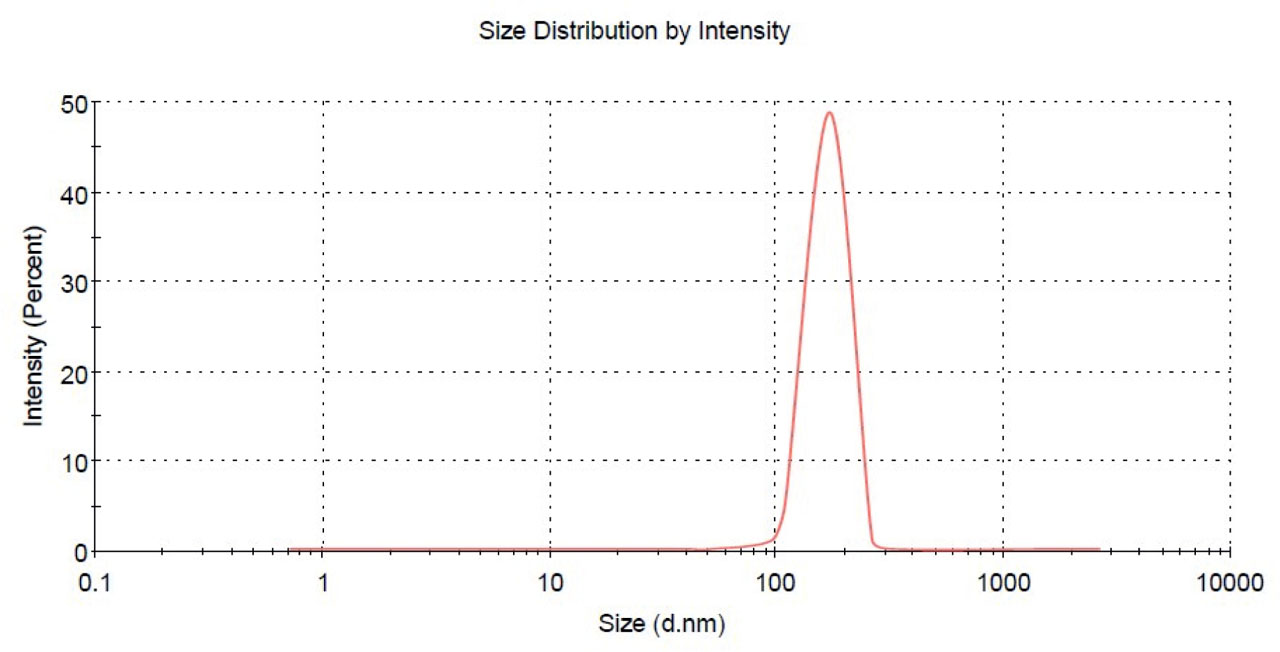
Fig. 3.
Dynamic light-scattering (DSL) of biosynthesized ZnO-NPs by Artemisia annua.
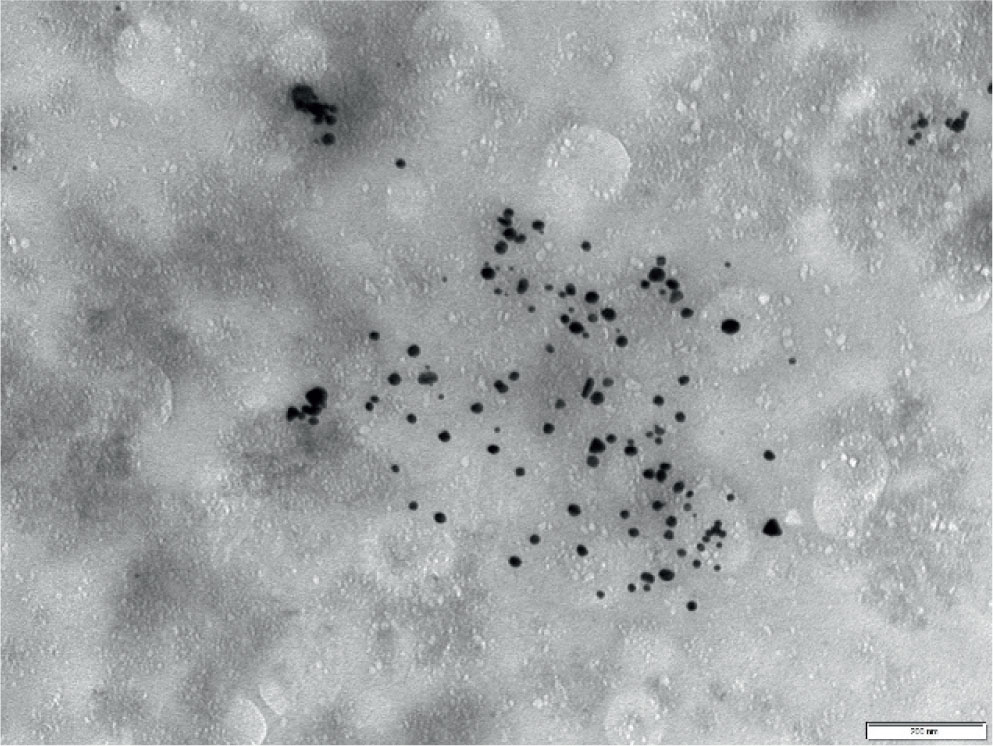
Fig. 4.
Transmission electron microscopy (TEM) of biosynthesized ZnO-NPs by Artemisia annua.
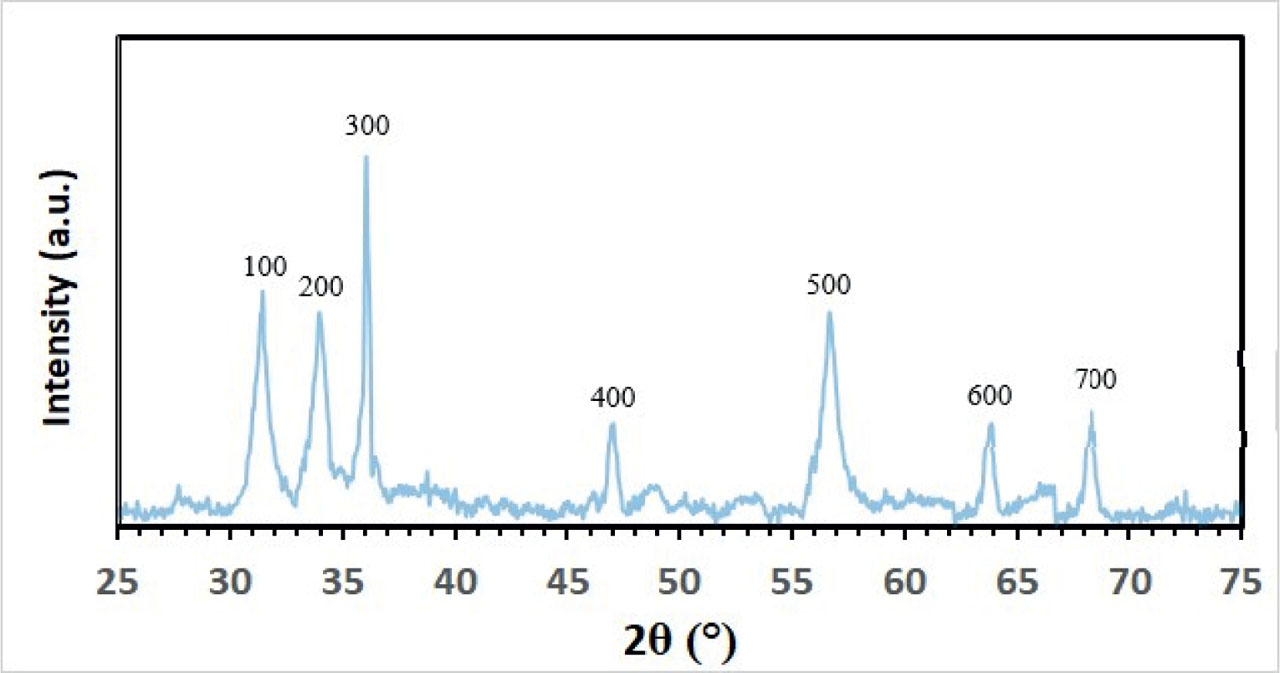
Fig. 5.
X-ray diffraction of biosynthesized ZnO-NPs by Artemisia annua.
Table 1.
Statistical analysis of the effectiveness of ZnO NPs synthesized by Artemisia annua and ZnO NPs plus PZQ with different concentration and incubation times on S. mansoni (male adult worms).
| Tested materials | Conc. (μg/ml) | Number of dead adult worms of S. mansoni male after incubation for 48 h | |||||
|---|---|---|---|---|---|---|---|
| 2 h | 4 h | 6 h | 12 h | 24 h | 48 h | ||
| Green zinc oxide NPs | 3.125 | 0 | 0.33 ± 0.47 | 0.66 ± 0.47 | 0.66 ± 0.47 | 2.66 ± 0.47 | 4.0 ± 0.81 |
| 6.25 | 0 | 0.33 ± 0.47 | 0.66 ± 0.47 | 1.66 ± 0.47 | 3.66 ± 0.47 | 5.0 ± 0.0 | |
| 12.5 | 0.66 ± 0.47 | 1.66 ± 0.47 | 3.0 ± 0.81 | 4.66 ± 0.47 | 7.0 ± 0.0 | 7.0 ± 0.0 | |
| 25 | 0.66 ± 0.47 | 3.33 ± 0.47 | 5.66 ± 0.47 | 7.0 ± 0.0 | 7.0 ± 0.0 | 7.0 ± 0.0 | |
| 50 | 1.33 ± 0.47 | 3.66 ± 0.47 | 6.66 ± 0.47 | 7.0 ± 0.0 | 7.0 ± 0.0 | 7.0 ± 0.0 | |
| 100 | 1.33 ± 0.47 | 3.66 ± 0.47 | 7.0 ± 0.0 | 7.0 ± 0.0 | 7.0 ± 0.0 | 7.0 ± 0.0 | |
| Green zinc oxide NPs + PZQ | 12.5+0.4 | 2 ± 0.81 | 3.66 ± 0.47 | 5.66 ± 0.47 | 7.0 ± 0.0 | 7.0 ± 0.0 | 7.0 ± 0.0 |
| 25+0.3 | 3.0 ± 0.81 | 6.33 ± 0.47 | 7.0 ± 0.0 | 7.0 ± 0.0 | 7.0 ± 0.0 | 7.0 ± 0.0 | |
| 50+0.2 | 3.66 ± 0.47 | 7.0 ± 0.0 | 7.0 ± 0.0 | 7.0 ± 0.0 | 7.0 ± 0.0 | 7.0 ± 0.0 | |
| 75+0.1 | 3.33 ± 0.47 | 6.66 ± 0.47 | 7.0 ± 0.0 | 7.0 ± 0.0 | 7.0 ± 0.0 | 7.0 ± 0.0 | |
| PZQ | 0.5 μg/ml | 6.66 ± 0.47 | 7.0 ± 0.0 | 7.0 ± 0.0 | 7.0 ± 0.0 | 7.0 ± 0.0 | 7.0 ± 0.0 |
Table 2.
Statistical analysis of the effectiveness of ZnO NPs synthesized by Artemisia annua and ZnO NPs plus PZQ with different concentration and incubation times on S. mansoni (female adult worms).
| Tested materials | Conc. (μg/ml) | Number of dead adult worms of S. mansoni female after incubation for 48 h | |||||
|---|---|---|---|---|---|---|---|
| 2 h | 4 h | 6 h | 12 h | 24 h | 48 h | ||
| Green ZnONPs | 3.125 | 0 | 0.33 ± 0.47 | 0.66 ± 0.47 | 1.0 ± 0.81 | 2.33 ± 0.94 | 3.33 ± 0.94 |
| 6.25 | 0 | 0.33 ± 0.47 | 0.66 ± 0.47 | 1.33 ± 0.47 | 3.66 ± 0.47 | 5.33 ± 0.47 | |
| 12.5 | 0.33 ± 0.47 | 2.0 ± 0.81 | 4.0 ± 0.81 | 4.33 ± 0.47 | 7.0 ± 0.0 | 7.0 ± 0.0 | |
| 25 | 1.0 ± 0.47 | 3.33 ± 0.47 | 5.66 ± 0.47 | 7.0 ± 0.0 | 7.0 ± 0.0 | 7.0 ± 0.0 | |
| 50 | 1.0 ± 0.81 | 3.66 ± 0.47 | 6.66 ± 0.47 | 7.0 ± 0.0 | 7.0 ± 0.0 | 7.0 ± 0.0 | |
| 100 | 1.33 ± 0.47 | 3.66 ± 0.47 | 7.0 ± 0.0 | 7.0 ± 0.0 | 7.0 ± 0.0 | 7.0 ± 0.0 | |
| Green ZnONPs + PZQ | 12.5+0.4 | 2.0 ± 0.81 | 3.33 ± 0.47 | 5.66 ± 0.47 | 7.0 ± 0.0 | 7.0 ± 0.0 | 7.0 ± 0.0 |
| 25+0.3 | 3.33 ± 0.47 | 6.66 ± 0.47 | 7.0 ± 0.0 | 7.0 ± 0.0 | 7.0 ± 0.0 | 7.0 ± 0.0 | |
| 50+0.2 | 4.0 ± 0.81 | 7.0 ± 0.0 | 7.0 ± 0.0 | 7.0 ± 0.0 | 7.0 ± 0.0 | 7.0 ± 0.0 | |
| 75+0.1 | 6.66 ± 0.47 | 7.0 ± 0.0 | 7.0 ± 0.0 | 7.0 ± 0.0 | 7.0 ± 0.0 | 7.0 ± 0.0 | |
| PZQ | 0.5 μg/ml | 6.66 ± 0.47 | 7.0 ± 0.0 | 7.0 ± 0.0 | 7.0 ± 0.0 | 7.0 ± 0.0 | 7.0 ± 0.0 |
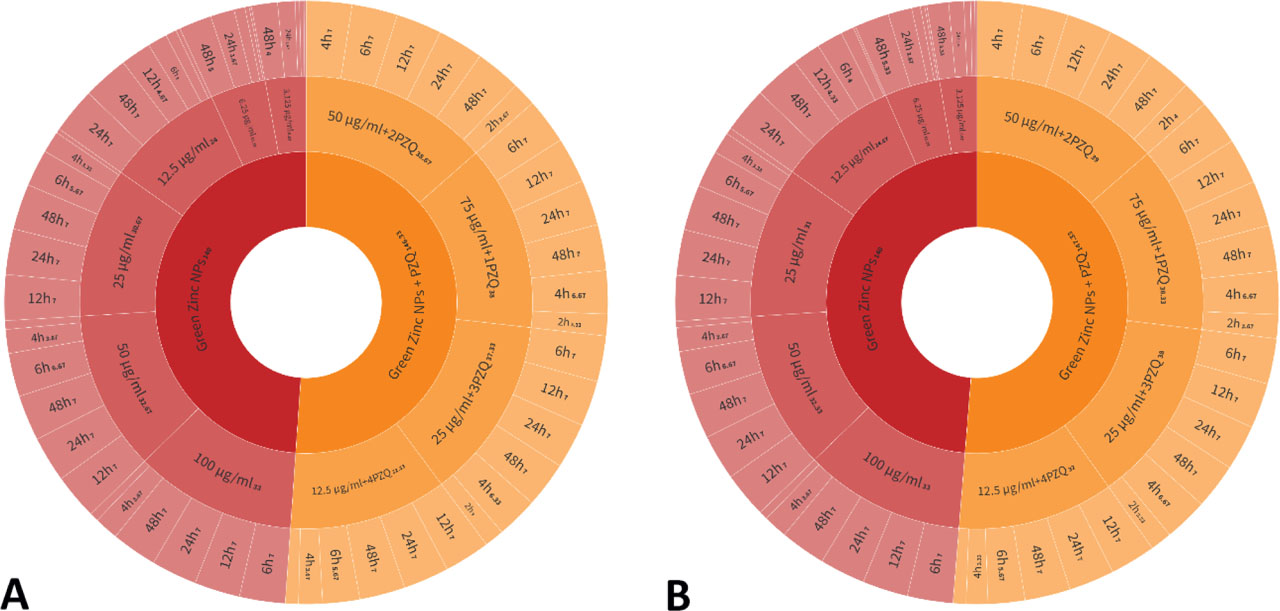
Fig. 6.
Statistical analysis of the effectiveness of ZnO NPs synthesized by Artemisia annua and ZnO NPs plus PZQ with different concentrations and duration times on S. mansoni (adult worms) (A) Male and (B) Female.
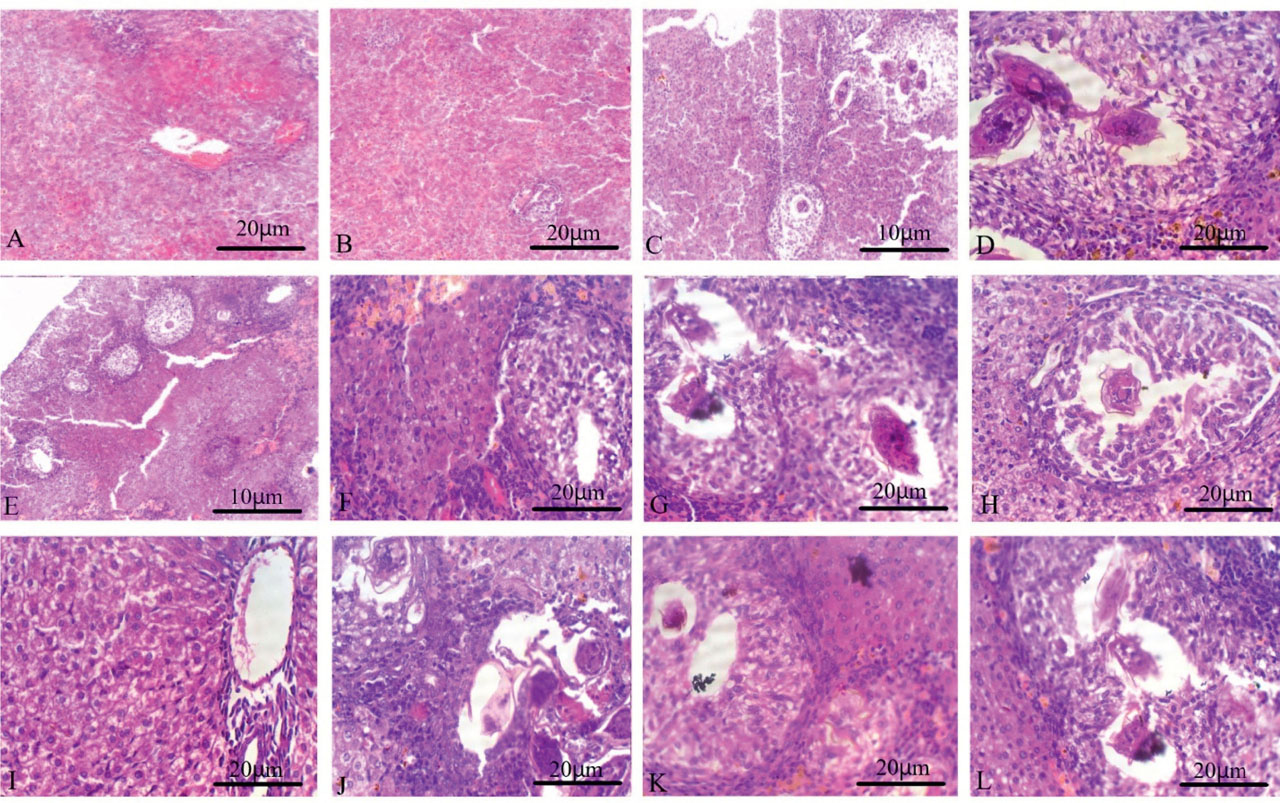
Fig. 7.
Light microscopy of liver sections from golden hamsters. (A, B) Show a normal (uninfected) liver section. (C, D) Depict a liver section infected with S. mansoni (untreated), characterized by numerous fibrocellular granulomas. (E-H) Illustrate an infected liver section treated with green ZnONPs, revealing fibrocellular granulomas with miracidia inside the eggs scattered throughout the hepatic parenchyma. There is a marked reduction in both the number and size of granulomas, improved liver structure, egg destruction, and the presence of empty granulomas. The granulomas are irregularly shaped and contain less fibrous material. (I-L) Present an infected liver section treated with green ZnONPs combined with PZQ, showing a significant decrease in granuloma number and size, enhanced liver architecture, egg destruction, and empty granulomas. The granulomas maintain an irregular shape with diminished fibrous content.
Table 3.
The mean count and size of granuloma of animal liver in untreated control group comparison to treated group.
| Groups of animal | Diameter of granuloma (mean±SE) | Reduction of granuloma size % | Granuloma Count (mean±SE) | Reduction of count % |
|---|---|---|---|---|
| infected control | 345.30±21.18 | ------- | 17.5±4.23 | ------- |
| Positive control | 171.45±35.21 | 50.3 | 6.99±4.89 | 60.1 |
| ZnO NPs | 191.43±23.45 | 44.6 | 8.65±3.46 | 50.6 |
| ZnO NPs + PZQ | 117.19±24.18 | 66.1 | 4.34±4.33 | 75.2 |
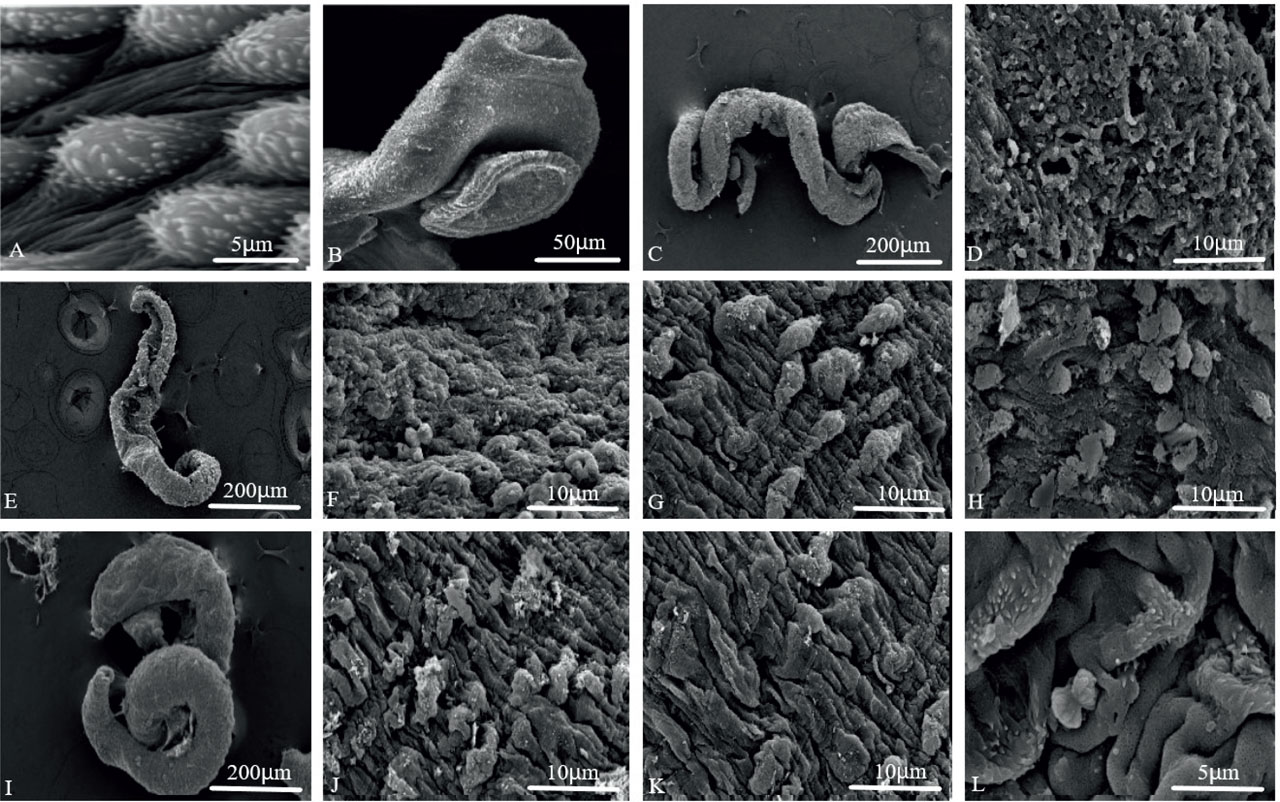
Fig. 8.
SEM photomicrograph of S. mansoni: (A and B) untreated worms (A) normal body architecture with numerous tubercles supported with an acute spine, (B) normal oral sucker (oval) and rounded ventral sucker. (C and D) treated group with PZQ (C) severe damage of body, (D) tubercles deformation and spine decay (E, F, G, H) treated group with biosynthesized ZnO nanoparticles (E) complete destruction of gynaecophoric channel, (F) peeling and destruction of the tegument (G, H) abnormalities appeared in the tubercles and destruction of the spines, (I, J, K, L) treated group with ZnONPs plus PZQ (I) Complete destruction and contracile of the worm's body (J, K) completely destroyed of tegument (peeling of tubercles, tegument sloughing, devastation spines) (L) wrinkles and bubbles appeared on damage tegument.