
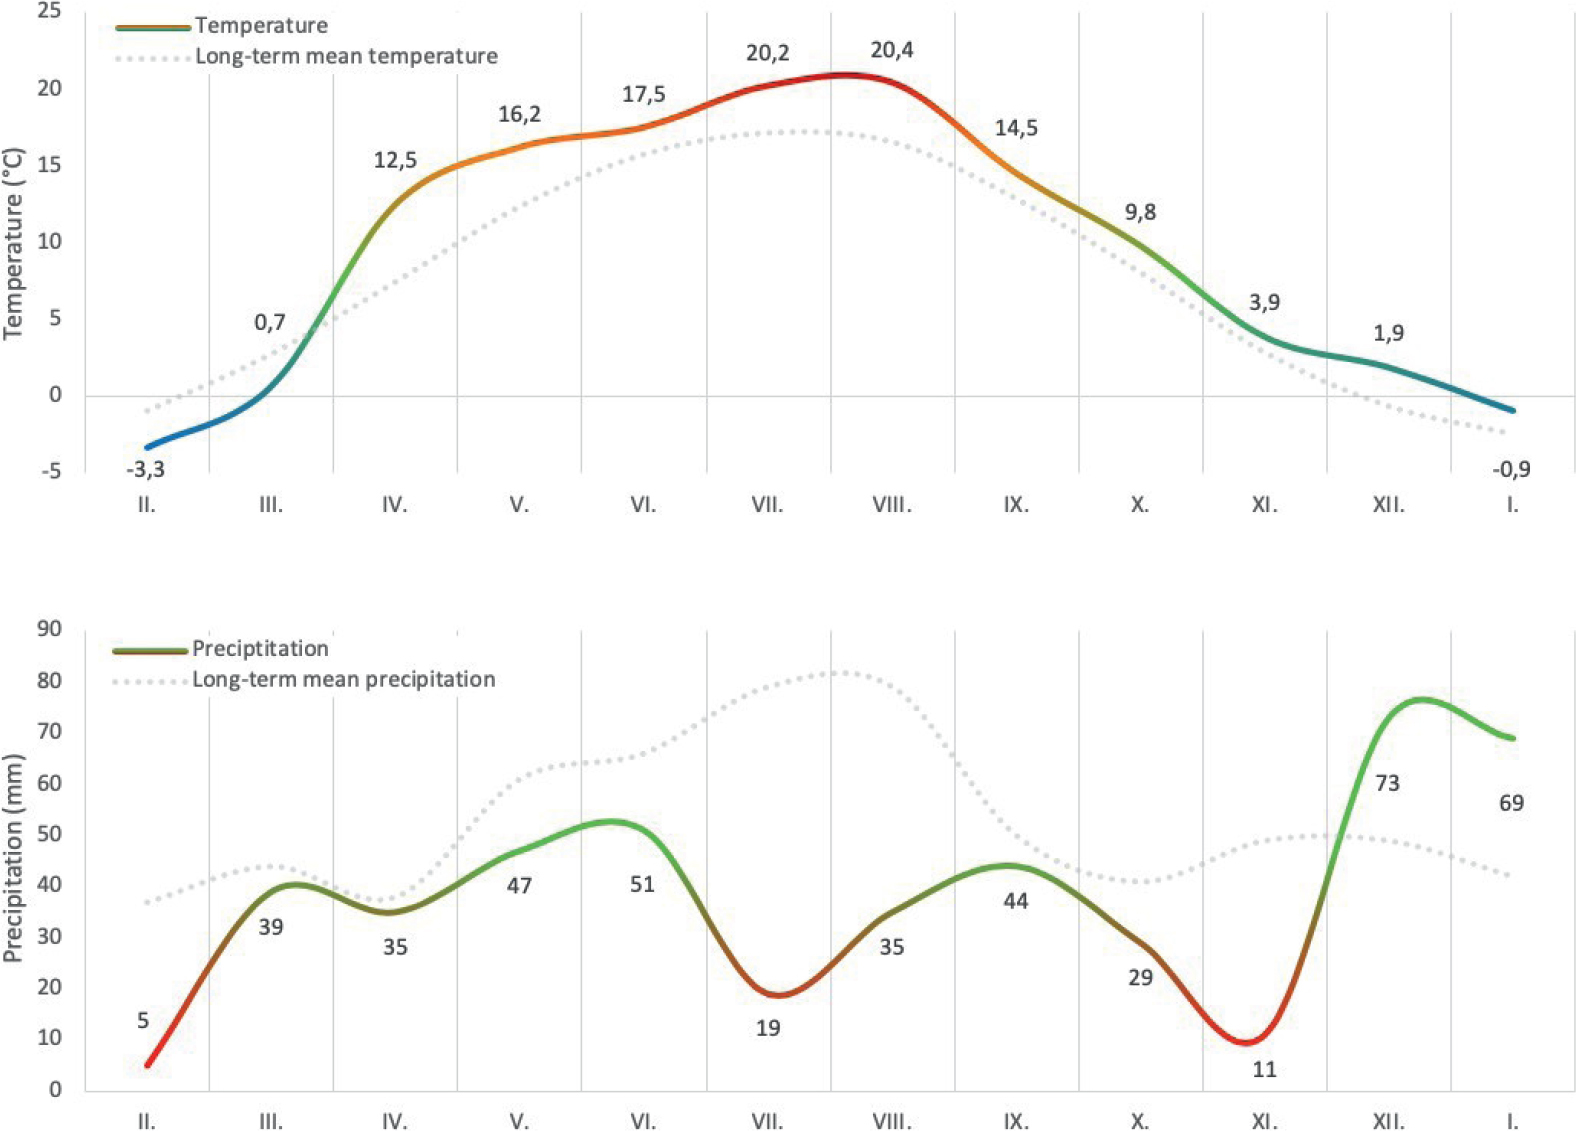
Fig. 1.
Average monthly temperature (°C) and precipitation (mm) recorded during the 12-month monitoring period. Data were obtained from a nearby meteorological station and reflect typical temperate climate conditions of the study area. Seasonal variation in temperature and rainfall may influence parasite development and transmission.
Table 1.
Monthly milk production and composition in monitored goats and sheep during the lactation period. Values include milk yield (kg/day) and percentages of fat, protein, and lactose. Data were collected as part of the official milk recording system in the Czech Republic. Results represent the average performance of the sampled animals over five (goats) or four (sheep) monthly recordings.
| Goats - monitoring performance check results | ||||
|---|---|---|---|---|
| milk (kg) | fat (%) | protein (%) | lactose (%) | |
| III. | 2.9 | 4.00 | 3.15 | 4.56 |
| IV. | 3.0 | 2.69 | 2.72 | 4.18 |
| V. | 3.1 | 2.80 | 2.95 | 4.32 |
| VI. | 3.3 | 2.70 | 2.96 | 4.52 |
| VII. | 2.9 | 2.93 | 3.01 | 4.32 |
| mean | mean | mean | mean | |
| Sheep - monitoring performance check results | ||||
|---|---|---|---|---|
| milk (kg) | fat (%) | protein (%) | lactose (%) | |
| III. | 1.5 | 7.61 | 5.39 | 4.83 |
| IV. | 2.0 | 5.62 | 5.64 | 4.70 |
| V. | 1.3 | 7.03 | 6.03 | 4.72 |
| VI. | 1.4 | 7.27 | 6.42 | 4.68 |
| mean | mean | mean | mean | |
Table 2.
Summary of faecal egg counts (EPG), prevalence, and number of samples analysed in sheep and goats throughout the 12-month monitoring period. EPG values reflect the intensity of trichostrongylid infection, while prevalence indicates the proportion of positive samples per species. The table also includes the total number of samples obtained, accounting for minor occasional sampling losses due to technical limitations.
| Trichostrongylids - sheep | ||||||||
|---|---|---|---|---|---|---|---|---|
| prevalence (%) | median | mean | geomean | CI (%) | SD | pooled samp. (EPG) | min. EPG | max. EPG |
| 100 | 1780 | 1747 | 1648 | 1477 – 2017 | 543 | 1340 | 720 | 2520 |
| 75 | 1120 | 990 | 1254 | 669 – 1311 | 687 | 300 | 0 | 1980 |
| 40 | 0 | 457 | 1103 | 175 – 739 | 602 | 180 | 0 | 1520 |
| 86 | 140 | 1087 | 326 | 96 – 2078 | 1717 | 460 | 0 | 5040 |
| 60 | 100 | 627 | 501 | 60 – 1193 | 1023 | 0 | 0 | 3640 |
| 80 | 500 | 856 | 472 | 305 – 1407 | 996 | 0 | 0 | 2600 |
| 93 | 280 | 692 | 314 | 170 – 1214 | 943 | 120 | 0 | 3540 |
| 94 | 530 | 607 | 1533 | 385 – 829 | 446 | 0 | 0 | 1520 |
| 80 | 20 | 375 | 107 | 0 – 872 | 899 | 140 | 0 | 3520 |
| 79 | 40 | 189 | 85 | 0 – 396 | 360 | 0 | 0 | 1260 |
| 93 | 700 | 804 | 643 | 459 – 1149 | 623 | 520 | 0 | 2140 |
| 94 | 1760 | 1639 | 1202 | 1007 – 2270 | 1228 | 580 | 0 | 3900 |
| Trichostrongylids - goats | ||||||||
|---|---|---|---|---|---|---|---|---|
| prevalence (%) | median | mean | geomean | CI (%) | SD | pooled samp. (EPG) | min. EPG | max. EPG |
| 90 | 180 | 316 | 214 | 166 – 466 | 319 | 680 | 0 | 1140 |
| 100 | 510 | 910 | 478 | 341 – 1479 | 1145 | 400 | 20 | 4380 |
| 100 | 900 | 1222 | 721 | 692 – 1752 | 1100 | 2720 | 80 | 3500 |
| 100 | 3500 | 4254 | 2813 | 2526 – 5981 | 3584 | 520 | 120 | 13740 |
| 100 | 5090 | 6555 | 4144 | 3775 – 9336 | 5591 | 540 | 340 | 20980 |
| 89 | 2160 | 2788 | 1992 | 1427 – 4148 | 2736 | 160 | 0 | 10220 |
| 100 | 940 | 1760 | 933 | 803 – 2717 | 1924 | 120 | 40 | 7380 |
| 100 | 730 | 1292 | 716 | 581 – 2003 | 1430 | 100 | 20 | 5500 |
| 100 | 560 | 734 | 428 | 336 – 1132 | 774 | 240 | 80 | 2840 |
| 94 | 160 | 531 | 325 | 228 – 834 | 589 | 480 | 0 | 1880 |
| 92 | 100 | 138 | 111 | 63 – 214 | 119 | 320 | 0 | 380 |
| 88 | 260 | 239 | 194 | 143 – 335 | 180 | 340 | 0 | 540 |
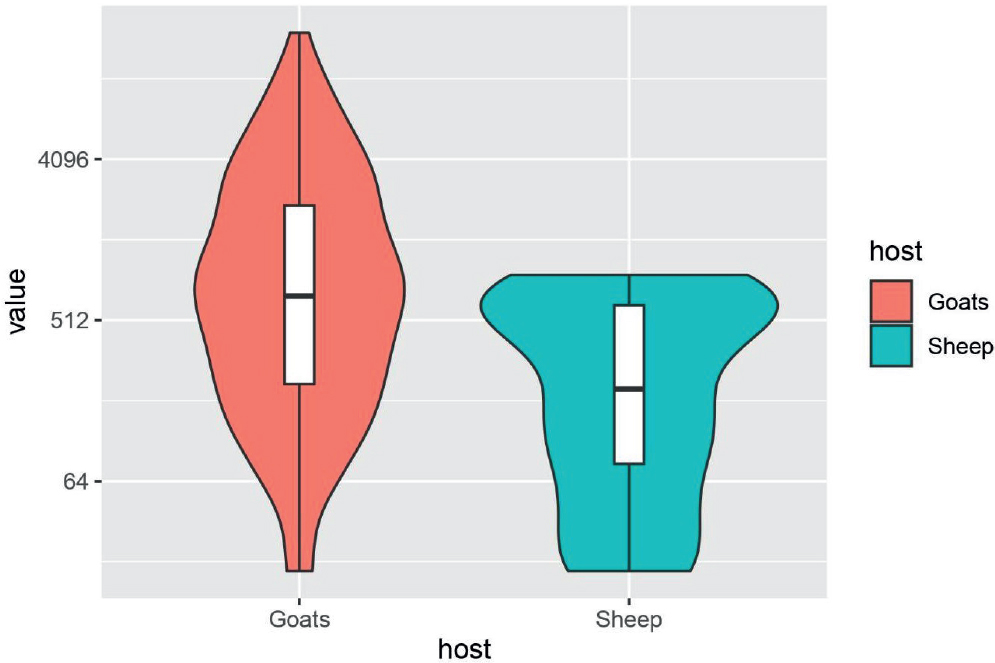
Fig. 2
Comparison of strongylid nematode infection in sheep and goats. Data are expressed as eggs per gram of faeces (EPG) and were log-transformed for visualization. Violin plot displays the distribution, median (white dot), interquartile range (thick bar), and density. Higher median and variability were observed in goats. Differences between species were statistically evaluated using the Mann-Whitney U test (U = 24,697.5, p < 0.001).
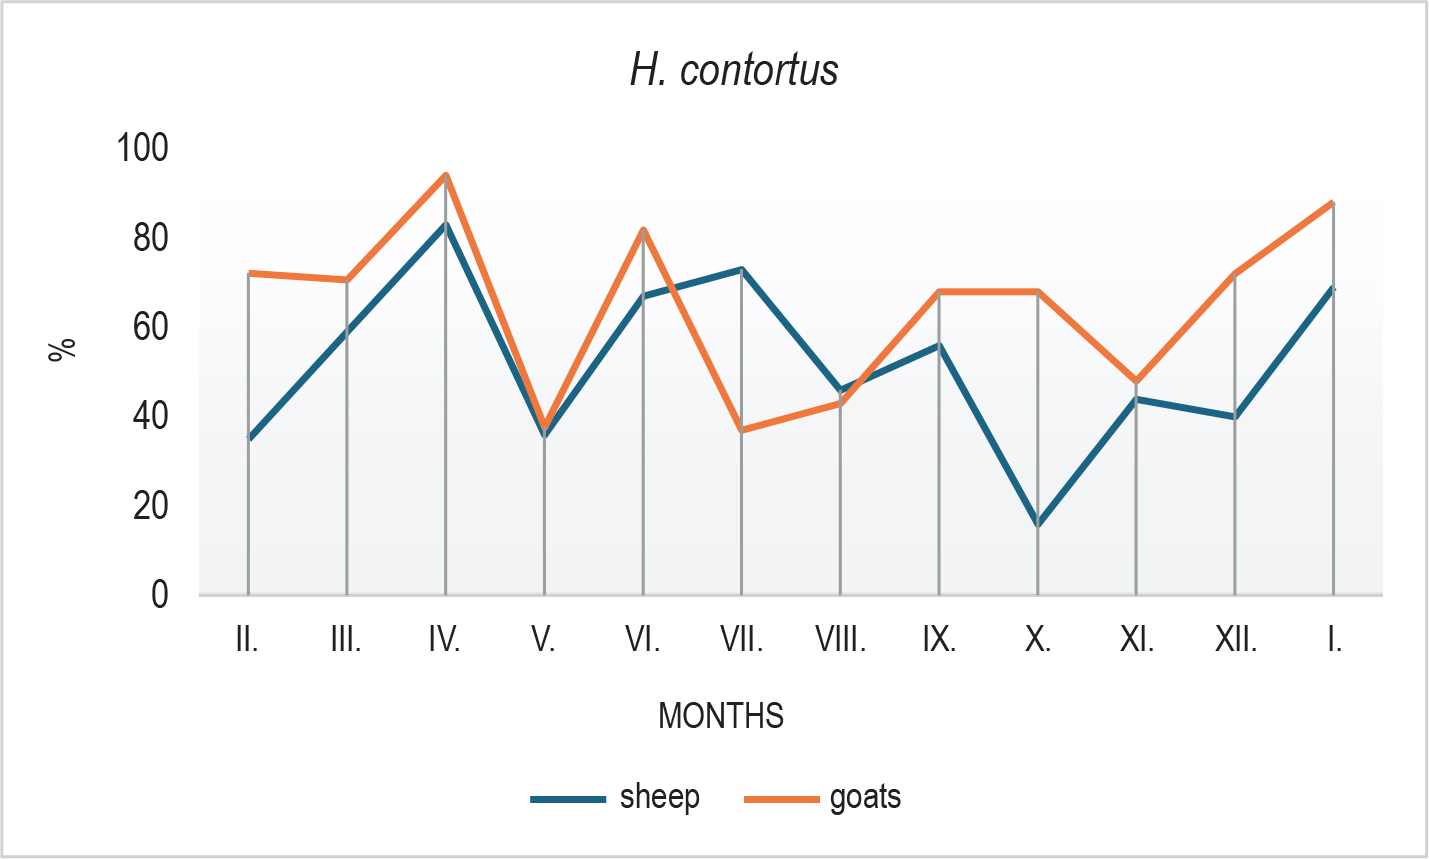
Fig. 3.
Seasonal composition of Haemonchus contortus larvae isolated from faecal cultures of goats and sheep over the 12-month monitoring period. H. contortus predominated in goats throughout the year, while in sheep, its prevalence fluctuated seasonally, with a decline in autumn and resurgence in winter months.
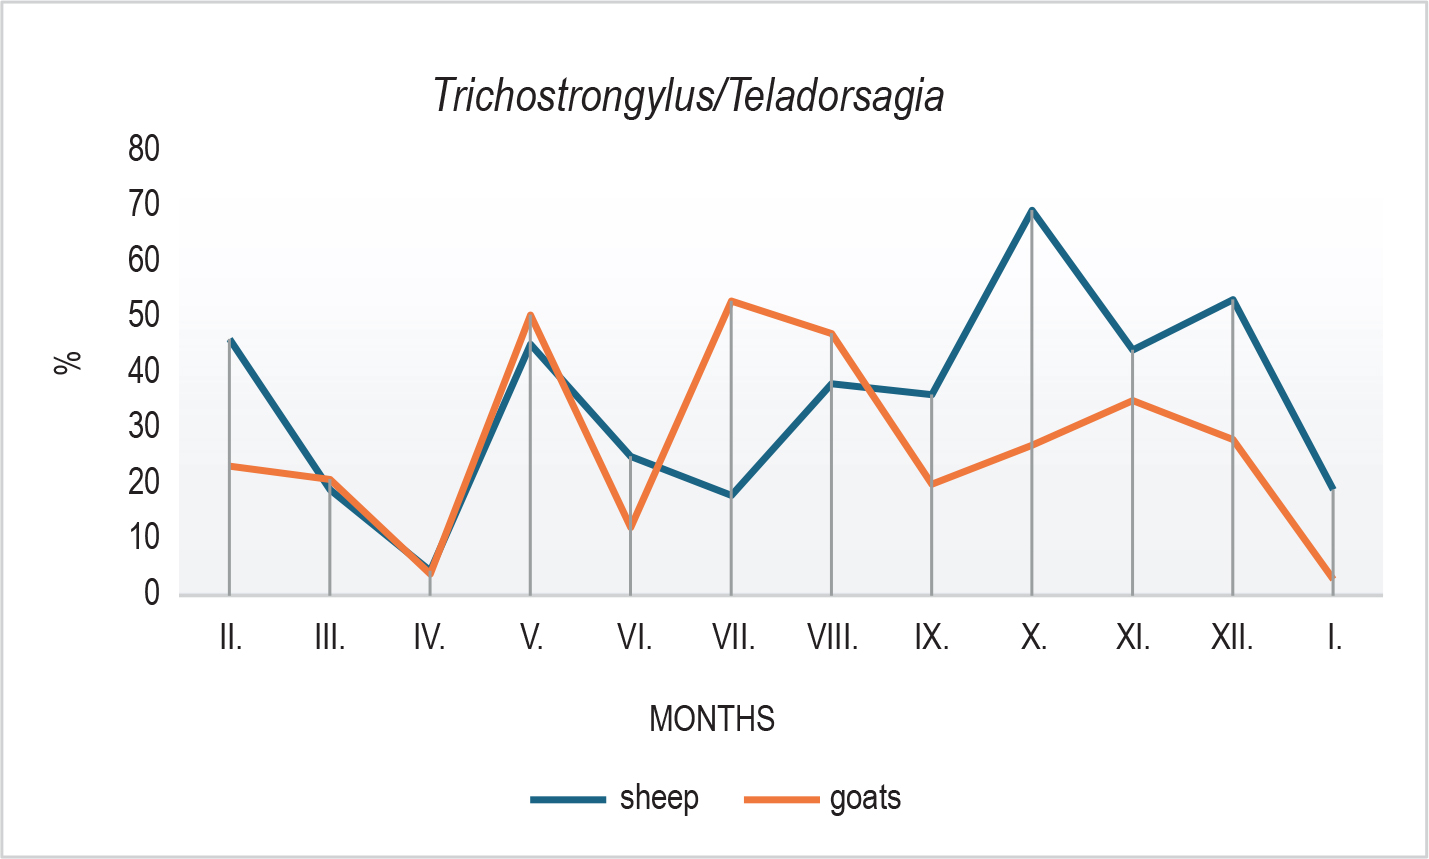
Fig. 4.
Proportion of Trichostrongylus/Teladorsagia spp. larvae recovered from faecal samples during the study. In goats, their abundance increased during the summer, while in sheep a marked peak was observed in October. The grouping reflects the indistinguishable morphology of L3 larvae from these two genera.
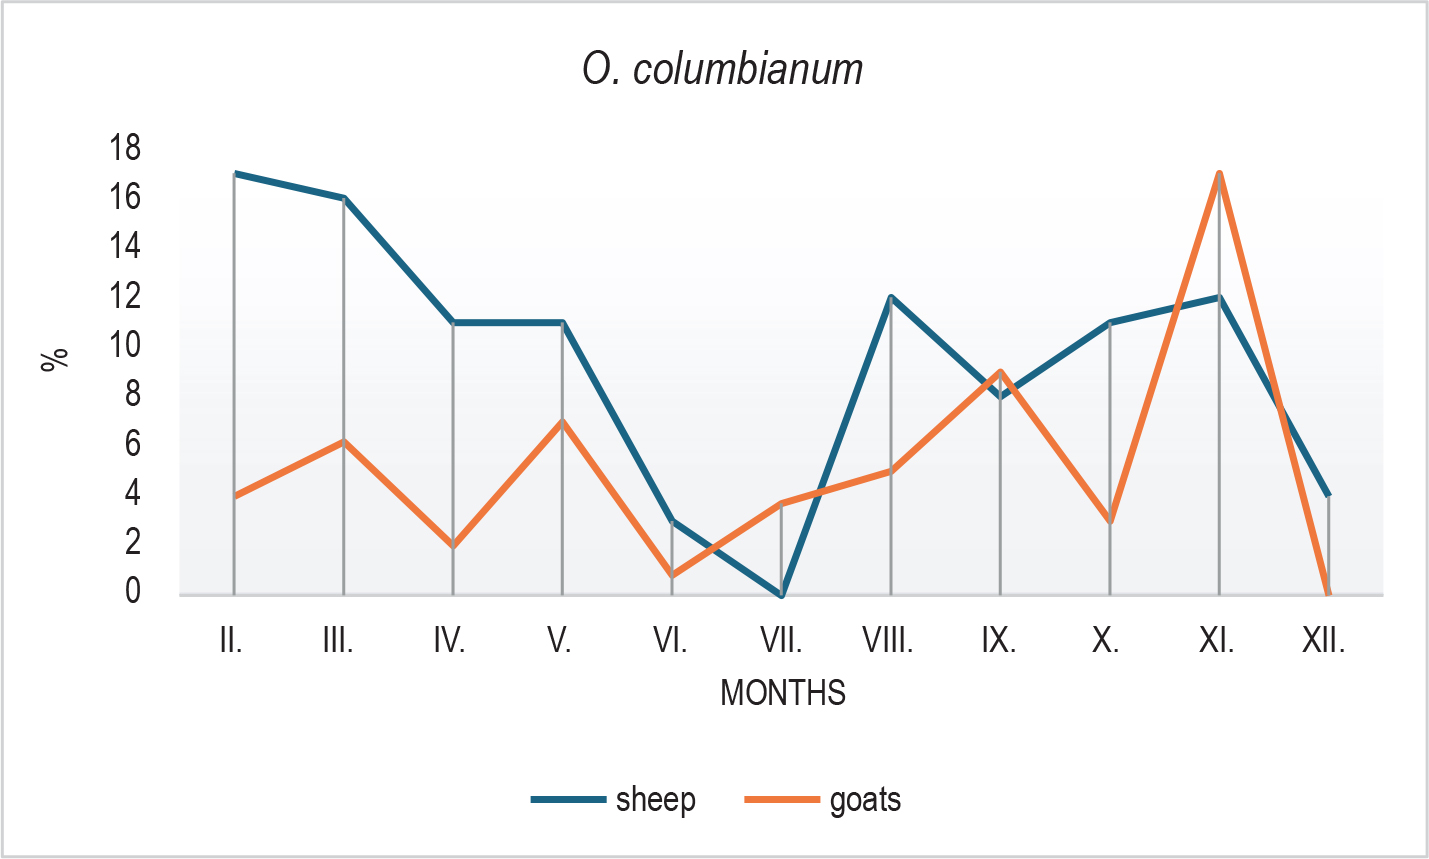
Fig. 5.
Seasonal dynamics of Oesophagostomum columbianum larvae identified in coprocultures from goats and sheep. A general decline was observed during the summer (June–July) in both host species, followed by fluctuating increases in the autumn and winter months.