
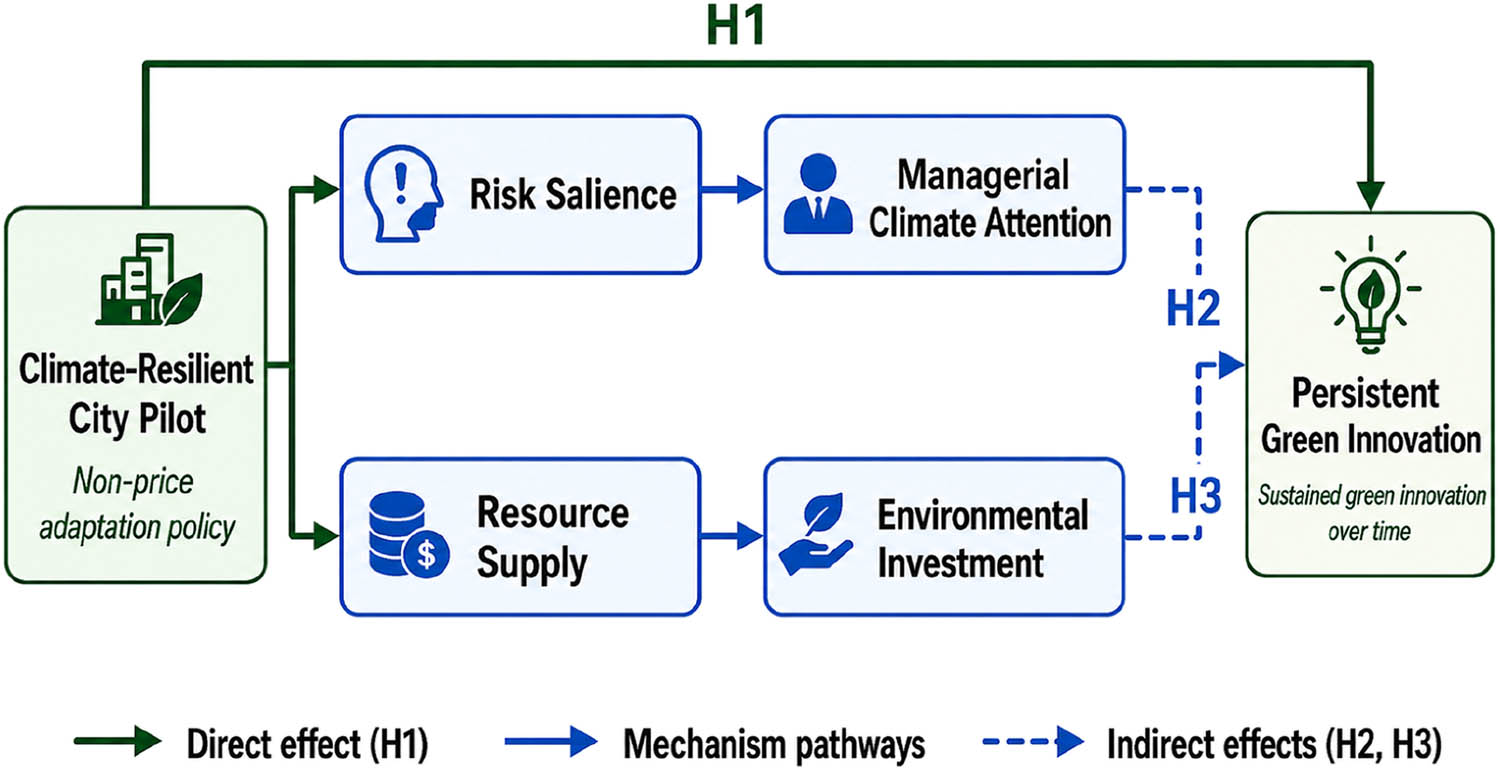
Figure 1
Research framework.
Table 1
Descriptive statistics.
| Variable | Definition | Mean value | SD | Min | Max | N |
|---|---|---|---|---|---|---|
| PGI | Persistent green innovation | 0.0455 | 0.0864 | 0.0000 | 0.8438 | 2,908 |
| CRC | Climate-resilient city policy | 0.0144 | 0.1193 | 0.0000 | 1.0000 | 2,908 |
| Size | Firm size | 22.0761 | 1.0413 | 19.5245 | 26.4403 | 2,908 |
| FirmAge | Firm age | 2.9832 | 0.2879 | 1.6094 | 3.8712 | 2,908 |
| Lev | Leverage | 0.3874 | 0.1832 | 0.0463 | 0.9077 | 2,908 |
| ROA | Profitability | 0.0353 | 0.0670 | −0.5562 | 0.2223 | 2,908 |
| CashFlow | Operating cash flow | 0.0563 | 0.0658 | −0.2015 | 0.2669 | 2,908 |
| SOE | State ownership | 0.2552 | 0.4360 | 0.0000 | 1.0000 | 2,908 |
| Indep | Board independence | 0.3754 | 0.0537 | 0.3333 | 0.6000 | 2,908 |
| ATO | Total asset turnover | 0.6625 | 0.3239 | 0.0496 | 2.6402 | 2,908 |
| HHI | Industry concentration | 0.0498 | 0.0554 | 0.0161 | 0.3717 | 2,908 |
Table 2
Baseline regression results.
| Variables | (1) | (2) |
|---|---|---|
| PGI | PGI | |
| CRC | 0.149*** | 0.139*** |
| (0.048) | (0.048) | |
| Size | 0.027*** | |
| (0.005) | ||
| FirmAge | −0.088** | |
| (0.041) | ||
| Lev | −0.010 | |
| (0.017) | ||
| ROA | 0.028 | |
| (0.023) | ||
| CashFlow | 0.071*** | |
| (0.021) | ||
| SOE | 0.009 | |
| (0.014) | ||
| Indep | 0.020 | |
| (0.039) | ||
| ATO | 0.006 | |
| (0.009) | ||
| HHI | 0.017 | |
| (0.028) | ||
| Constant | 0.043*** | −0.307* |
| (0.001) | (0.157) | |
| Firm FE | YES | YES |
| Time FE | YES | YES |
| Obs | 2,908 | 2,908 |
| R 2 | 0.563 | 0.578 |
Note: ***, **, and * denote significance at the 1, 5, and 10% levels, respectively. Firm-clustered standard errors are reported in parentheses.
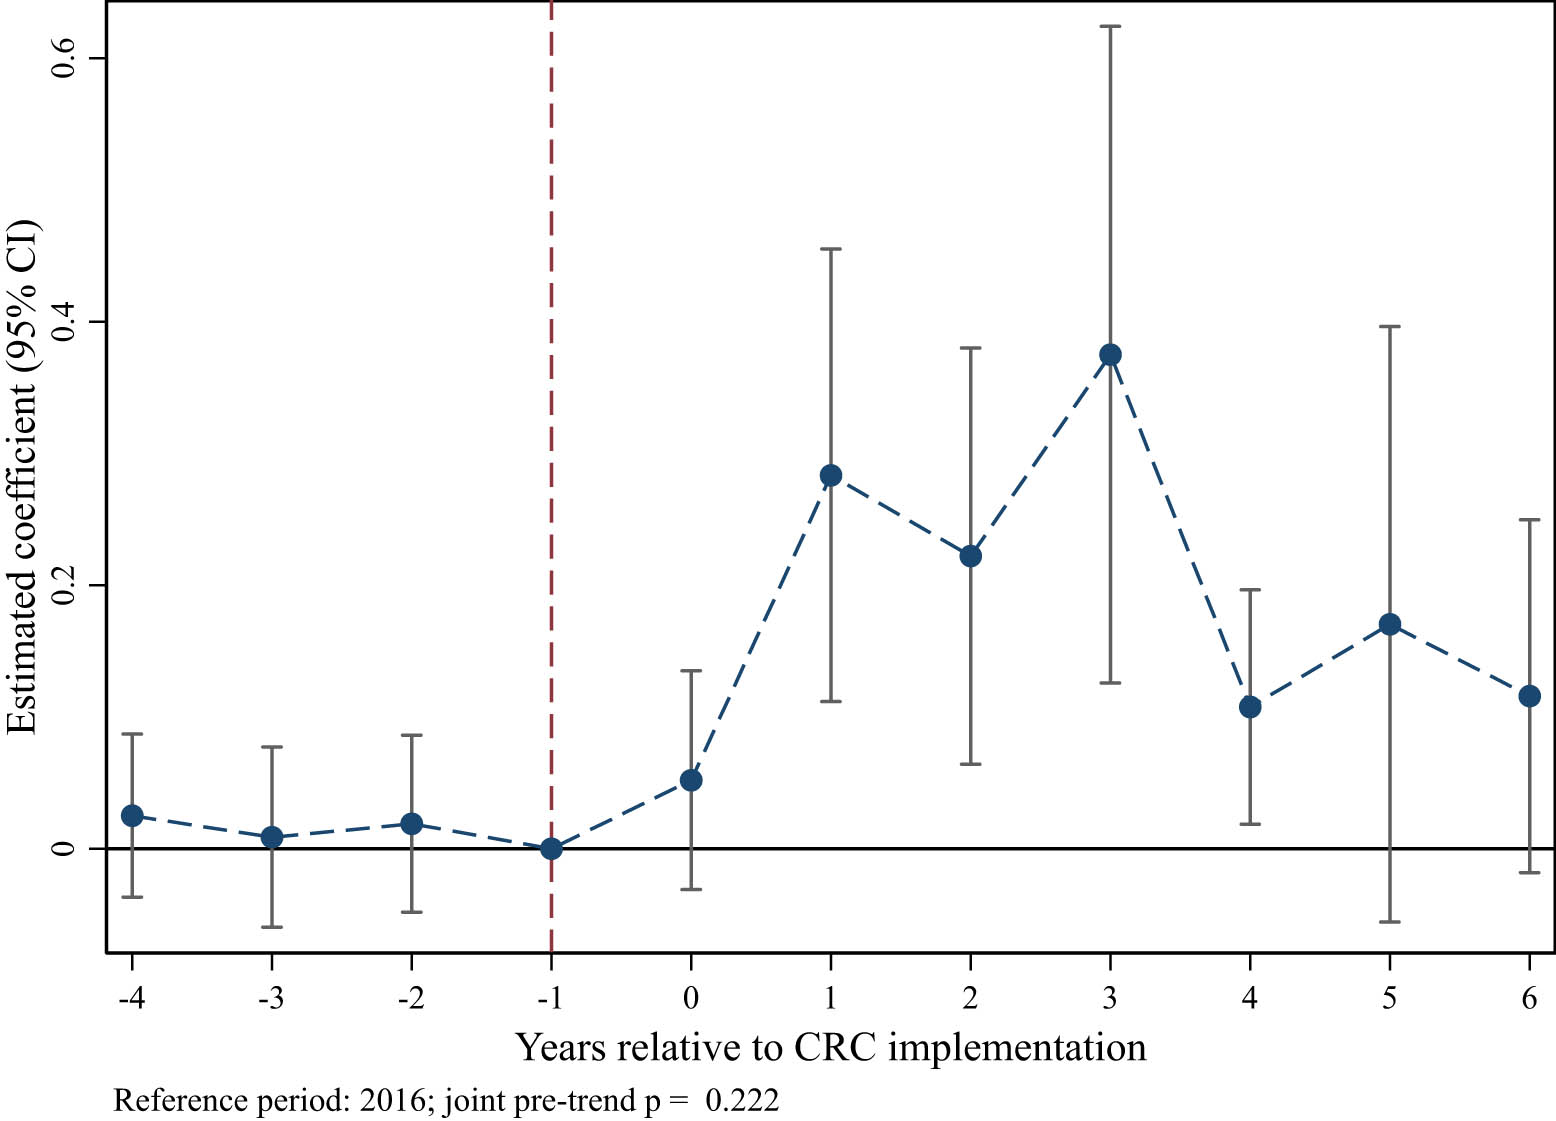
Figure 2
Parallel-trends test results.
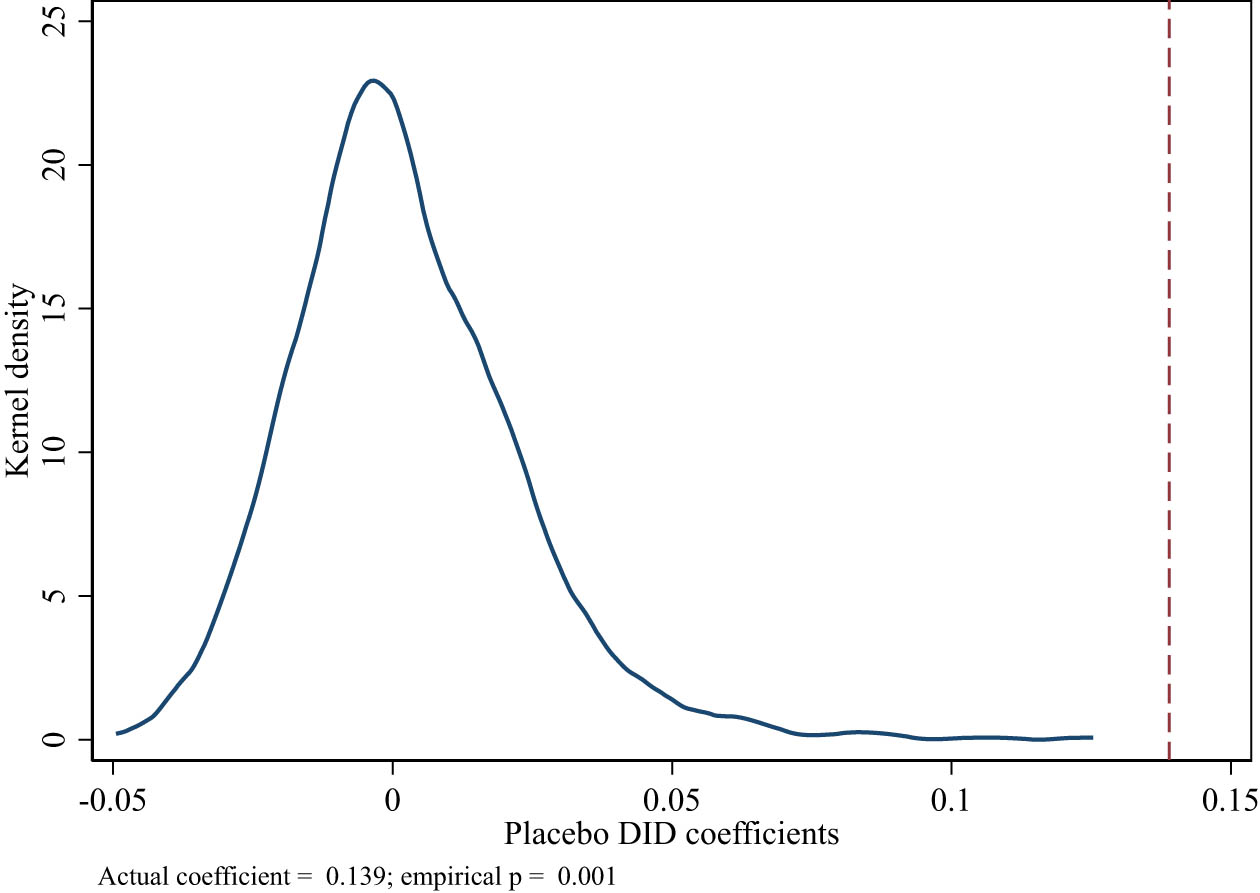
Figure 3
Placebo test.
Table 3
Mechanism tests.
| Variables | (1) | (2) |
|---|---|---|
| MgtAtt | EnvCap | |
| CRC | 0.262*** | 0.656** |
| (0.094) | (0.293) | |
| Constant | 2.426** | −19.163*** |
| (1.213) | (6.619) | |
| Controls | YES | YES |
| Firm FE | YES | YES |
| Time FE | YES | YES |
| Obs | 2,908 | 2,662 |
| R 2 | 0.873 | 0.576 |
Note: ***, **, and * denote significance at the 1, 5, and 10% levels, respectively. Firm-clustered standard errors are reported in parentheses.
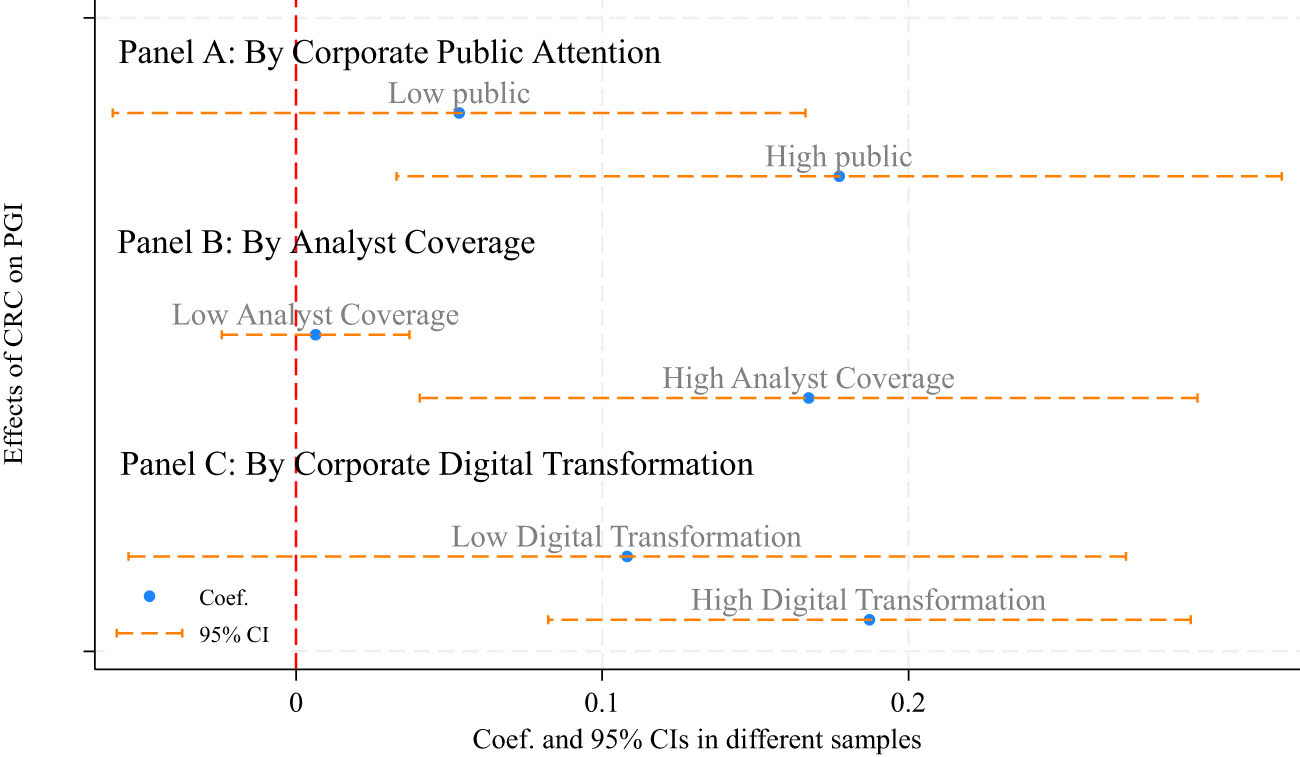
Figure 4
Heterogeneity analysis.
Table 4
Extended analysis.
| Variables | (1) | (2) |
|---|---|---|
| Green innovation quantity | Green innovation quality | |
| GIQ | GIQL | |
| CRC | 0.525*** | 0.004 |
| (0.197) | (0.177) | |
| Constant | −2.894** | −2.132* |
| (1.431) | (1.208) | |
| Controls | YES | YES |
| Firm FE | YES | YES |
| Time FE | YES | YES |
| Obs | 2,908 | 2,907 |
| R 2 | 0.627 | 0.685 |
Note: ***, **, and * denote significance at the 1, 5, and 10% levels, respectively. Firm-clustered standard errors are reported in parentheses.
Table A1
Event-study coefficients.
| Variables | PGI |
|---|---|
| pre_4 | 0.025 |
| (0.032) | |
| pre_3 | 0.009 |
| (0.035) | |
| pre_2 | 0.019 |
| (0.034) | |
| current | 0.052 |
| (0.042) | |
| post_1 | 0.283*** |
| (0.088) | |
| post_2 | 0.222*** |
| (0.081) | |
| post_3 | 0.375*** |
| (0.127) | |
| post_4 | 0.108** |
| (0.045) | |
| post_5 | 0.170 |
| (0.115) | |
| post_6 | 0.116* |
| (0.068) | |
| Controls | YES |
| Firm FE | YES |
| Time FE | YES |
| Obs | 2,908 |
| R 2 | 0.593 |
Note: ***, **, and * denote significance at the 1, 5, and 10% levels, respectively. Firm-clustered standard errors are reported in parentheses. The omitted reference period is 2016 (k = −1), and the joint test of the pre-policy coefficients yields p = 0.222.
Table A2
Robustness tests I.
| Variables | (1) | (2) | (3) |
|---|---|---|---|
| City-clustered standard errors | One-period lagged controls | City clustering and lagged controls | |
| PGI | PGI | PGI | |
| CRC | 0.139** | 0.133*** | 0.133** |
| (0.057) | (0.047) | (0.056) | |
| Constant | −0.307* | −0.333** | −0.333* |
| (0.174) | (0.151) | (0.170) | |
| Controls | YES | YES | YES |
| Firm FE | YES | YES | YES |
| Time FE | YES | YES | YES |
| Obs | 2,908 | 2,908 | 2,908 |
| R 2 | 0.578 | 0.575 | 0.575 |
Note: ***, **, and * denote significance at the 1, 5, and 10% levels, respectively. City-clustered standard errors are reported in parentheses in columns (1) and (3), and firm-clustered standard errors are reported in column (2).
Table A3
Robustness tests II.
| Variables | (1) | (2) | (3) | (4) |
|---|---|---|---|---|
| Excluding municipalities | Province-specific linear trends | Province-by-year fixed effects | Pre-policy city characteristics by year | |
| PGI | PGI | PGI | PGI | |
| CRC | 0.186*** | 0.194*** | 0.225*** | 0.159*** |
| (0.059) | (0.045) | (0.045) | (0.046) | |
| Constant | −0.349** | −0.305* | −0.316** | 0.141 |
| (0.176) | (0.156) | (0.155) | (0.747) | |
| Controls | YES | YES | YES | YES |
| Baseline × Year | — | — | — | YES |
| Firm FE | YES | YES | YES | YES |
| Time FE | YES | YES | YES | YES |
| Obs | 2,620 | 2,908 | 2,846 | 2,847 |
| R 2 | 0.571 | 0.597 | 0.644 | 0.597 |
Note: ***, **, and * denote significance at the 1, 5, and 10% levels, respectively. Firm-clustered standard errors are reported in parentheses. The Baseline × Year variables in column (4) include the number of green patents (GPat × Year), number of extreme high-temperature days (ExtHot × Year), number of extreme low-temperature days (ExtCold × Year), precipitation (Precip × Year), GDP per capita (PGDP × Year), and the share of secondary industry (SecShare × Year).
Note: Year denotes the set of year indicators, and the terms represent interactions with the corresponding pre-policy city characteristics.
Table A4
Determinants of pilot selection.
| Variables | CRC |
|---|---|
| GPat | 0.131 |
| (0.091) | |
| ExtHot | 0.103 |
| (0.083) | |
| ExtCold | −0.054 |
| (0.033) | |
| Precip | −0.027 |
| (0.028) | |
| PGDP | −0.130 |
| (0.261) | |
| SecShare | −0.004 |
| (0.014) | |
| Constant | −2.359 |
| (3.711) | |
| Obs | 285 |
Note: ***, **, and * denote significance at the 1, 5, and 10% levels, respectively. Robust standard errors are reported in parentheses.
Table A5
Controlling for contemporaneous environmental policies.
| Variables | (1) | (2) | (3) | (4) |
|---|---|---|---|---|
| Controlling for environmental vertical reform | Controlling for the low-carbon city pilot program | Controlling for green finance pilot zones | Controlling for all three policies | |
| PGI | PGI | PGI | PGI | |
| CRC | 0.139*** | 0.138*** | 0.155*** | 0.153*** |
| (0.048) | (0.045) | (0.052) | (0.049) | |
| EVR | −0.004 | −0.004 | ||
| (0.007) | (0.007) | |||
| LCP | 0.022* | 0.022* | ||
| (0.011) | (0.012) | |||
| GFZ | −0.004 | −0.005 | ||
| (0.013) | (0.012) | |||
| Constant | −0.304* | −0.353** | −0.277* | −0.289* |
| (0.156) | (0.157) | (0.161) | (0.161) | |
| Controls | YES | YES | YES | YES |
| Firm FE | YES | YES | YES | YES |
| Time FE | YES | YES | YES | YES |
| Obs | 2,908 | 2,857 | 2,808 | 2,808 |
| R 2 | 0.578 | 0.577 | 0.578 | 0.580 |
Note: ***, **, and * denote significance at the 1, 5, and 10% levels, respectively. Firm-clustered standard errors are reported in parentheses.