
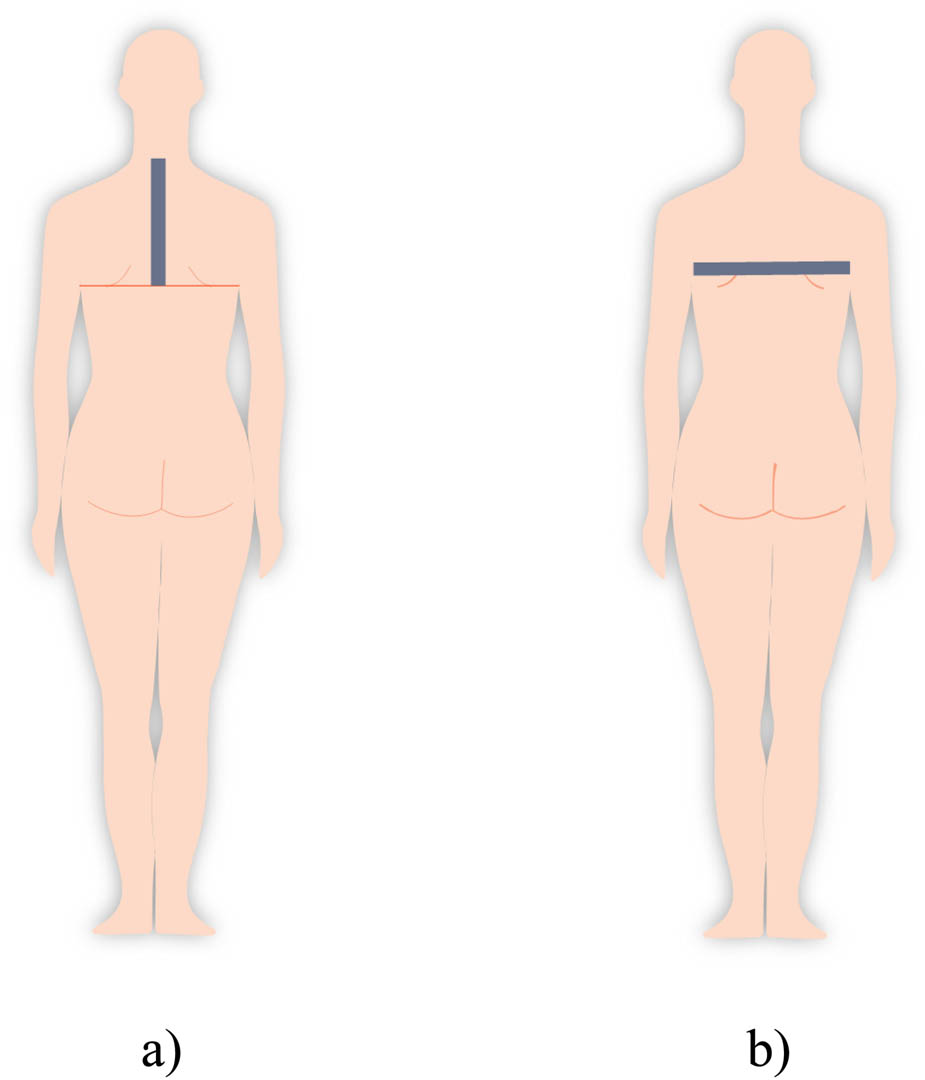
Figure 1
Construction parameters: (a) scye depth and (b) back width [5].
Table 1
Basic parameters of the bust girth distribution of women (cm) by region and age group.
| Region | Age | Na | x̅b | sc | CVd (%) | 95% CIe | Range | ||
|---|---|---|---|---|---|---|---|---|---|
| h1 | h2 | Min. | Max. | ||||||
| Goransko primorska | –29 | 236 | 91.8 | 7.4 | 8.1 | 90.8 | 92.7 | 80.0 | 127.0 |
| 30–39 | 171 | 95.9 | 9.6 | 10.0 | 94.5 | 97.3 | 75.0 | 126.5 | |
| 40–49 | 179 | 100.0 | 10.1 | 10.1 | 98.5 | 101.5 | 78.0 | 132.0 | |
| 50–59 | 157 | 105.9 | 11.5 | 10.9 | 104.1 | 107.7 | 73.0 | 134.0 | |
| 60–69 | 125 | 107.5 | 10.0 | 9.3 | 105.7 | 109.3 | 80.0 | 130.0 | |
| 70–79 | 133 | 108.5 | 10.4 | 9.6 | 106.7 | 110.3 | 79.0 | 131.0 | |
| 80– | 103 | 104.5 | 11.9 | 11.4 | 102.2 | 106.8 | 68.0 | 132.0 | |
| Total | 1104 | 100.7 | 11.7 | 11.6 | 100.0 | 101.4 | 68.0 | 134.0 | |
| Slavonia | –29 | 243 | 89.7 | 7.6 | 8.5 | 88.8 | 90.7 | 71.0 | 122.0 |
| 30–39 | 121 | 91.9 | 7.5 | 8.2 | 90.6 | 93.3 | 79.0 | 113.0 | |
| 40–9 | 118 | 98.2 | 9.5 | 9.7 | 96.5 | 100.0 | 81.0 | 126.0 | |
| 50–59 | 109 | 100.8 | 11.4 | 11.3 | 98.6 | 103.0 | 78.0 | 134.0 | |
| 60–69 | 113 | 104.0 | 10.2 | 9.8 | 102.1 | 105.9 | 82.0 | 132.0 | |
| 70–79 | 126 | 105.2 | 9.7 | 9.2 | 103.4 | 106.9 | 81.0 | 134.0 | |
| 80- | 110 | 104.3 | 10.2 | 9.8 | 102.4 | 106.3 | 78.0 | 136.0 | |
| Total | 940 | 97.9 | 11.2 | 11.4 | 97.1 | 98.6 | 71.0 | 136.0 | |
| Central Croatia | –29 | 205 | 90.3 | 8.1 | 9.0 | 89.2 | 91.4 | 68.0 | 125.0 |
| 30–39 | 140 | 95.0 | 10.1 | 10.6 | 93.3 | 96.7 | 72.0 | 128.0 | |
| 40–49 | 140 | 97.8 | 11.4 | 11.7 | 95.9 | 99.7 | 72.0 | 134.0 | |
| 50–59 | 97 | 104.7 | 10.5 | 10.0 | 102.6 | 106.8 | 86.0 | 133.2 | |
| 60–69 | 96 | 107.4 | 13.0 | 12.1 | 104.8 | 110.1 | 76.0 | 137.0 | |
| 70–79 | 110 | 104.7 | 9.8 | 9.4 | 102.9 | 106.6 | 78.0 | 128.0 | |
| 80– | 107 | 101.9 | 11.8 | 11.6 | 99.6 | 104.1 | 76.0 | 129.0 | |
| Total | 895 | 98.8 | 12.0 | 12.1 | 98.0 | 99.6 | 68.0 | 137.0 | |
| Dalmatia | –29 | 253 | 91.2 | 6.2 | 6.8 | 90.5 | 92.0 | 73.5 | 111.0 |
| 30–39 | 175 | 93.5 | 6.4 | 6.8 | 92.6 | 94.5 | 80.0 | 112.0 | |
| 40–49 | 191 | 98.1 | 8.0 | 8.2 | 96.9 | 99.2 | 80.0 | 125.0 | |
| 50–59 | 147 | 102.6 | 9.3 | 9.1 | 101.1 | 104.2 | 82.5 | 134.0 | |
| 60–69 | 109 | 103.8 | 8.2 | 7.9 | 102.2 | 105.3 | 80.4 | 120.0 | |
| 70–79 | 119 | 103.3 | 11.5 | 11.1 | 101.2 | 105.4 | 66.0 | 142.0 | |
| 80– | 115 | 102.5 | 10.4 | 10.1 | 100.6 | 104.4 | 80.0 | 128.0 | |
| Total | 1109 | 98.0 | 9.7 | 9.9 | 97.4 | 98.6 | 66.0 | 142.0 | |
| City of Zagreb | –29 | 168 | 88.5 | 6.6 | 7.5 | 87.4 | 89.5 | 78.0 | 126.5 |
| 30–39 | 127 | 94.0 | 9.2 | 9.8 | 92.4 | 95.7 | 77.0 | 128.0 | |
| 40–49 | 154 | 98.2 | 9.4 | 9.6 | 96.7 | 99.7 | 78.0 | 129.0 | |
| 50–59 | 110 | 102.0 | 10.5 | 10.3 | 100.0 | 104.0 | 70.5 | 129.0 | |
| 60–69 | 87 | 105.1 | 11.4 | 10.8 | 102.7 | 107.5 | 83.0 | 131.0 | |
| 70–79 | 83 | 104.6 | 11.1 | 10.6 | 102.1 | 107.0 | 69.0 | 131.5 | |
| 80– | 70 | 107.2 | 11.6 | 10.8 | 104.4 | 109.9 | 79.0 | 127.0 | |
| Total | 799 | 98.2 | 11.6 | 11.8 | 97.4 | 99.0 | 69.0 | 131.5 | |
Table 2
Basic parameters of the scye depth distribution of women (cm) by region and age group.
| Region | Age | Na | x̅b | sc | CVd (%) | 95% CIe | Range | ||
|---|---|---|---|---|---|---|---|---|---|
| h 1 | h 2 | Min. | Max. | ||||||
| Goransko-primorska | –29 | 236 | 18.1 | 2.3 | 12.7 | 17.8 | 18.4 | 12.0 | 25.0 |
| 30–39 | 171 | 18.9 | 2.5 | 13.0 | 18.5 | 19.3 | 11.5 | 26.0 | |
| 40–49 | 179 | 19.8 | 3.4 | 17.1 | 19.3 | 20.3 | 12.0 | 31.5 | |
| 50–59 | 157 | 19.7 | 2.8 | 14.3 | 19.3 | 20.2 | 13.0 | 30.0 | |
| 60–69 | 125 | 20.5 | 2.3 | 11.5 | 20.1 | 20.9 | 14.0 | 27.0 | |
| 70–79 | 133 | 21.2 | 3.3 | 15.6 | 20.6 | 21.7 | 13.0 | 32.0 | |
| 80 | 103 | 21.9 | 3.6 | 16.6 | 21.2 | 22.6 | 14.0 | 33.0 | |
| Total | 1104 | 19.7 | 3.1 | 15.7 | 19.5 | 19.9 | 11.5 | 33.0 | |
| Slavonia | –29 | 243 | 17.6 | 2.1 | 11.7 | 17.4 | 17.9 | 12.5 | 26.0 |
| 30–39 | 121 | 17.8 | 2.2 | 12.5 | 17.4 | 18.2 | 12.0 | 23.0 | |
| 40–49 | 118 | 18.2 | 2.1 | 11.7 | 17.9 | 18.6 | 14.0 | 26.0 | |
| 50–59 | 109 | 19.1 | 3.1 | 16.1 | 18.5 | 19.6 | 15.0 | 28.0 | |
| 60–69 | 113 | 18.8 | 2.2 | 11.7 | 18.4 | 19.2 | 15.0 | 25.0 | |
| 70–79 | 126 | 19.5 | 2.4 | 12.2 | 19.1 | 19.9 | 14.0 | 26.0 | |
| 80– | 110 | 19.0 | 2.7 | 14.3 | 18.5 | 19.5 | 10.0 | 28.0 | |
| Total | 940 | 18.4 | 2.5 | 13.3 | 18.3 | 18.6 | 10.0 | 28.0 | |
| Central Croatia | –29 | 205 | 19.2 | 2.6 | 13.4 | 18.8 | 19.5 | 12.0 | 25.6 |
| 30–39 | 140 | 19.3 | 2.7 | 13.8 | 18.8 | 19.7 | 11.0 | 26.0 | |
| 40–49 | 140 | 20.2 | 2.4 | 11.9 | 19.8 | 20.6 | 14.5 | 26.0 | |
| 50–59 | 97 | 20.0 | 2.5 | 12.5 | 19.5 | 20.5 | 14.0 | 26.0 | |
| 60–69 | 96 | 22.0 | 3.1 | 13.9 | 21.4 | 22.7 | 15.0 | 32.0 | |
| 70–79 | 110 | 20.8 | 2.7 | 12.8 | 20.3 | 21.3 | 14.0 | 28.0 | |
| 80– | 107 | 20.4 | 2.8 | 13.9 | 19.9 | 21.0 | 14.0 | 28.0 | |
| Total | 895 | 20.1 | 2.8 | 13.9 | 19.9 | 20.3 | 11.0 | 32.0 | |
| Dalmatia | –29 | 253 | 19.4 | 3.1 | 16.1 | 19.0 | 19.8 | 13.2 | 30.0 |
| 30–39 | 175 | 19.5 | 3.0 | 15.5 | 19.1 | 20.0 | 15.2 | 29.0 | |
| 40–49 | 191 | 19.8 | 3.2 | 16.2 | 19.3 | 20.2 | 13.5 | 30.0 | |
| 50–59 | 147 | 20.4 | 3.4 | 16.5 | 19.9 | 21.0 | 16.0 | 33.0 | |
| 60–69 | 109 | 19.7 | 2.6 | 13.4 | 19.2 | 20.2 | 15.9 | 27.0 | |
| 70–79 | 119 | 20.0 | 3.0 | 15.0 | 19.5 | 20.6 | 14.0 | 29.0 | |
| 80– | 115 | 20.0 | 3.4 | 16.9 | 19.3 | 20.6 | 12.9 | 29.0 | |
| Total | 1109 | 19.8 | 3.1 | 15.8 | 19.6 | 20.0 | 12.9 | 33.0 | |
| City of Zagreb | –29 | 168 | 16.5 | 2.4 | 14.4 | 16.1 | 16.9 | 12.0 | 26.0 |
| 30–39 | 127 | 16.7 | 1.8 | 11.0 | 16.4 | 17.1 | 11.0 | 23.3 | |
| 40–49 | 154 | 17.1 | 2.4 | 13.8 | 16.8 | 17.5 | 11.0 | 26.0 | |
| 50–59 | 110 | 17.5 | 2.3 | 13.2 | 17.1 | 17.9 | 12.0 | 23.0 | |
| 60–69 | 87 | 20.0 | 2.2 | 11.0 | 19.6 | 20.5 | 14.0 | 26.0 | |
| 70–79 | 83 | 19.3 | 2.6 | 13.6 | 18.7 | 19.9 | 13.0 | 24.7 | |
| 80– | 70 | 20.6 | 2.3 | 11.1 | 20.1 | 21.2 | 11.0 | 24.0 | |
| Total | 799 | 17.8 | 2.7 | 15.1 | 17.7 | 18.0 | 11.0 | 26.0 | |
Table 3
Results of the analysis of differences in mean scye depth of women by region and age group (two-way analysis of variance model).
| Source of variability | SSa | dfb | MSc | Fd | p e | |
|---|---|---|---|---|---|---|
| Differences | Region | 2716.064 | 4 | 679.016 | 92.442 | <0.001 |
| Age | 3328.466 | 6 | 554.744 | 75.524 | <0.001 | |
| Interaction | Region × Age | 1440.642 | 24 | 60.027 | 8.172 | <0.001 |
| Model | 7874.729 | 34 | 231.610 | 31.532 | <0.001 | |
| Residual | 35345.502 | 4812 | 7.345 | |||
| Total | 43220.231 | 4846 | 8.919 | |||
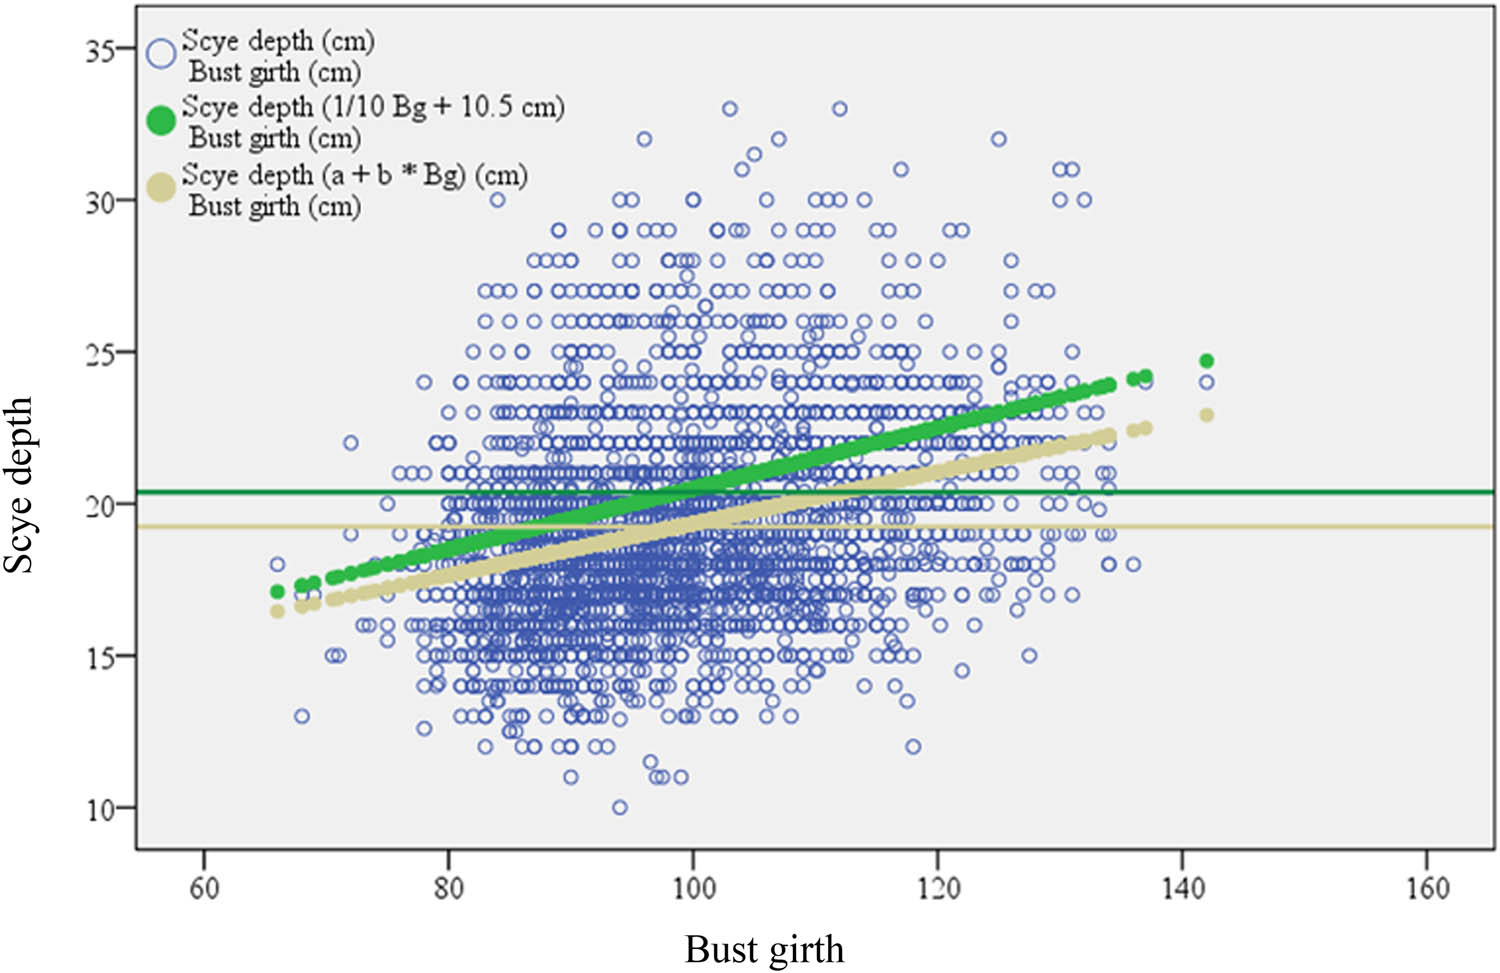
Figure 2
Relationship between empirical, mathematical, and estimated values of women’s scye depth in relation to bust girth (N = 4,847).
Table 4
Basic parameters of the back width distribution of women (cm) by region and age group.
| Region | Age | Na | x̅b | sc | CVd (%) | 95% CIe | Range | ||
|---|---|---|---|---|---|---|---|---|---|
| h1 | h2 | Min. | Max. | ||||||
| Goransko-primorska | –29 | 236 | 34.8 | 3.5 | 10.1 | 34.4 | 35.3 | 26.0 | 48.0 |
| 30–39 | 171 | 36.7 | 3.7 | 10.1 | 36.1 | 37.2 | 29.0 | 47.0 | |
| 40–49 | 179 | 37.7 | 4.1 | 10.9 | 37.1 | 38.3 | 27.0 | 49.0 | |
| 50–59 | 157 | 38.9 | 4.0 | 10.3 | 38.3 | 39.5 | 28.5 | 49.0 | |
| 60–69 | 125 | 39.5 | 3.7 | 9.3 | 38.9 | 40.2 | 30.0 | 50.0 | |
| 70–79 | 133 | 39.4 | 4.6 | 11.6 | 38.6 | 40.2 | 26.0 | 48.0 | |
| 80– | 103 | 37.8 | 5.3 | 14.1 | 36.8 | 38.8 | 24.0 | 48.0 | |
| Total | 1104 | 37.5 | 4.4 | 11.7 | 37.3 | 37.8 | 24.0 | 50.0 | |
| Slavonia | –29 | 243 | 34.6 | 3.3 | 9.6 | 34.1 | 35.0 | 24.2 | 50.0 |
| 30–39 | 121 | 35.2 | 3.2 | 9.2 | 34.6 | 35.7 | 27.0 | 49.0 | |
| 40–49 | 118 | 36.4 | 3.2 | 8.9 | 35.8 | 37.0 | 29.0 | 45.0 | |
| 50–59 | 109 | 37.8 | 3.6 | 9.4 | 37.1 | 38.5 | 29.5 | 47.0 | |
| 60–69 | 113 | 37.9 | 3.2 | 8.3 | 37.3 | 38.5 | 31.0 | 48.0 | |
| 70–79 | 126 | 38.0 | 3.2 | 8.5 | 37.5 | 38.6 | 27.0 | 49.0 | |
| 80– | 110 | 37.8 | 3.7 | 9.8 | 37.1 | 38.5 | 27.0 | 48.0 | |
| Total | 940 | 36.5 | 3.6 | 10.0 | 36.3 | 36.7 | 24.2 | 50.0 | |
| Central Croatia | –29 | 205 | 34.3 | 3.9 | 11.3 | 33.8 | 34.8 | 26.0 | 46.0 |
| 30–39 | 140 | 36.1 | 4.3 | 11.9 | 35.4 | 36.8 | 24.0 | 47.0 | |
| 40–49 | 140 | 36.4 | 4.4 | 12.0 | 35.6 | 37.1 | 28.0 | 51.0 | |
| 50–59 | 97 | 37.7 | 4.2 | 11.2 | 36.8 | 38.5 | 30.0 | 48.0 | |
| 60–69 | 96 | 37.3 | 4.8 | 12.9 | 36.3 | 38.3 | 29.0 | 50.0 | |
| 70–79 | 110 | 37.7 | 4.5 | 12.0 | 36.8 | 38.5 | 28.0 | 50.0 | |
| 80– | 107 | 37.2 | 4.5 | 12.1 | 36.3 | 38.0 | 27.0 | 50.0 | |
| Total | 895 | 36.4 | 4.5 | 12.3 | 36.1 | 36.6 | 24.0 | 51.0 | |
| Dalmatia | –29 | 253 | 34.2 | 3.5 | 10.2 | 33.8 | 34.6 | 24.5 | 44.0 |
| 30–39 | 175 | 35.4 | 3.4 | 9.7 | 34.9 | 36.0 | 25.0 | 44.0 | |
| 40–49 | 191 | 36.5 | 3.7 | 10.2 | 36.0 | 37.0 | 26.0 | 48.0 | |
| 50–59 | 147 | 37.3 | 4.0 | 10.6 | 36.7 | 38.0 | 27.0 | 49.0 | |
| 60–69 | 109 | 37.9 | 3.4 | 8.9 | 37.2 | 38.5 | 26.5 | 47.0 | |
| 70–79 | 119 | 37.2 | 4.2 | 11.2 | 36.4 | 38.0 | 27.5 | 47.0 | |
| 80– | 115 | 36.8 | 3.9 | 10.6 | 36.1 | 37.5 | 28.0 | 47.0 | |
| Total | 1109 | 36.2 | 3.9 | 10.8 | 35.9 | 36.4 | 24.5 | 49.0 | |
| City of Zagreb | –29 | 168 | 33.5 | 3.6 | 10.7 | 33.0 | 34.1 | 26.0 | 44.0 |
| 30–39 | 127 | 35.9 | 3.6 | 10.0 | 35.3 | 36.6 | 27.0 | 47.0 | |
| 40–49 | 154 | 36.2 | 3.5 | 9.7 | 35.6 | 36.8 | 27.0 | 44.0 | |
| 50–59 | 110 | 37.6 | 3.4 | 9.1 | 36.9 | 38.2 | 29.0 | 45.5 | |
| 60–69 | 87 | 40.6 | 3.6 | 9.0 | 39.8 | 41.3 | 32.0 | 51.0 | |
| 70–79 | 83 | 39.7 | 4.7 | 11.9 | 38.6 | 40.7 | 28.0 | 51.0 | |
| 80– | 70 | 41.1 | 4.3 | 10.4 | 40.1 | 42.2 | 29.0 | 48.0 | |
| Total | 799 | 37.0 | 4.5 | 12.2 | 36.7 | 37.4 | 26.0 | 51.0 | |
Table 5
Results of the analysis of differences in mean back width of women by region and age group (two-way ANOVA model).
| Source of variability | SSa | dfb | MSc | Fd | p e | |
|---|---|---|---|---|---|---|
| Differences | Region | 1535.944 | 4 | 383.986 | 25.903 | <0.001 |
| Age | 12223.705 | 6 | 2037.284 | 137.429 | <0.001 | |
| Interaction | Region × Age | 1856.509 | 24 | 77.355 | 5.218 | <0.001 |
| Model | 14864.257 | 34 | 437.184 | 29.491 | <0.001 | |
| Residual | 71334.208 | 4812 | 14.824 | |||
| Total | 86198.465 | 4846 | 17.788 | |||
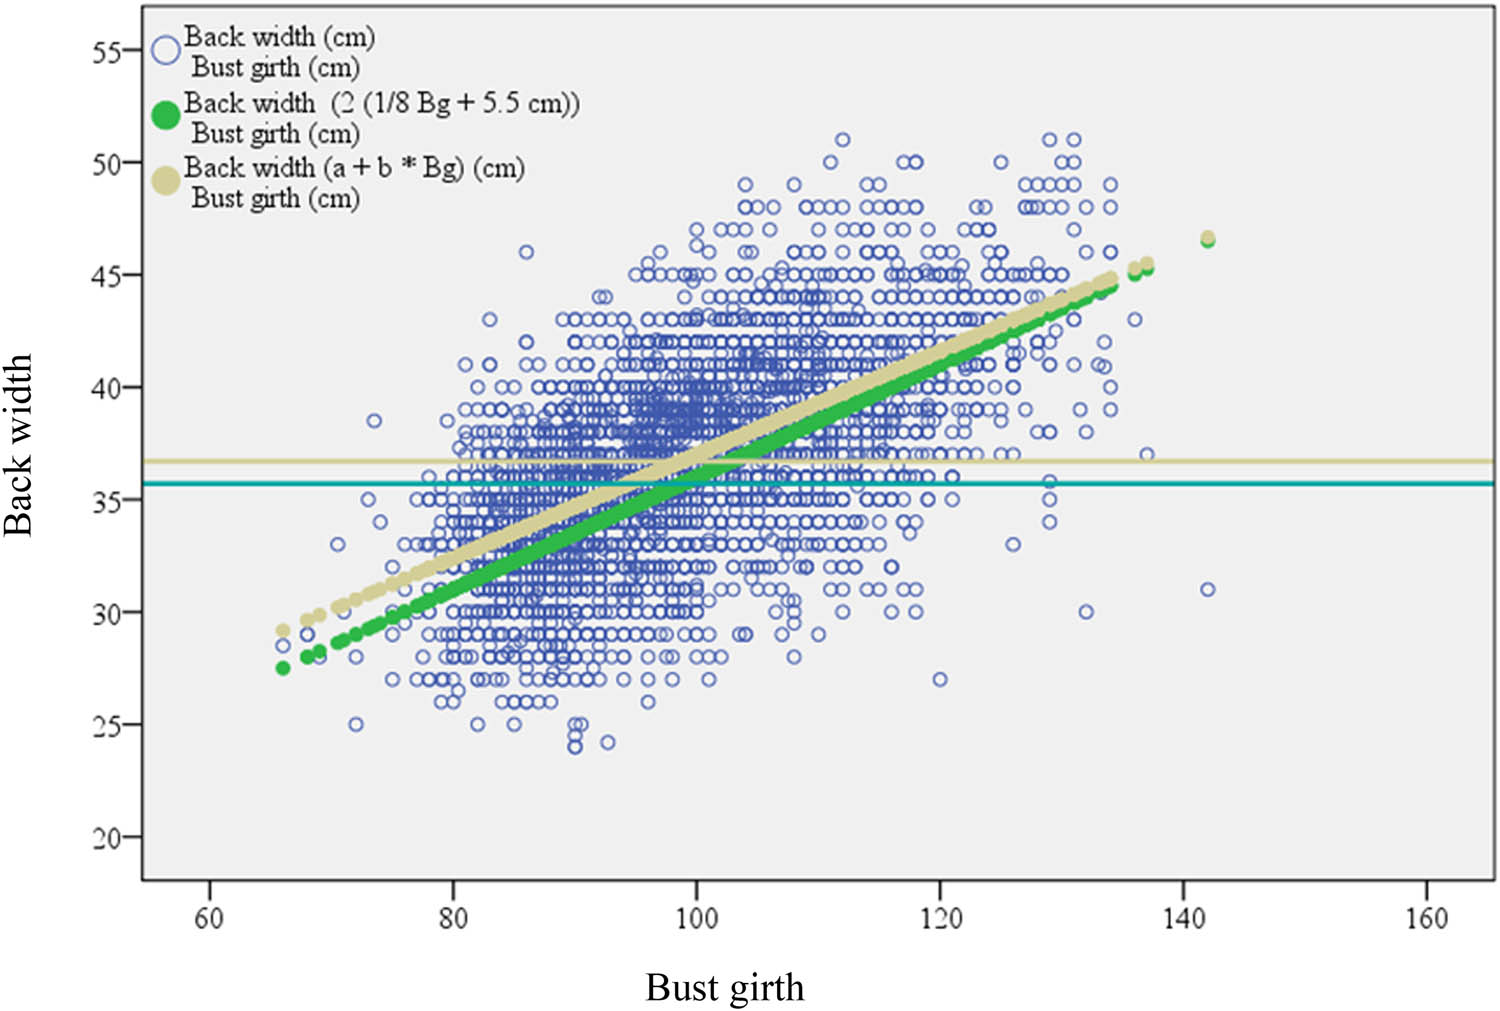
Figure 3
Relationship between empirical, mathematical, and estimated values of women’s back width in relation to bust girth (N = 4,847).