
1. Introduction
In industrial clothing production, one of the main market requirements is to ensure optimal fit of garments to the body shape and proportions of consumers. Proper garment fit directly affects wearing comfort, aesthetic value, and overall user satisfaction. Therefore, it is essential to systematically collect and monitor accurate data on body dimensions [1].
Anthropometry is a scientific method that enables precise characterisation of human body dimensions, taking into account variability within and between populations [2]. Systematic anthropometric research is extremely important, as the body shape of adults changes over time, particularly with increasing age [3,4]. Knowledge of body measurements enables accurate pattern construction and successful clothing production.
To achieve this, key body measurements were determined on a representative sample of adult women in Croatia. Primary anthropometric measurements relevant to garment construction include bust girth, waist girth, hip girth, and body height [5]. Accurate measurement of these dimensions is essential for calculating derived construction parameters required for pattern development. Construction parameters are calculated using mathematical formulas based on proportional relationships between primary measurements [5,6].
In this study, two selected construction parameters – scye depth and back width (Figure 1) – were calculated based on the primary measurement of bust girth. The results provide insight into deviations between empirically measured and mathematically calculated values, highlighting the limitations of existing proportional models.
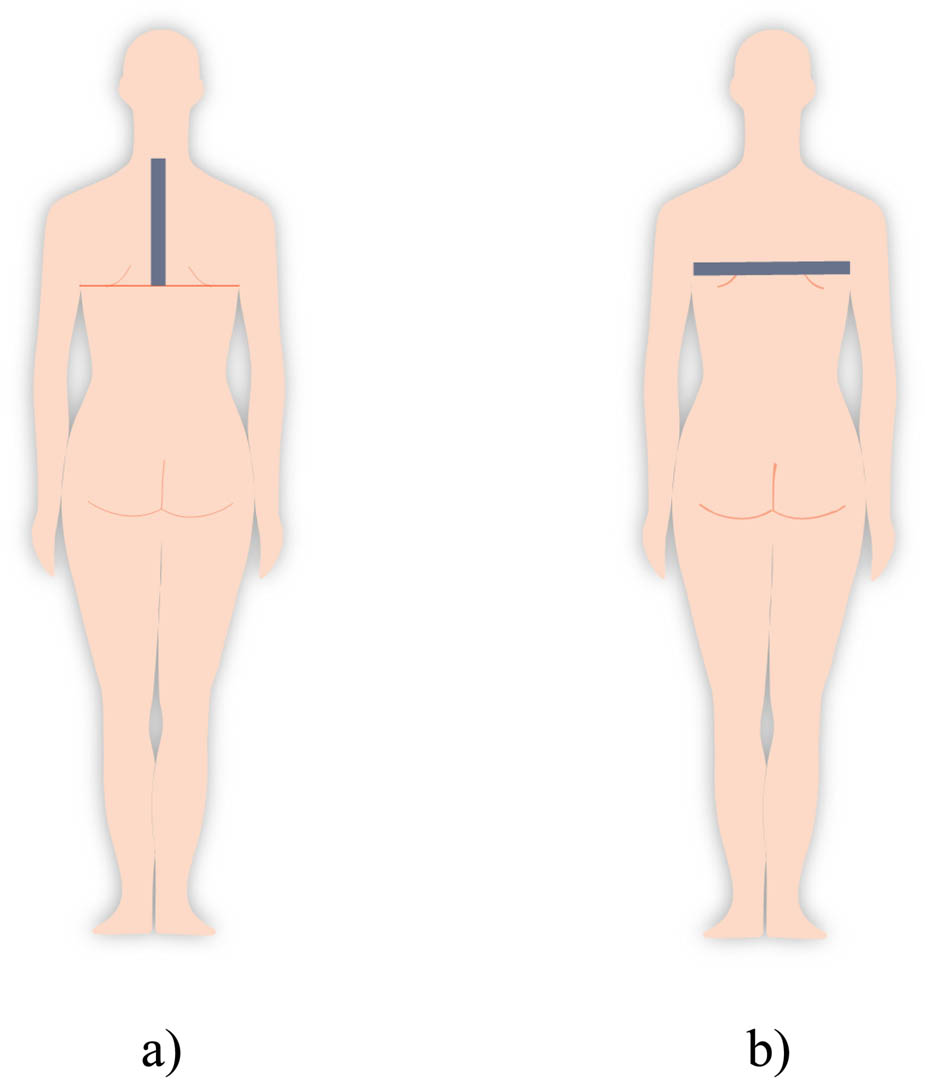
Figure 1
Construction parameters: (a) scye depth and (b) back width [5].
Bust girth is the primary basis for determining clothing size for women’s upper garments. Therefore, understanding the actual values of bust girth in the measured population enables the establishment of a precise sizing system, providing clothing manufacturers with reliable information on consumer needs. This makes it possible to determine accurate construction parameters and develop patterns that are optimally adapted to body shape and dimensions [5].
In industrial clothing production, particular emphasis is placed on the use of modern tools, primarily CAD systems for apparel, which enable digital design, construction, and modelling of garments [6,7]. These systems largely replace traditional manual drafting and pattern-making methods, offering significantly greater precision, efficiency, and speed in defining the dimensions and shapes of pattern components [8,9,10].
Validation of mathematical models, i.e., proportional formulas, enables the alignment of CAD algorithms with the actual anthropometric characteristics of the target population. This ensures greater accuracy in pattern construction and better adaptation of dimensions and proportions to real body measurements. The final outcome of this approach is improved garment fit, increased wearing comfort, and better adaptation to different body shapes [11,12,13,14].
This study contributes to the existing body of knowledge by providing updated anthropometric data and evaluating the applicability of commonly used proportional formulas in garment construction, focusing on identifying their limitations and potential improvements.
2. Materials and Methods
2.1. Subjects
This study included a sample of 4,847 adult women from the Republic of Croatia, aged between 20 and 85 years. The participants were divided into seven age groups to account for age-related variability in anthropometric measurements.
For the purposes of the study, Croatia was divided into five regions: Gorsko-Primorska, Slavonia, Central Croatia, Dalmatia, and the City of Zagreb. The sample coverage within individual regions was as follows: 0.29% of women in Gorsko-Primorska, 0.26% in Slavonia, 0.22% in Central Croatia, 0.32% in Dalmatia, and 0.23% in the City of Zagreb.
The large and regionally diverse sample ensures the statistical reliability and representativeness of the collected anthropometric data.
2.2. Methods
Primary body measurements relevant to garment construction were collected, including bust girth, scye depth, and back width. All measurements were conducted according to standard anthropometric methods, in accordance with ISO 3635, ISO 8559, and EN 13402 standards, to ensure accuracy and consistency. Derived construction parameters, such as scye depth and back width, were calculated from the primary measurements using established proportional formulas.
Derived construction parameters were calculated from the primary anthropometric measurement, bust girth, using proportional formulas commonly applied in women’s garment construction [5,6]. Scye depth was determined using the following formula: scye depth = bust girth/10 + 10.5 cm, while back width was calculated using the following formula: back width = bust girth/8 + 5.5 cm. These proportional formulas are widely used in garment construction systems and were employed in this study as reference models for comparison with empirically measured values.
2.3. Statistics
Descriptive statistics were used to summarise measurements by age group and region. Two-way analysis of variance (ANOVA) was applied to examine differences associated with age and regional factors. Linear regression analysis was used to validate the mathematical derivation of the selected construction parameters [15,16].
This methodological approach provides a solid basis for integrating anthropometric data into CAD systems for accurate garment pattern development. Data description and analysis were performed using Statistica and SPSS software packages, supported by relevant scientific literature [17,18].
3. Results and Discussion
Using descriptive statistical methods, parameters of central tendency and dispersion for bust girth were estimated. The basic distribution parameters of bust girth are presented in Table 1 by region and age group. These data provide the basis for calculating derived construction parameters and highlight regional and age-related differences relevant to garment pattern construction.
Table 1
Basic parameters of the bust girth distribution of women (cm) by region and age group.
| Region | Age | Na | x̅b | sc | CVd (%) | 95% CIe | Range | ||
|---|---|---|---|---|---|---|---|---|---|
| h1 | h2 | Min. | Max. | ||||||
| Goransko primorska | –29 | 236 | 91.8 | 7.4 | 8.1 | 90.8 | 92.7 | 80.0 | 127.0 |
| 30–39 | 171 | 95.9 | 9.6 | 10.0 | 94.5 | 97.3 | 75.0 | 126.5 | |
| 40–49 | 179 | 100.0 | 10.1 | 10.1 | 98.5 | 101.5 | 78.0 | 132.0 | |
| 50–59 | 157 | 105.9 | 11.5 | 10.9 | 104.1 | 107.7 | 73.0 | 134.0 | |
| 60–69 | 125 | 107.5 | 10.0 | 9.3 | 105.7 | 109.3 | 80.0 | 130.0 | |
| 70–79 | 133 | 108.5 | 10.4 | 9.6 | 106.7 | 110.3 | 79.0 | 131.0 | |
| 80– | 103 | 104.5 | 11.9 | 11.4 | 102.2 | 106.8 | 68.0 | 132.0 | |
| Total | 1104 | 100.7 | 11.7 | 11.6 | 100.0 | 101.4 | 68.0 | 134.0 | |
| Slavonia | –29 | 243 | 89.7 | 7.6 | 8.5 | 88.8 | 90.7 | 71.0 | 122.0 |
| 30–39 | 121 | 91.9 | 7.5 | 8.2 | 90.6 | 93.3 | 79.0 | 113.0 | |
| 40–9 | 118 | 98.2 | 9.5 | 9.7 | 96.5 | 100.0 | 81.0 | 126.0 | |
| 50–59 | 109 | 100.8 | 11.4 | 11.3 | 98.6 | 103.0 | 78.0 | 134.0 | |
| 60–69 | 113 | 104.0 | 10.2 | 9.8 | 102.1 | 105.9 | 82.0 | 132.0 | |
| 70–79 | 126 | 105.2 | 9.7 | 9.2 | 103.4 | 106.9 | 81.0 | 134.0 | |
| 80- | 110 | 104.3 | 10.2 | 9.8 | 102.4 | 106.3 | 78.0 | 136.0 | |
| Total | 940 | 97.9 | 11.2 | 11.4 | 97.1 | 98.6 | 71.0 | 136.0 | |
| Central Croatia | –29 | 205 | 90.3 | 8.1 | 9.0 | 89.2 | 91.4 | 68.0 | 125.0 |
| 30–39 | 140 | 95.0 | 10.1 | 10.6 | 93.3 | 96.7 | 72.0 | 128.0 | |
| 40–49 | 140 | 97.8 | 11.4 | 11.7 | 95.9 | 99.7 | 72.0 | 134.0 | |
| 50–59 | 97 | 104.7 | 10.5 | 10.0 | 102.6 | 106.8 | 86.0 | 133.2 | |
| 60–69 | 96 | 107.4 | 13.0 | 12.1 | 104.8 | 110.1 | 76.0 | 137.0 | |
| 70–79 | 110 | 104.7 | 9.8 | 9.4 | 102.9 | 106.6 | 78.0 | 128.0 | |
| 80– | 107 | 101.9 | 11.8 | 11.6 | 99.6 | 104.1 | 76.0 | 129.0 | |
| Total | 895 | 98.8 | 12.0 | 12.1 | 98.0 | 99.6 | 68.0 | 137.0 | |
| Dalmatia | –29 | 253 | 91.2 | 6.2 | 6.8 | 90.5 | 92.0 | 73.5 | 111.0 |
| 30–39 | 175 | 93.5 | 6.4 | 6.8 | 92.6 | 94.5 | 80.0 | 112.0 | |
| 40–49 | 191 | 98.1 | 8.0 | 8.2 | 96.9 | 99.2 | 80.0 | 125.0 | |
| 50–59 | 147 | 102.6 | 9.3 | 9.1 | 101.1 | 104.2 | 82.5 | 134.0 | |
| 60–69 | 109 | 103.8 | 8.2 | 7.9 | 102.2 | 105.3 | 80.4 | 120.0 | |
| 70–79 | 119 | 103.3 | 11.5 | 11.1 | 101.2 | 105.4 | 66.0 | 142.0 | |
| 80– | 115 | 102.5 | 10.4 | 10.1 | 100.6 | 104.4 | 80.0 | 128.0 | |
| Total | 1109 | 98.0 | 9.7 | 9.9 | 97.4 | 98.6 | 66.0 | 142.0 | |
| City of Zagreb | –29 | 168 | 88.5 | 6.6 | 7.5 | 87.4 | 89.5 | 78.0 | 126.5 |
| 30–39 | 127 | 94.0 | 9.2 | 9.8 | 92.4 | 95.7 | 77.0 | 128.0 | |
| 40–49 | 154 | 98.2 | 9.4 | 9.6 | 96.7 | 99.7 | 78.0 | 129.0 | |
| 50–59 | 110 | 102.0 | 10.5 | 10.3 | 100.0 | 104.0 | 70.5 | 129.0 | |
| 60–69 | 87 | 105.1 | 11.4 | 10.8 | 102.7 | 107.5 | 83.0 | 131.0 | |
| 70–79 | 83 | 104.6 | 11.1 | 10.6 | 102.1 | 107.0 | 69.0 | 131.5 | |
| 80– | 70 | 107.2 | 11.6 | 10.8 | 104.4 | 109.9 | 79.0 | 127.0 | |
| Total | 799 | 98.2 | 11.6 | 11.8 | 97.4 | 99.0 | 69.0 | 131.5 | |
The variability of bust girth ranged from approximately 7% in the youngest age groups and gradually increased with age, reaching up to 12% in the oldest groups (Table 1). A linear increase in average bust girth was observed up to the 60–69 age group, followed by stagnation and a slight decrease in the oldest age group across all regions of the Republic of Croatia. Differences between the youngest women and those over 60 years of age ranged from 10 to 15 cm, and in the City of Zagreb reached nearly 20 cm.
These results highlight age- and region-specific variations that are crucial for the accurate calculation of derived construction parameters and for ensuring proper garment fit. They also provide a basis for validating CAD algorithms and adapting construction parameters to the actual body dimensions of the target population.
The average bust girth values presented in Table 1 formed the basis for calculating derived construction parameters. These data were used for further development and adjustment of construction parameters. Using descriptive statistical methods, parameters of central tendency and dispersion were estimated for scye depth. The basic distribution indicators of empirically obtained scye depth values are presented in Table 2, classified by region and age group within each region of the Republic of Croatia.
Table 2
Basic parameters of the scye depth distribution of women (cm) by region and age group.
| Region | Age | Na | x̅b | sc | CVd (%) | 95% CIe | Range | ||
|---|---|---|---|---|---|---|---|---|---|
| h 1 | h 2 | Min. | Max. | ||||||
| Goransko-primorska | –29 | 236 | 18.1 | 2.3 | 12.7 | 17.8 | 18.4 | 12.0 | 25.0 |
| 30–39 | 171 | 18.9 | 2.5 | 13.0 | 18.5 | 19.3 | 11.5 | 26.0 | |
| 40–49 | 179 | 19.8 | 3.4 | 17.1 | 19.3 | 20.3 | 12.0 | 31.5 | |
| 50–59 | 157 | 19.7 | 2.8 | 14.3 | 19.3 | 20.2 | 13.0 | 30.0 | |
| 60–69 | 125 | 20.5 | 2.3 | 11.5 | 20.1 | 20.9 | 14.0 | 27.0 | |
| 70–79 | 133 | 21.2 | 3.3 | 15.6 | 20.6 | 21.7 | 13.0 | 32.0 | |
| 80 | 103 | 21.9 | 3.6 | 16.6 | 21.2 | 22.6 | 14.0 | 33.0 | |
| Total | 1104 | 19.7 | 3.1 | 15.7 | 19.5 | 19.9 | 11.5 | 33.0 | |
| Slavonia | –29 | 243 | 17.6 | 2.1 | 11.7 | 17.4 | 17.9 | 12.5 | 26.0 |
| 30–39 | 121 | 17.8 | 2.2 | 12.5 | 17.4 | 18.2 | 12.0 | 23.0 | |
| 40–49 | 118 | 18.2 | 2.1 | 11.7 | 17.9 | 18.6 | 14.0 | 26.0 | |
| 50–59 | 109 | 19.1 | 3.1 | 16.1 | 18.5 | 19.6 | 15.0 | 28.0 | |
| 60–69 | 113 | 18.8 | 2.2 | 11.7 | 18.4 | 19.2 | 15.0 | 25.0 | |
| 70–79 | 126 | 19.5 | 2.4 | 12.2 | 19.1 | 19.9 | 14.0 | 26.0 | |
| 80– | 110 | 19.0 | 2.7 | 14.3 | 18.5 | 19.5 | 10.0 | 28.0 | |
| Total | 940 | 18.4 | 2.5 | 13.3 | 18.3 | 18.6 | 10.0 | 28.0 | |
| Central Croatia | –29 | 205 | 19.2 | 2.6 | 13.4 | 18.8 | 19.5 | 12.0 | 25.6 |
| 30–39 | 140 | 19.3 | 2.7 | 13.8 | 18.8 | 19.7 | 11.0 | 26.0 | |
| 40–49 | 140 | 20.2 | 2.4 | 11.9 | 19.8 | 20.6 | 14.5 | 26.0 | |
| 50–59 | 97 | 20.0 | 2.5 | 12.5 | 19.5 | 20.5 | 14.0 | 26.0 | |
| 60–69 | 96 | 22.0 | 3.1 | 13.9 | 21.4 | 22.7 | 15.0 | 32.0 | |
| 70–79 | 110 | 20.8 | 2.7 | 12.8 | 20.3 | 21.3 | 14.0 | 28.0 | |
| 80– | 107 | 20.4 | 2.8 | 13.9 | 19.9 | 21.0 | 14.0 | 28.0 | |
| Total | 895 | 20.1 | 2.8 | 13.9 | 19.9 | 20.3 | 11.0 | 32.0 | |
| Dalmatia | –29 | 253 | 19.4 | 3.1 | 16.1 | 19.0 | 19.8 | 13.2 | 30.0 |
| 30–39 | 175 | 19.5 | 3.0 | 15.5 | 19.1 | 20.0 | 15.2 | 29.0 | |
| 40–49 | 191 | 19.8 | 3.2 | 16.2 | 19.3 | 20.2 | 13.5 | 30.0 | |
| 50–59 | 147 | 20.4 | 3.4 | 16.5 | 19.9 | 21.0 | 16.0 | 33.0 | |
| 60–69 | 109 | 19.7 | 2.6 | 13.4 | 19.2 | 20.2 | 15.9 | 27.0 | |
| 70–79 | 119 | 20.0 | 3.0 | 15.0 | 19.5 | 20.6 | 14.0 | 29.0 | |
| 80– | 115 | 20.0 | 3.4 | 16.9 | 19.3 | 20.6 | 12.9 | 29.0 | |
| Total | 1109 | 19.8 | 3.1 | 15.8 | 19.6 | 20.0 | 12.9 | 33.0 | |
| City of Zagreb | –29 | 168 | 16.5 | 2.4 | 14.4 | 16.1 | 16.9 | 12.0 | 26.0 |
| 30–39 | 127 | 16.7 | 1.8 | 11.0 | 16.4 | 17.1 | 11.0 | 23.3 | |
| 40–49 | 154 | 17.1 | 2.4 | 13.8 | 16.8 | 17.5 | 11.0 | 26.0 | |
| 50–59 | 110 | 17.5 | 2.3 | 13.2 | 17.1 | 17.9 | 12.0 | 23.0 | |
| 60–69 | 87 | 20.0 | 2.2 | 11.0 | 19.6 | 20.5 | 14.0 | 26.0 | |
| 70–79 | 83 | 19.3 | 2.6 | 13.6 | 18.7 | 19.9 | 13.0 | 24.7 | |
| 80– | 70 | 20.6 | 2.3 | 11.1 | 20.1 | 21.2 | 11.0 | 24.0 | |
| Total | 799 | 17.8 | 2.7 | 15.1 | 17.7 | 18.0 | 11.0 | 26.0 | |
The results of the analysis of variance (ANOVA), used to test the hypothesis of equality of mean scye depth across regions and age groups (Table 3), show statistically significant differences for both factors, with a significant interaction between them. Scye depth increased with age in all regions by 1–2 cm, and in the City of Zagreb by approximately 4 cm. Given the acceptable variability and approximately normal distribution of scye depth, these data are suitable for further statistical analysis.
Table 3
Results of the analysis of differences in mean scye depth of women by region and age group (two-way analysis of variance model).
| Source of variability | SSa | dfb | MSc | Fd | p e | |
|---|---|---|---|---|---|---|
| Differences | Region | 2716.064 | 4 | 679.016 | 92.442 | <0.001 |
| Age | 3328.466 | 6 | 554.744 | 75.524 | <0.001 | |
| Interaction | Region × Age | 1440.642 | 24 | 60.027 | 8.172 | <0.001 |
| Model | 7874.729 | 34 | 231.610 | 31.532 | <0.001 | |
| Residual | 35345.502 | 4812 | 7.345 | |||
| Total | 43220.231 | 4846 | 8.919 | |||
The relationship between mathematically and empirically determined scye depth is illustrated in Figure 2. The slopes of both the mathematical model and the regression line are almost identical, with the primary difference being that the mathematical model tends to slightly overestimate scye depth compared to the linear model. The highest scye depth measurements were found in women from Central Croatia and the Gorsko-Primorska region, while the lowest values appeared in younger women (under 50 years) in the City of Zagreb and across all age groups in Slavonia.
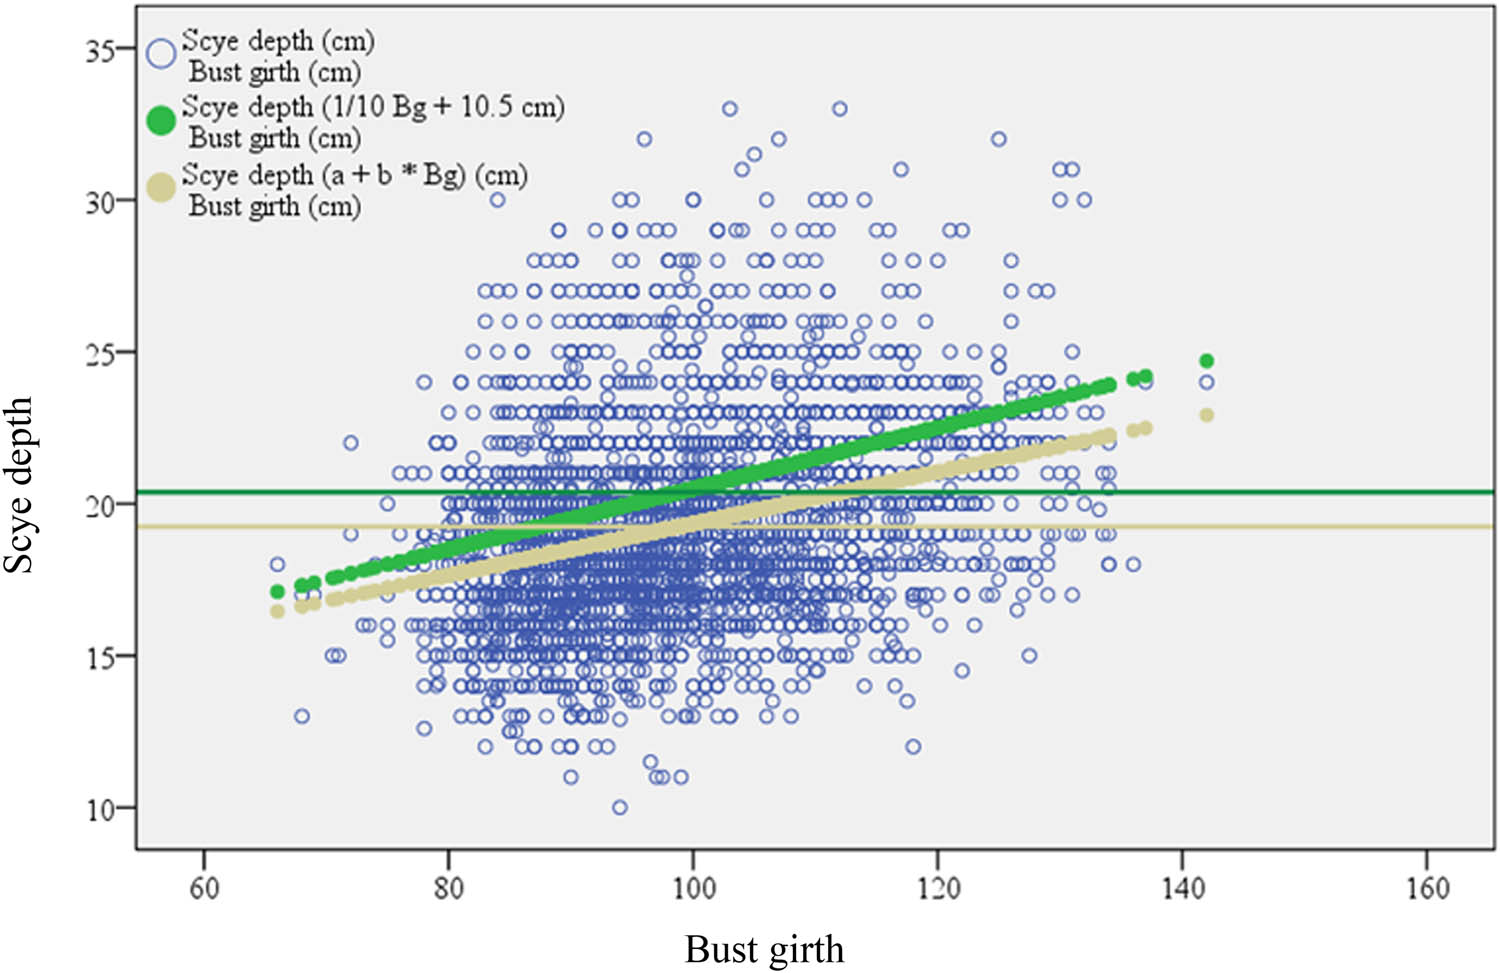
Figure 2
Relationship between empirical, mathematical, and estimated values of women’s scye depth in relation to bust girth (N = 4,847).
The mathematical determination of scye depth, calculated as one-tenth of the bust girth plus 10.5 cm, was validated through linear regression analysis. In this analysis, empirical scye depth values served as the dependent variable, and bust girth was the independent variable. Both the regression constant (10.85, approximately 11 cm, p < 0.001) and the slope of the regression line (0.085, roughly 1/12, p < 0.001) were statistically significant. The model’s coefficient of determination was modest (R 2 = 10.2%), suggesting that other factors also contribute to the variability in scye depth.
The obtained regression coefficients closely align with the mathematical formula used to determine scye depth in women. These findings confirm that the formula serves as a reliable approximation for garment pattern construction in CAD systems, while also highlighting the presence of additional factors that contribute to variability.
Table 4 shows the basic distribution parameters of back width across different regions of the Republic of Croatia and corresponding age groups. In all regions, back width increases until around age 60, after which it stabilises. The highest back width values were observed in women from Dalmatia up to older ages, after which women from the City of Zagreb exhibit higher measurements. Other regions display lower and relatively consistent back width values across all age groups.
Table 4
Basic parameters of the back width distribution of women (cm) by region and age group.
| Region | Age | Na | x̅b | sc | CVd (%) | 95% CIe | Range | ||
|---|---|---|---|---|---|---|---|---|---|
| h1 | h2 | Min. | Max. | ||||||
| Goransko-primorska | –29 | 236 | 34.8 | 3.5 | 10.1 | 34.4 | 35.3 | 26.0 | 48.0 |
| 30–39 | 171 | 36.7 | 3.7 | 10.1 | 36.1 | 37.2 | 29.0 | 47.0 | |
| 40–49 | 179 | 37.7 | 4.1 | 10.9 | 37.1 | 38.3 | 27.0 | 49.0 | |
| 50–59 | 157 | 38.9 | 4.0 | 10.3 | 38.3 | 39.5 | 28.5 | 49.0 | |
| 60–69 | 125 | 39.5 | 3.7 | 9.3 | 38.9 | 40.2 | 30.0 | 50.0 | |
| 70–79 | 133 | 39.4 | 4.6 | 11.6 | 38.6 | 40.2 | 26.0 | 48.0 | |
| 80– | 103 | 37.8 | 5.3 | 14.1 | 36.8 | 38.8 | 24.0 | 48.0 | |
| Total | 1104 | 37.5 | 4.4 | 11.7 | 37.3 | 37.8 | 24.0 | 50.0 | |
| Slavonia | –29 | 243 | 34.6 | 3.3 | 9.6 | 34.1 | 35.0 | 24.2 | 50.0 |
| 30–39 | 121 | 35.2 | 3.2 | 9.2 | 34.6 | 35.7 | 27.0 | 49.0 | |
| 40–49 | 118 | 36.4 | 3.2 | 8.9 | 35.8 | 37.0 | 29.0 | 45.0 | |
| 50–59 | 109 | 37.8 | 3.6 | 9.4 | 37.1 | 38.5 | 29.5 | 47.0 | |
| 60–69 | 113 | 37.9 | 3.2 | 8.3 | 37.3 | 38.5 | 31.0 | 48.0 | |
| 70–79 | 126 | 38.0 | 3.2 | 8.5 | 37.5 | 38.6 | 27.0 | 49.0 | |
| 80– | 110 | 37.8 | 3.7 | 9.8 | 37.1 | 38.5 | 27.0 | 48.0 | |
| Total | 940 | 36.5 | 3.6 | 10.0 | 36.3 | 36.7 | 24.2 | 50.0 | |
| Central Croatia | –29 | 205 | 34.3 | 3.9 | 11.3 | 33.8 | 34.8 | 26.0 | 46.0 |
| 30–39 | 140 | 36.1 | 4.3 | 11.9 | 35.4 | 36.8 | 24.0 | 47.0 | |
| 40–49 | 140 | 36.4 | 4.4 | 12.0 | 35.6 | 37.1 | 28.0 | 51.0 | |
| 50–59 | 97 | 37.7 | 4.2 | 11.2 | 36.8 | 38.5 | 30.0 | 48.0 | |
| 60–69 | 96 | 37.3 | 4.8 | 12.9 | 36.3 | 38.3 | 29.0 | 50.0 | |
| 70–79 | 110 | 37.7 | 4.5 | 12.0 | 36.8 | 38.5 | 28.0 | 50.0 | |
| 80– | 107 | 37.2 | 4.5 | 12.1 | 36.3 | 38.0 | 27.0 | 50.0 | |
| Total | 895 | 36.4 | 4.5 | 12.3 | 36.1 | 36.6 | 24.0 | 51.0 | |
| Dalmatia | –29 | 253 | 34.2 | 3.5 | 10.2 | 33.8 | 34.6 | 24.5 | 44.0 |
| 30–39 | 175 | 35.4 | 3.4 | 9.7 | 34.9 | 36.0 | 25.0 | 44.0 | |
| 40–49 | 191 | 36.5 | 3.7 | 10.2 | 36.0 | 37.0 | 26.0 | 48.0 | |
| 50–59 | 147 | 37.3 | 4.0 | 10.6 | 36.7 | 38.0 | 27.0 | 49.0 | |
| 60–69 | 109 | 37.9 | 3.4 | 8.9 | 37.2 | 38.5 | 26.5 | 47.0 | |
| 70–79 | 119 | 37.2 | 4.2 | 11.2 | 36.4 | 38.0 | 27.5 | 47.0 | |
| 80– | 115 | 36.8 | 3.9 | 10.6 | 36.1 | 37.5 | 28.0 | 47.0 | |
| Total | 1109 | 36.2 | 3.9 | 10.8 | 35.9 | 36.4 | 24.5 | 49.0 | |
| City of Zagreb | –29 | 168 | 33.5 | 3.6 | 10.7 | 33.0 | 34.1 | 26.0 | 44.0 |
| 30–39 | 127 | 35.9 | 3.6 | 10.0 | 35.3 | 36.6 | 27.0 | 47.0 | |
| 40–49 | 154 | 36.2 | 3.5 | 9.7 | 35.6 | 36.8 | 27.0 | 44.0 | |
| 50–59 | 110 | 37.6 | 3.4 | 9.1 | 36.9 | 38.2 | 29.0 | 45.5 | |
| 60–69 | 87 | 40.6 | 3.6 | 9.0 | 39.8 | 41.3 | 32.0 | 51.0 | |
| 70–79 | 83 | 39.7 | 4.7 | 11.9 | 38.6 | 40.7 | 28.0 | 51.0 | |
| 80– | 70 | 41.1 | 4.3 | 10.4 | 40.1 | 42.2 | 29.0 | 48.0 | |
| Total | 799 | 37.0 | 4.5 | 12.2 | 36.7 | 37.4 | 26.0 | 51.0 | |
The analysis of variance model used to test the hypothesis of equal mean back width across regions and age groups (Table 5) revealed statistically significant differences for both factors. Additionally, a significant interaction between region and age group was observed.
Table 5
Results of the analysis of differences in mean back width of women by region and age group (two-way ANOVA model).
| Source of variability | SSa | dfb | MSc | Fd | p e | |
|---|---|---|---|---|---|---|
| Differences | Region | 1535.944 | 4 | 383.986 | 25.903 | <0.001 |
| Age | 12223.705 | 6 | 2037.284 | 137.429 | <0.001 | |
| Interaction | Region × Age | 1856.509 | 24 | 77.355 | 5.218 | <0.001 |
| Model | 14864.257 | 34 | 437.184 | 29.491 | <0.001 | |
| Residual | 71334.208 | 4812 | 14.824 | |||
| Total | 86198.465 | 4846 | 17.788 | |||
The validation of the back width construction formula, defined as one-eighth of the bust girth plus 5.5 cm, was conducted using linear regression analysis. In this model, empirical back width values served as the dependent variable, and bust girth was the independent variable. Both the regression constant (14.0, approximately 14 cm, p < 0.001) and the regression coefficient (0.23, roughly 1/4, p < 0.001) were statistically significant. The model’s coefficient of determination was satisfactory (R 2 = 37.7%), indicating that bust girth is a strong predictor of back width. Since the regression analysis was conducted using the measured full back width, whereas garment construction is based on half back width, the proposed proportional construction formula was expressed in line with the construction methodology. Accordingly, the regression constant of 14 cm corresponds to 7 cm in the construction formula, and the regression coefficient (0.23 ≈ 1/4) corresponds to approximately 1/8. This conversion formed the basis for proposing the improved proportional formula for practical garment construction.
The converted proportional formula (bust girth/8 + 7 cm) closely reflects the relationship identified by the regression analysis and provides a practical approximation for garment construction.
This agreement among empirical, mathematical, and estimated values is clearly depicted in Figure 3.
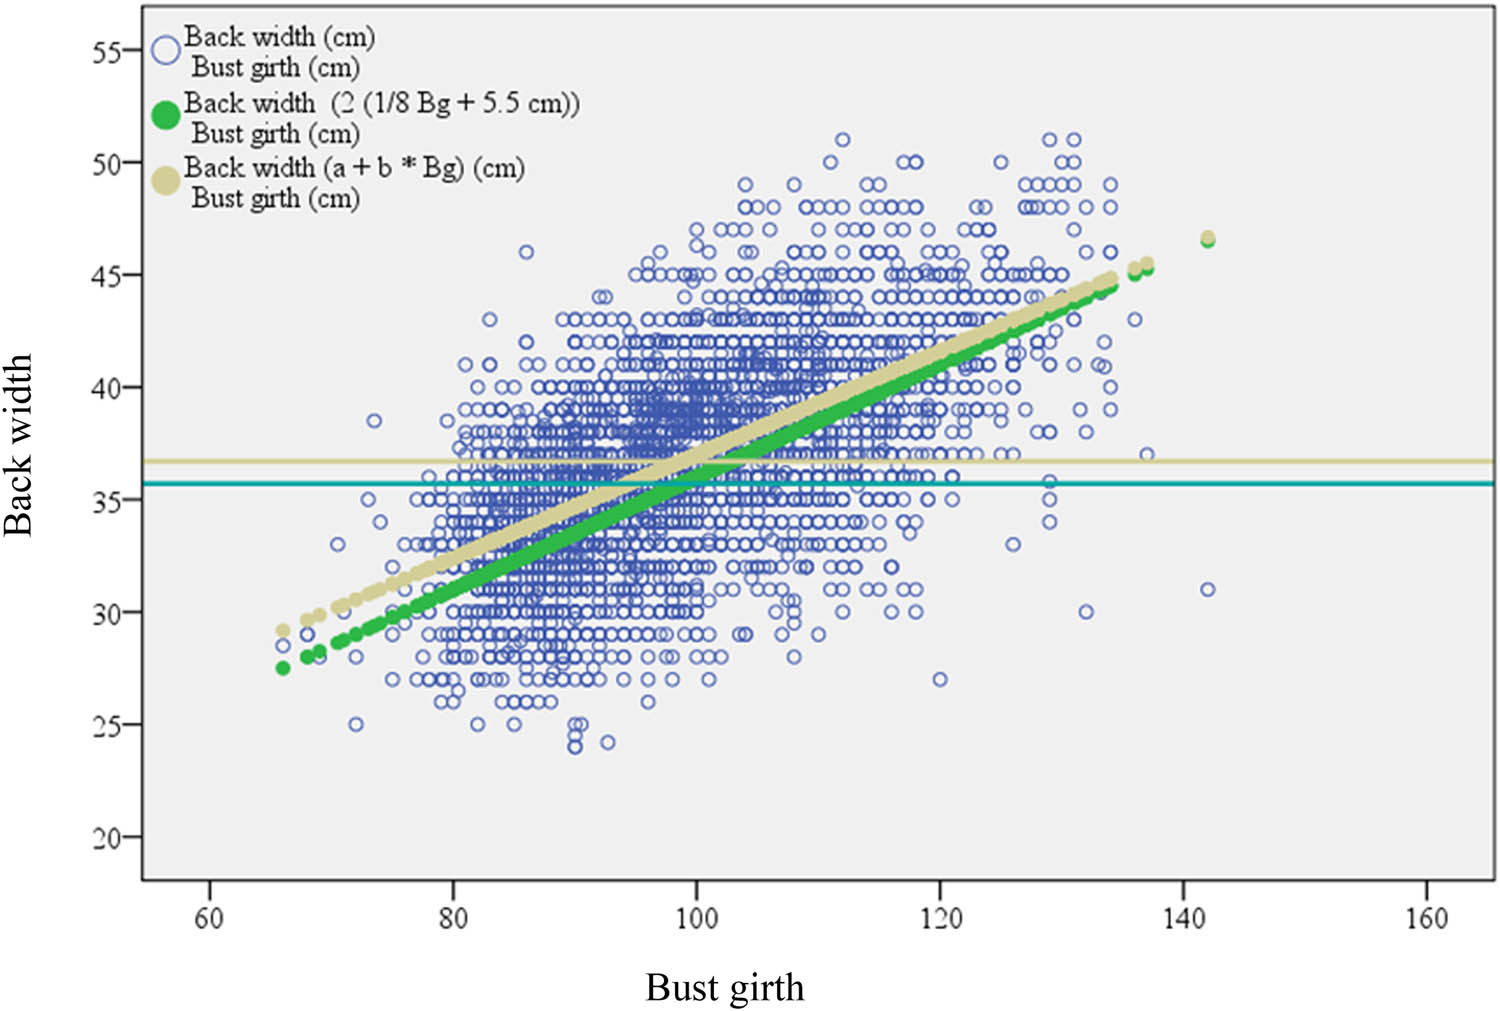
Figure 3
Relationship between empirical, mathematical, and estimated values of women’s back width in relation to bust girth (N = 4,847).
Notably, back width estimated from bust girth generally aligns better with the mathematical model than with directly measured empirical values.
The observed differences can be attributed to a combination of genetic, environmental, and lifestyle factors that influence body proportions across various regions and age groups [19].
The results obtained confirm the importance of considering anthropometric variability in the development of garment construction methods. The discrepancies observed between empirically measured and mathematically calculated construction parameters indicate the need for periodic validation of proportional construction formulas using up-to-date anthropometric data. These findings are consistent with previous studies showing that regularly updating anthropometric databases contributes to the development of more accurate garment construction methods and digital systems for apparel product development [11,12,13,14].
Furthermore, the results showed that the proportional formulas currently used to determine scye depth and back width do not fully reflect the anthropometric characteristics of the studied population. A comparison of empirically measured values with those calculated using the existing construction formulas revealed systematic discrepancies, indicating the need for refinement.
Based on the results of the regression analyses and empirical anthropometric measurements, improved proportional formulas are proposed that more accurately represent the anthropometric characteristics of the studied female population. The proposed formulas are presented in Table 6.
Table 6
Comparison of existing and proposed proportional construction formulas.
| Construction parameter | Existing proportional formula | Proposed proportional formula |
|---|---|---|
| Scye depth | Bust girth/10 + 10.5 cm | Bust girth/12 + 11 cm |
| Back width | Bust girth/8 + 5.5 cm | Bust girth/8 + 7 cm |
The proposed formulas are based on empirically established relationships between bust girth and the analysed construction parameters, providing practical guidance for improving existing proportional construction methods. Their application may contribute to more accurate determination of construction parameters, better pattern adaptation to the anthropometric characteristics of the target female population, and reduced discrepancies between construction parameters and actual body measurements.
Furthermore, more precise definition of construction parameters may reduce the need for subsequent pattern modifications and the production of multiple prototypes, improve material utilisation, and support the development of more sustainable garment construction and manufacturing processes.
The results of this study cannot be directly compared with existing clothing size systems, as these are based on primary body dimensions (body height, bust girth, waist girth and hip girth), whereas the present study focused on proportional construction parameters used in garment construction. The findings contribute to improving garment construction methods and may serve as a basis for the further development of anthropometry-based construction parameters that complement existing clothing size systems.
4. Conclusion
Systematic, precise monitoring of anthropometric variability plays a key role in improving industrial garment production. This study identified statistically significant differences in construction parameters associated with age and regional affiliation, confirming the importance of analysing subpopulations when developing garment construction methods. The large, representative sample enabled reliable empirical validation of proportional construction formulas and the identification of discrepancies between empirically measured and mathematically calculated values.
The results showed that the existing proportional formulas do not fully reflect the anthropometric characteristics of the contemporary female population in Croatia. Based on the regression analyses, new formulas were proposed for determining scye depth (1/12 × bust girth + 11 cm) and back width (1/8 × bust girth + 7 cm), providing a practical recommendation for more accurate women’s garment construction.
The application of empirically validated construction parameters may contribute to improvements in CAD systems, more accurate determination of construction parameters, enhanced garment fit, and more efficient, sustainable garment production. Furthermore, the findings provide a foundation for the further development of anthropometry-based garment construction methods and their application in contemporary apparel product development.
Acknowledgement
The publication of the work is a result of the implementation of the institutional research project “Development of Sustainable Clothing With Added Value,” RoDv, TTF-IIP-05, funded by the European Union – NextGenerationEU.
Funding information
This research was conducted within the framework of the project “Development of Sustainable Clothing with Added Value” (RoDv), project code TTF-IIP-05, funded by the European Union – NextGenerationEU.
Author contributions
KD: Conceptualization, Methodology, Investigation, Data analysis, Writing – original draft, Writing – review and editing. RH: Methodology, Investigation, Data analysis, Review and editing. BBŠ: Methodology, Investigation, Data analysis, Review and editing. All authors have read and approved the final version of the manuscript.
Conflicts of interest statement
The authors declare no conflict of interest.
Informed consent statement
All measurements were conducted anonymously. In accordance with the national regulations in effect at the time of data collection, written informed consent was not required for non-invasive studies involving adult participants.