
Introduction
Afforestation belts are important in forest reclamation (Jose, 2009; Vysotska et al., 2019). Studying afforestation belts in Ukraine is a long-term process (Dubyna et al., 2023) and has a fragmentary and multifaceted character (Gapon, 2016; Hetman, 2023; Sydorenko & Sydorenko, 2018; Tkachuk & Pankova, 2021; Vysotska et al., 2019, 2021). They were formed in Ukraine as an element of a complex of agrotechnical measures for the preservation and industrial cultivation of crops on arable land (Tkachuk & Viter, 2022). Today, afforestation belts cover a significant length of land, have an artificial (transformed) vegetation character, and serve as migration routes for the spread of many alien and potentially dangerous biota species.
According to the Ukrainian biotope classification scheme, they should be classified as (I4.11) artificially created biotopes with tree dominance (Didukh et al., 2011) or (C2.2.1) parks and squares (Kuzemko et al., 2018). Their linear configuration, narrow width, and susceptibility to wind are the defining features of their spatial structure. A notable and specific aspect of their origin and development is the predominantly artificial establishment of the woody layer and, in some cases, the herbaceous layer. The extended boundary with agricultural lands (primarily croplands), where persistent and intensive technogenic and anthropogenic influences (such as pesticides, fertilizers, and anthropochory) are present, further shapes the subsequent development and functioning of this floristic complex. Taken together, these factors, amplified by the ongoing hostilities in eastern and southern Ukraine, accelerate the transformation of forest belt vegetation and facilitate the spread of alien species. Their impact on vegetation dynamics is particularly pronounced in areas subject to heightened human pressure. Due to the high percentage of dry land plowing (over 60%), intensive agricultural production, and extensive lengths of afforestation belts, the Left-Bank Forest-Steppe of Ukraine has been selected as a representative model territory.
Human-altered and linear habitats often harbor distinct floristic patterns and higher proportions of non-native species compared to surrounding natural vegetation (Kowarik, 2011; Pyšek et al., 2010). Structural analyses across temperate landscapes show that life-form composition and ecological strategies in synanthropic vegetation reflect gradients of disturbance and land-use intensity (Chytrý, 2001). Studies in Central and Eastern Europe have documented that roadside, urban, and agricultural edge communities frequently differ from regional background floras in species richness, functional group representation, and alien species contributions (Opálková & Cimalová, 2011; Ziaja & Wójcik, 2015). These broader patterns provide a continental context for understanding how afforestation belts in agricultural landscapes may act as reservoirs and conduits for both native and alien plant assemblages.
This study aims to analyze the floristic composition and structural organization of the synanthropic flora within the afforestation belts of the Left-Bank Forest-Steppe, to identify its distinctive features, evaluate the status of vegetation transformation, and elucidate the potential invasion pathways and migration dynamics of undesirable – primarily alien – plant species.
Materials and Methods
Study area
The Left-Bank Forest-Steppe encompasses the Dnipro Lowland and the southwestern slopes of the Central Russian Upland (Bondar & Tkach, 2021). The study area is located within the Kyiv, Cherkasy, Chernihiv, and Poltava, Kharkiv, and Sumy regions, excluding the northern part (Figure 1). The climate in this area is classified as continental, specifically characterized as the Atlantic-continental forest climate (Bondar & Tkach, 2021; Marynych et al., 1982; Verbytska, 2012). The annual temperature variation is 27.4°C, with 98.3°C for the sum of average monthly positive temperatures. Annual precipitation ranges from 457 to 614 mm. Based on forest typological zoning, the Left-Bank Forest-Steppe region falls under the classification of a fresh, moderately warm climate (fresh frost 2d) (Bondar & Tkach, 2021).
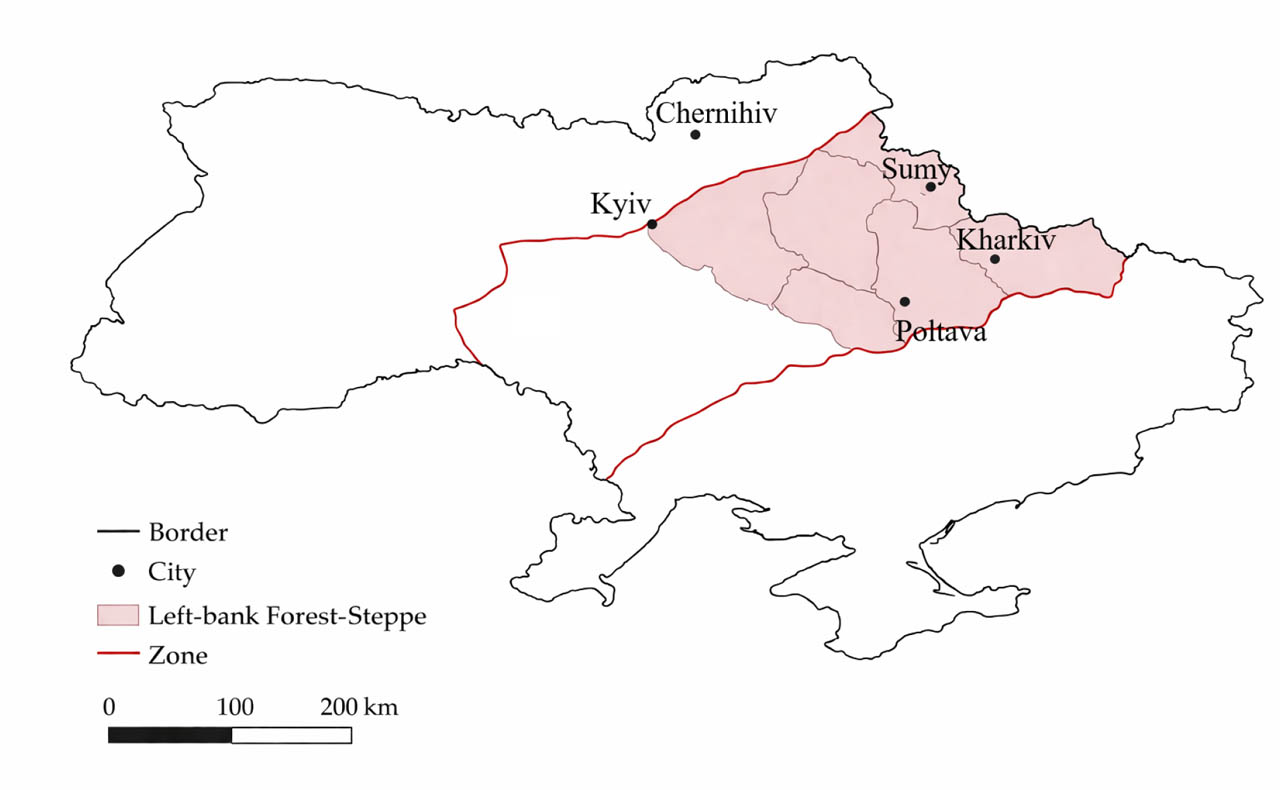
Figure 1.
The map scheme of the Left-Bank Forest-Steppe of Ukraine.
The zonal soils of the Left-Bank Forest-Steppe include typical chernozems, as well as podzolized, leached, regarded, and gray podzolized soils (Balaev et al., 2005). The study area encompasses two water basins: the Dnipro (Sula, Psel, and Vorskla catchments) and the Don (Siversky Donets catchment) (Bondar & Tkach, 2021; Khilchevskyi et al., 2014).
The area's surface is characterized by a series of accumulative terraces that vary in age (Balaev et al., 2005). The largest area comprises a forest terrace of middle-anthropogenic age, featuring fertile chernozem soils. During the agricultural development of these territories, almost the entire surface of this terrace was used for field crop cultivation.
Data collection and analysis
The study is based on original data collected from our field research between 2019 and 2021. A total of 298 relevés represent the studied vegetation. The size of the selected plots varied between 100 and 300 m2 along the routes. The data were collected using traditional methods, which included recording species composition, the projective cover of plant species, and the layer structure of the community.
The analysis algorithm included the following stages:
Field data, including species lists, abundance and frequency data, and vegetation plot information.
Harmonized data (unified taxonomy).
Species classification includes the following categories: natural, semi-natural, and alien species, apophytes, which are further divided into subcategories.
Analysis of species frequency (constancy and abundance).
Analysis of flora structure (species proportions by families, bimorphs, and phytosociological types).
Analysis of community structure (layer-forming species and phytosociological characteristics).
Species composition and occurrence rates were entered into the database using the Turboveg program (Hennekens & Schaminée, 2001).
For unification, the taxonomic names of the species were aligned with the EuroMed PlantBase checklist (Euro+Med. 2006). For each species, we calculated an indicator of constancy that reflects the frequency of occurrence, along with the average projective coverage expressed as a percentage. To assess the significance of various species and their environmental impact on the vegetation cover of afforestation belts, we utilized the geometric mean of species constancy and coverage as a combined indicator.
Further analysis was conducted by categorizing species into three groups: natural, apophytic, and alien species.
The analysis of the taxonomic structure of the flora included the distribution of species across different families. The analysis of the morphological structure of the alien flora in the studied region is based on Raunkiaer's (1937) biological types and Serebryakov's (1962) life forms systems. For the phytosociological classification of species, we utilized the diagnostic species classification among vegetation classes based on the Euroveg Checklist (Mucina et al., 2016). Studying these structures is significant because they demonstrate specific adaptive strategies of various species (Grime, 1977). Taxonomic groups, particularly families, encompass a diverse array of complex evolutionary adaptations, morphological traits, and reproductive strategies. The distribution of plant species is largely shaped by their life forms in interaction with environmental conditions. Phytosociological types unite species based on similar ecological and coenotic preferences, as well as their niche positions. When calculating the frequencies of species across families and biomorphs, we considered their presence or absence based on species lists. The proportions of phytosociological types were calculated, divided by the sum of species constancy and abundance, resulting in a weighted approach. All proportions were calculated separately for the natural (Nat), apophytic (Apo), and alien (Aln) flora of afforestation belts.
Statistical analyses were performed in R version 4.4.3 (R Core Team, 2024). Differences in the taxonomic structure of plant families among natural, apophytic and alien fractions of the flora were explored using multivariate methods implemented in the vegan package (Oksanen et al., 2024). Community dissimilarity was quantified using the Bray–Curtis distance, which is appropriate for proportional compositional data and is widely applied in ecological studies of community structure (Bray & Curtis, 1957; Legendre & Legendre, 2012).
To formally assess differences among flora fractions, the permutational multivariate analysis of variance (PERMANOVA) was applied using the adonis2 function in vegan (Anderson, 2001). PERMANOVA is a distance-based, non-parametric method that does not assume multivariate normality and accommodates datasets with percentages and zero values common in ecological community data (Anderson, 2017). However, in the present study, each flora fraction was represented by a single compositional profile, resulting in an absence of within-group replication. Consequently, the residual degrees of freedom were zero, preventing calculation of F- and p-values, and precluding formal inferential testing. For the same reason, other univariate non-parametric tests such as Kruskal-Wallis or Friedman tests (Siegel & Castellan, 1988), which require multiple independent observations per group to estimate within-group variance, were likewise inapplicable. Rank-based comparisons without replication cannot produce valid test statistics because no estimate of error variation is available (Conover, 1999).
To identify the plant families contributing most to the observed dissimilarities between flora fractions, the SIMPER (Similarity Percentage) analysis was conducted using the simper function in vegan (Clarke, 1993; Clarke & Warwick, 2001). SIMPER decomposes the Bray–Curtis dissimilarity into contributions of individual variables and is commonly used as a descriptive tool in community ecology when formal hypothesis testing is constrained by data structure. Given the lack of replication, SIMPER results were interpreted descriptively, focusing on the ranking of families by their average contribution and on cumulative contributions to total dissimilarity, rather than on permutation-based significance testing.
All multivariate analyses and graphical outputs were produced in R, following standard practices in ecological and floristic research.
Results
Taxonomic structure of the flora
According to preliminary data, the flora of the afforestation belts in the studied region includes 235 species of higher vascular plants belonging to 162 genera and 54 families. This represents 14.6% of the plant species diversity found in the Left-Bank Forest-Steppe region. (Bayrak, 1997). Considering the specific details regarding the origin and development of the regional flora component selected for analysis, this indicator holds significant importance.
The list of the ten most numerous species families (Table 1) represents the flora of the Holarctic region (Tolmachev, 1974).
Table 1.
Taxonomic structure of the flora in the studied afforestation belts.
| Nat | Apo | Al | ||
|---|---|---|---|---|
| Asteraceae | 14.5 | 2.3 | 25.6 | 16.9 |
| Rosaceae | 9.8 | 17 | 3.7 | 7.7 |
| Poaceae | 6.8 | 9.1 | 4.9 | 6.7 |
| Apiaceae | 6.8 | 1.1 | 14.6 | 4.6 |
| Lamiaceae | 4.7 | 2.3 | 6.1 | 6.2 |
| Caryophyllaceae | 4.3 | 2.3 | 8.5 | 1.5 |
| Fabaceae | 3.4 | 2.3 | 2.4 | 6.2 |
| Sapindaceae | 2.6 | 3.4 | 0 | 4.6 |
| Brassicaceae | 2.6 | 0 | 2.4 | 6.2 |
| Cyperaceae | 2.1 | 5.7 | 0 | 0 |
| Other | 42.4 | 54.5 | 31.8 | 39.9 |
| Sum of the first 10 | 57.6 | 45.5 | 68.2 | 60.1 |
The taxonomic structure of the studied flora demonstrates that a limited number of plant families (Table 1) primarily drives differences among natural, apophytic, and alien fractions. The first ten families account for 57.6% of the total flora, while their contribution is higher in the apophytic (68.2%) and alien (60.1%) fractions compared to the natural one (45.5%). The SIMPER analysis showed that a few dominant families, particularly Asteraceae, Apiaceae, and Rosaceae, with additional influence of Brassicaceae, Lamiaceae, and Caryophyllaceae in specific pairwise comparisons, provide the main contribution to compositional dissimilarity. Due to the absence of within-group replication, PERMANOVA and other inferential statistical tests were not applicable; therefore, the observed patterns should be interpreted as descriptive. Overall, differentiation among flora fractions reflects shifts in the relative importance of dominant families rather than uniform changes across the entire taxonomic spectrum (Table 1).
The ratio of the species number of separate families is interesting in terms of characterizing the structural features of the studied floras (Table 2). In particular, the zonal index of the studied floristic complex, calculated as the ratio of the number of species of the boreal family Cyperaceae and the temperate family Fabaceae is 0.625.
Table 2.
Comparison of separate indicators in the compared floras.
| Flora of the afforestation belts of the studied region | Flora of the Left-Bank Forest-Steppe (Bayrak, 1997) | Forest and shrub flora of the Northern Black Sea region (Solomakha et al., 2015) | Flora of Southeastern Ukraine (Burda, 1991) | |
|---|---|---|---|---|
| Asteraceae/Cyperaceae | 6.8 | 2.59 | 4.7 | 3.6 |
| Asteraceae/Poaceae | 2.125 | 1.5 | 1.57 | 1.56 |
| Cyperaceae/Fabaceae | 0.625 | 0.94 | 0.547 | 0.631 |
| Number of species/genera | 1.45 | 2.77 | 2.33 | 3.1 |
The ratio of Asteraceae to Cyperaceae in the studied flora (6.8) substantially exceeds the corresponding values reported for other regional floras, indicating a markedly reduced role of hygrophilous boreal elements and a stronger representation of drought-tolerant taxa (Table 2). A similar pattern is observed for the Asteraceae/Poaceae ratio, which is also higher than in the compared floras, reflecting the dominance of ruderal and anthropogenically adapted species typical of disturbed habitats. In contrast, the Cyperaceae/Fabaceae ratio remains relatively low, supporting the conclusion about the limited participation of boreal components and the prevalence of steppe-related elements. The comparatively low species-to-genus ratio (1.45) suggests a higher taxonomic fragmentation of the flora, likely associated with selective establishment of species under transformed environmental conditions. Altogether, these indicators point to a structurally simplified and anthropogenically shifted floristic complex in the afforestation belts relative to zonal and regional reference floras (Table 2).
Biomorphological structure
Hemicryptophytes comprise 35.9% of the flora (Table 3). The biomorphological structure of the natural and synanthropic flora of afforestation belts is different. The majority of hemicryptophytes are apophytes (21.5%), while phanerophytes make up a largely natural flora (16.2%), along with nanophanerophytes (7.9%). In the structure of alien flora, hemicryptophytes (8.4%) and chamaephytes (8.2%) occupy the first two places, respectively.
Table 3.
Biomorphological structure of the flora of the afforestation belts according to Raunkier's classification of biological types (Nat – natural, Apo – apophytic, Aln – alien flora).
| Raunkier's biological types | Sum | Nat | Apo | Aln |
|---|---|---|---|---|
| Hemicryptophyte | 35.9 | 6.0 | 21.5 | 8.4 |
| Phanerophyte | 21.2 | 16.2 | 0.0 | 5.0 |
| Nanophanerophyte | 13.9 | 7.9 | 3.2 | 2.8 |
| Therophyte | 13.8 | 0.0 | 7.9 | 5.8 |
| Chamaephyte | 11.7 | 0.7 | 2.8 | 8.2 |
| Geophyte | 3.4 | 2.2 | 0.8 | 0.4 |
| Other | 0.1 | 0.1 | 0.0 | 0.1 |
Due to the lack of within-group replication, inferential statistical testing was not applicable; therefore, the analysis was limited to a descriptive assessment of contribution patterns. The main differences between the compared flora fractions are determined by a small set of life forms. In particular, the natural–apophytic contrast is largely driven by phanerophytes and hemicryptophytes, while differences between natural and alien fractions are additionally associated with the increased role of chamaephytes and therophytes. The apophytic and alien fractions differ primarily in the proportion of hemicryptophytes and chamaephytes, with a noticeable contribution of phanerophytes. Overall, the observed variation reflects shifts in the dominance of key biomorphological types rather than uniform restructuring across all life forms (Table 3).
Distribution of species of different strategies
The ratio of species exhibiting various strategies in natural and synanthropic flora varies (Table 4). In natural flora, species are primarily classified into two groups: those that follow a C-strategy, or competitive type (18.5%), and those that adopt an S-strategy, i.e. stress-tolerant (12.8%). These strategies occupy different ecological niches: the first group consists of edificators, which perform an environment-forming function and primarily occupy the woody layer. The second group includes mainly herbaceous species that occupy created niches. In the apophytic flora, the proportions of species from different strategies, C, R, and S, are close to 15.5%, 12.1%, and 11.6%, respectively. This group of species is adapted to secondary and human-altered biotopes; therefore, the ratio of C, R, and S species varies based on the nature, duration, and intensity of the impact. In alien flora, either the optimal strategy is the C-type, which mainly pertains to agriophytes that create and transform communities, or the R-type, which is ruderal, optimized for maximum seed productivity, speed of territory capture, and migration.
The layer structure and the main layer-forming species
Similarly to Raunkiaer's biological types, the life form (whether herbaceous, shrub, or tree) significantly influences its relationship with apophytic or alien flora, ultimately determining its niche positions within communities. In the apophytic flora, herbaceous species dominate, comprising 96.3% of the total (Table 5).
Table 5.
Distribution of the number of species of different types of life forms by layers in the natural and synanthropic flora of the afforestation belts.
| The life form of a species | Sum | Nat | Apo | Aln |
|---|---|---|---|---|
| Herbaceous | 73.2 | 21.7 | 33.6 | 17.9 |
| Shrubs | 15.3 | 8.9 | 1.3 | 5.1 |
| Trees | 11.5 | 6.8 | 0 | 4.7 |
| Total | 100 | 37.4 | 34.9 | 27.7 |
At the same time, the proportion of trees (11.5%) and shrubs (15.3%) is significantly higher in the natural flora. As for alien species, among them there is a significant number of both herbaceous (17.9%), shrub (5.1%), and tree (4.7%) species (Table 5). Many tree species, such as Robinia pseudoacacia L. and Acer negundo L. are introduced species that are commonly planted in afforestation belts. These species are selected for their ability to adapt well to the climate of the forest-steppe zone, their rapid growth, and their effectiveness in preventing soil erosion. The list of the main species forming afforestation belts (Table 6) was created considering the constancy-abundance indicator, which reflects the importance of the species within communities and their impact on the environment.
Table 6.
The top 10 species that form the main layers in afforestation belts are sorted by their constancy-abundance index values.
| Species/Layer | Group | Constancy, % | Abundance-average, % | Constancy-Abundance Indicator, % |
|---|---|---|---|---|
| Tree layer | ||||
| Quercus robur | natural | 75.4 | 56.0 | 65.0 |
| Fraxinus excelsior | natural | 46.3 | 28.0 | 36.0 |
| Acer platanoides | natural | 32.3 | 23.0 | 27.2 |
| Acer negundo | kenophyte | 38.3 | 15.0 | 24.0 |
| Ulmus laevis | natural | 35.1 | 16.0 | 23.7 |
| Tilia cordata | natural | 11.9 | 35.0 | 20.4 |
| Robinia pseudoacacia | kenophyte | 13.0 | 32.0 | 20.4 |
| Fraxinus pennsylvanica | kenophyte | 5.6 | 39.0 | 14.8 |
| Ulmus minor | natural | 4.6 | 35.0 | 12.6 |
| Populus nigra | natural | 4.9 | 31.0 | 12.3 |
| Shrub layer | ||||
| Sambucus nigra | hemiapophyte | 57.9 | 15.0 | 29.5 |
| Caragana arborescens | kenophyte | 23.5 | 13.0 | 17.5 |
| Ptelea trifoliata | kenophyte | 7.4 | 18.0 | 16.7 |
| Acer tataricum | natural | 21.4 | 12.0 | 16.0 |
| Prunus spinosa | natural | 20.0 | 5.0 | 10.0 |
| Parthenocissus quinquefolia | kenophyte | 3.2 | 27.0 | 9.2 |
| Cornus sanguinea | natural | 13.3 | 5.0 | 8.2 |
| Euonymus europaeus | natural | 15.1 | 4.0 | 7.8 |
| Cotinus coggygria | kenophyte | 4.2 | 14.0 | 7.7 |
| Crataegus rhipidophylla | natural | 19.7 | 3.0 | 7.7 |
| Herbaceous layer | ||||
| Chelidonium majus | apophyte | 48.1 | 20.0 | 31.0 |
| Impatiens parviflora | kenophyte | 11.9 | 37.0 | 21.0 |
| Elytrigia repens | apophyte | 48.8 | 8.0 | 19.8 |
| Ballota nigra | archaeophyte | 52.6 | 6.0 | 17.8 |
| Urtica dioica | hemiapophyte | 39.3 | 6.0 | 15.4 |
| Alliaria petiolata | apophyte | 21.1 | 11.0 | 15.2 |
| Geum urbanum | hemiapophyte | 48.4 | 4.0 | 13.9 |
| Poa nemoralis | natural | 27.0 | 6.0 | 12.7 |
| Galium aparine | apophyte | 37.9 | 4.0 | 12.3 |
| Poa angustifolia | natural | 13.0 | 10.0 | 11.4 |
Tree layer
The three main trees that form the main layer of forest belts are Quercus robur L., Fraxinus excelsior L., and Acer platanoides L. The afforestation belts are artificial; the introduced species Acer negundo (38.3%), Robinia pseudoacacia (13.0%), and Fraxinus pennsylvanica Marshall (5.6%) are quite common in the studied region. Other species that form the tree layer (Ulmus laevis Pall., U. minor Mill., Tilia cordata Mill., Populus nigra L.) are native and typical of the region's deciduous forests.
Shrub layer
In the shrub layer of the afforestation belts, Sambucus nigra L. is the most consistently recorded species (57.9%). As a native component of the local flora, it demonstrates strong adaptation to artificial plantations while also thriving in natural forests on fertile soils. High levels of illumination in the peripheral zones of afforestation belts further enhance their vigor and ecological activity. Whereas the presence of native tree species such as Quercus, Acer, and Fraxinus within the belts is primarily the result of intentional planting, the spontaneous occurrence of native shrub species, including Euonymus europaeus L., Cornus sanguinea L., and Crataegus rhipidophylla Gand., may be interpreted as evidence of restorative succession.
Nonetheless, the shrub layer also includes a notable number of non-native shrub species, particularly Caragana arborescens Lam. and Ptelea trifoliata L.
Herbaceous layer
In the tree layer, Quercus robur was found to have an occurrence rate of 75.4%. In the shrub layer, Sambucus nigra appeared with an occurrence rate of 57.9%. Meanwhile, in the herbaceous layer, the predominant species, Chelidonium majus L., had a constancy of 48.1%. Common species include Carex praecox Jacq., Poa nemoralis L., P. angustifolia L., Gypsophila paniculata L., and Linaria vulgaris Mill. These species are less consistently present and serve the role of “ascektators”. The group of typical forest herbs, including Adoxa moschatellina L., Convallaria majalis L., Polygonatum odoratum (Mill.) Druce, Glechoma hirsuta Waldst. & Kit., and Stellaria holostea L., is represented by very few species. Apophytes consist of various local species, including Chelidonium majus, Elytrigia repens (L.) Gould, Urtica dioica L., Geum urbanum L., and Galium aparine L. Additionally, many foreign species, such as Impatiens parviflora DC. and Ballota nigra L., are well suited to shaded habitats. The rich soils found in forest-steppe watersheds provide favorable conditions for these soil-demanding plants.
Phytosociological structure of the studied flora
The phytosociological structure of the flora reflects the ratio of species of different vegetation classes (Table 7) and indicates the directions of succession in the afforestation belts.
Table 7.
The ratio of diagnostic species of different vegetation classes in the natural and synanthropic flora of the afforestation belts.
| Nat | Apo | Aln | |||
|---|---|---|---|---|---|
| 1. | Carpino-Fagetea | 17.4 | 13.9 | 3.4 | 0.1 |
| 2. | Epilobietea angustifolii | 14.4 | 0.8 | 10.5 | 3.1 |
| 3. | Robinietea | 12.9 | 1.7 | 5.6 | 5.6 |
| 4. | Artemisietea vulgaris | 8.8 | 0.1 | 4.5 | 4.1 |
| 5. | Molinio-Arrhenatheretea | 6.0 | 1.4 | 4.6 | 0.0 |
| 6. | Crataego-Prunetea | 5.5 | 4.4 | 0.0 | 1.1 |
| 7. | Trifolio-Geranietea | 4.4 | 3.3 | 1.2 | 0.0 |
| 8. | Quercetea roboripetraeae | 4.2 | 4.1 | 0.0 | 0.1 |
| 9. | Festuco-Brometea | 3.6 | 1.5 | 1.1 | 1.0 |
| 10. | Sisymbrietea | 3.0 | 0.0 | 0.9 | 2.0 |
| Total | 80.2 | 31.2 | 32.0 | 17.1 |
Table 7 clearly shows that the ratio of species from different classes varies significantly among the natural, apophytic, and alien flora within the species composition. The natural species composition is primarily made up of the following groups: Carpino-Fagetea (13.9%), Crataego-Prunetea (4.4%), and Quercetea roboripetraeae (4.1%). The species Epilobietea angustifolii Tx. et Preising ex von Rochow 1951 (10.5%), Robinietea (5.6%), Molinio-Arrhenatheretea (4.6%), and Artemisietea vulgaris Lohmeyer et al. in Tx. ex von Rochow 1951 (4.5%) form the apophytic flora. Alien species have a coenotic optimum in the classes Robinietea (15.2%) or Artemisietea vulgaris (11.1%). It is also worth noting that the basis of the natural fraction is mainly tree species (Carpino-Fagetea).
The analysis of compositional dissimilarity indicates that differences among the compared flora fractions are largely determined by a limited number of vegetation classes (Table 7). The contrast between natural and apophytic fractions is mainly associated with forest and post-disturbance communities, particularly Carpino-Fagetea and Epilobietea angustifolii. In the natural–alien comparison, forest-related classes, complemented by ruderal vegetation types such as Artemisietea vulgaris, retain the leading role. Differences between apophytic and alien fractions are primarily linked to classes representing secondary and meadow communities, including Epilobietea angustifolii and Molinio-Arrhenatheretea. Overall, the differentiation of the flora reflects shifts in the relative contribution of key vegetation classes, rather than a uniform redistribution across the full spectrum of syntaxa (Table 7).
Analysis of alien flora
The analysis of alien flora species reveals important information about the species composition and successional processes of community formation, including the proportions of indigenous (local) versus alien species (Table 8).
Table 8.
Ratio of indigenous (local) and alien species in the species composition of the afforestation belts.
| Categories | Species group | Count | Fraction, % |
|---|---|---|---|
| Indigenous species | 170 | 72.3 | |
| Natural | 88 | 37.4 | |
| Hemiapophytes | 40 | 17.0 | |
| Apophytes | 42 | 17.9 | |
| Alien species | 65 | 27.7 | |
| Archaophytes | 27 | 11.5 | |
| Kenophytes | 38 | 16.2 | |
| Total | 235 | 100 |
The species composition of afforestation belts primarily consists of local species, which make up 72.3% of the total. Among these, natural and conditionally natural species account for approximately 37.4%, while apophytic and hemiapophytic species represent about 34.9%. The proportion of alien species is also noteworthy, comprising more than a quarter (27.7%) of the total list. The proportions of apophytic and alien flora are similar at 34.9% and 27.7%, respectively.
Kenophyte species show higher coverage constancy values than archaeophytes, with CAI index values ranging from 14.8% to 24.0% (average 19.5%) for kenophytes, while for archaeophytes, the values range from 6.7% to 17.8% (average 9.8%) (Table 9). The average persistence and abundance indicators for kenophyte herbaceous plants (2.9 and 4.5, respectively) significantly differ from their corresponding indicators for archaeophytes (7.1 and 2.24), which have spontaneous origins. At the same time, archaeophytes enter the herbaceous layer (Ballota nigra, Lactuca serriola L., Anthriscus cerefolium (L.) Hoffm., etc.), and their influence on the community is smaller.
Table 9.
Top five archaeophyte and kenophyte species based on their participation in afforestation belts communities (C, % – constancy; A, % – average projective cover; CAI – combined constancy-abundance geometric mean).
| Rank | Archeophytes | C, % | A, % | CAI, % | Kenophytes | C, % | A, % | CAI, % |
|---|---|---|---|---|---|---|---|---|
| 1 | Ballota nigra | 52.6 | 6.0 | 17.8 | Acer negundo | 38.3 | 15.0 | 24.0 |
| 2 | Lactuca serriola | 39.7 | 2.0 | 8.9 | Impatiens parviflora | 11.9 | 37.0 | 21.0 |
| 3 | Anthriscus cerefolium | 4.2 | 15.0 | 7.9 | Robinia pseudoacacia | 13.0 | 32.0 | 20.4 |
| 4 | Fallopia convolvulus | 18.6 | 3.0 | 7.5 | Caragana arborescens | 23.5 | 13.0 | 17.5 |
| 5 | Artemisia absinthium | 22.5 | 2.0 | 6.7 | Fraxinus pennsylvanica | 5.6 | 39.0 | 14.8 |
| Average (by column) | 27.5 | 5.6 | 9.8 | 18.5 | 27.2 | 19.5 | ||
The majority of alien species in the afforestation belts are epecophytes, accounting for 50.8% of the total (33 species; Table 10). Agriophytes and hemiagriophytes represent smaller fractions, each comprising 12.3%, and are predominantly associated with tree and shrub species. Collectively, these categories of alien species are widespread and constitute a stable component of the flora, amounting to 75.4%.
Discussion
One notable distinction of this list compared to the spontaneous flora of our region is the absence of the Ranunculaceae family, while the Sapindaceae family is present. This anomaly can be explained by the weak representation of Ranunculaceae in artificially established forests, particularly given the limited occurrence of anthropochores and alien species within this family. In contrast, three species of the genus Acer have been intentionally introduced into these areas. Owing to adaptive traits such as anemochory, rapid growth, and an early onset of reproduction, these species have successfully naturalized within the studied biotopes. Another noteworthy difference is the unusually high representation of Rosaceae, which ranks second in species richness, surpassing Poaceae. This shift is attributed to the substantial number of native and non-native shrub and tree species of Rosaceae that are widely cultivated in the afforestation belts. The proportion of families represented by a single species in this coenoflora is 26%, indicating the region's aboriginal component (Kovalenko, 2016). The composition and ratio of various families vary between the natural and synanthropic flora of afforestation belts. Species from the families Asteraceae, Apiaceae, and Caryophyllaceae are mostly apophytes, with only a few natural species found among them. A different strategy is employed by species in Rosaceae, Poaceae, and Cyperaceae, which are mainly natural species.
Most alien species are representatives of the families Asteraceae, Rosaceae, Poaceae, and Lamiaceae. Fabaceae and Brassicaceae. Vitaceae, Moraceae, Anacardiaceae, Rutaceae, and Juglandaceae are atypical families represented exclusively by species of foreign origin in the regional flora.
The zonal index of the studied floristic complex corresponds to the range of values known for temperate floras (0.5–1.6) but differs significantly from the flora of the Left-Bank Forest-Steppe (0.94) (Bayrak, 1997) and is closer to the flora of the southern regions of this zone (0.55) (Solomakha et al., 2015). Comparable patterns are observed in the ratio of Asteraceae / Fabaceae species (4.25), a relationship that is likewise characteristic of boreal and temperate floras.
An important indicator of plant diversity is the genus coefficient, which is the ratio of the number of species to the number of genera in a given flora. Based on an analysis of empirical data on plant floras, calculations indicate that the average number of species within a genus should be two (Puzachenko, 1982). Any deviations from this average may signify an imbalance in the floristic system. The value of the generic coefficient for the flora of the afforestation belts is quite low – 1.45. This is due to the high diversification of the generic spectrum, largely influenced by the significant presence of the allochthonous component within the flora, which indicates the unbalanced nature of this floristic system.
The abundance of hemicryptophytes is typical of temperate zones. However, the proportions of other groups of biological types are unusual. Phanerophytes and nanophanerophytes together rank second in species richness, although they usually occupy a much lower place in the spectrum of biomorphs of the regional flora. The tree layer is formed using a variety of native and non-native tree species during the establishment of forest belts. Fractional indicators of the biomorphological structure of the studied flora create an opportunity to state the following. Therefore, the adaptive strategy of a species, its migratory capabilities, and tolerance to human presence largely depend on the duration of the life cycle and the integral features of its life form, which are represented by Raunkiaer's biological types.
Different types of species strategy indicate the predominant implementation of various adaptive strategies and the occupation of various niche positions. The C-type strategy can be described as a competitive approach characterized by “crowding out” and “conquest”. The R-type strategy is characterized as an “escape”, to “free” niches, and the S-type as “adaptation”, or “adjustment”. The proportion of species with C-, R-, or S-type strategies in these floras differs.
The correlation between the numbers of species with different life strategies illustrates the general pattern of interaction between stabilizing, stress-forming, and destructive factors (Grime, 1977). The predominance of species exhibiting a competitive strategy within the flora of the afforestation belts (44.2%) suggests a high potential for the development of stable and productive phytosystems, which, however, still display considerable elements of stress tolerance (28.7%) and ruderal (disturbance-related) strategies (27.1%).
The tree species forming the main layer of the afforestation belts are predominantly native. They are widely utilized in afforestation practices due to their adaptation to the climatic conditions and soils of the forest-steppe zone, where they constitute the zonal type of broad-leaved forests. Introduced species, however, not only establish successfully but also spread independently, facilitated by their biomorphological traits and a broad ecological amplitude. These species perform best on fertile soils (leached chernozems and gray forest soils), yet they remain relatively undemanding of edaphic conditions. Moreover, they readily colonize gaps created by windfalls within the relatively narrow 5–7-row belts. Thus, while the tree layer is of artificial origin, it comprises a combination of planted native species, well-adapted to local climatic and edaphic conditions, and fast-growing introduced species.
The successional process indicates a trajectory toward forest-type vegetation, characteristic of the northern part of the Forest-Steppe zone, where such communities were once widespread on plateau landscapes. The distribution of alien shrubs in afforestation belts, Acer negundo and Robinia pseudoacacia, is spontaneous. The primary methods of seed dispersal for most tree species are anemochory and ornithochory. The effectiveness of ornithochory is determined by the suitability, and due to the destruction of natural forests, often by the lack of alternative forest belts for bird nesting within significant areas or even entire regions.
The structure of the herbaceous cover in afforestation belts primarily consists of autochthonous species often found in non-forest, well-lit communities. It is well known that most representatives of this group are myrmecochores. The incomplete formation of this hemisylvate biotope and its spatial fragmentation determine their current state.
The final ratio of species of different classes in the afforestation belt communities will depend on the proportions of species of natural, apophytic, and alien flora, which have developed as a result of managed (planting of various trees) and random (secondary spread) factors. As a result, the composition of the final communities will heavily depend on which tree species are predominantly planted in afforestation belts, whether they are native (such as oak, maple, linden, and ash) or non-native (such as black locust and American maple). If we consider the main classes of forest vegetation, these are Carpino-Fagetea, representing natural forests, and Robinietea, which signifies anthropogenic forests. It is between these classes and in certain proportions that the majority of the studied afforestation belts of the Left-Bank Forest-Steppe are located. It should also be added that the presence of the Carpino-Fagetea natural forest class in this list indicates a possible direction of development of afforestation belts, especially of older plantations (50–70 years) and significant density (more than 0.6) and row density (7–9 rows), towards natural forests that once existed on the slopes of the Forest-Steppe. To accelerate the development of natural forests belonging to the Carpino-Fagetea class, we recommend introducing targeted measures for the artificial enrichment of suitable sites with characteristic broadleaf forest species. Priority should be given to early-spring ephemeroids and geophytes, wintergreen hemicryptophytes, chamaephytes, and perennial grasses that establish both early and late in the growing season.
As a result of analysis, we note an extremely high rate of adventization when compared to the natural broad-leaved forests of Eastern Europe in the first half of the 20th century, which had a mere 0.81% (Kleopov, 1990). There are two main reasons for this phenomenon. First, alien species possess specific adaptations that enable them not only to spread in new territories but also to thrive in artificial plantations, such as afforestation belts. Secondly, many alien species are introduced intentionally in afforestation belts, where they later establish themselves and spread independently (Robinia sp., Acer negundo, etc.).
The CAI index accounts for both the frequency of occurrence and the abundance of a species within communities. It can be argued that the present influence and ecological role of afforestation belts dominated by young expansive species, particularly kenophytes, is considerably greater. These species are not only introduced more frequently (as indicated by species frequency) but are also more thoroughly integrated and impactful within their communities (as indicated by species coverage). It is important to note that kenophyte trees exhibit the highest rates of constancy and abundance. This can be attributed to the artificial origins of their populations, particularly in most afforestation belts. The decrease in the dominant role and specific “coenotic dispersion” likely results from the development of ecosystem mechanisms that stabilize their populations over a longer period of cenogenesis compared to the kenophyte populations. Another aspect of the different coenotic position of kenophytes and archaeophytes is manifested in the fact that the former mainly enter the tree layer (Acer negundo, Robinia pseudoacacia, Fraxinus pennsylvanica), less so in the shrub layer (Caragana arborescens), and the herbaceous layer (Impatiens parviflora).
Conclusion
The flora in the afforestation belts of the Left-Bank Forest-Steppe region of Ukraine demonstrates a unique and specific range of species. The proportions of natural, apophytic, and alien species differ significantly in all studied structures. Many characteristics of its taxonomic, biomorphological, and coenotic structure display distinct features, with some anomalies and signs of imbalance compared to regional floras. This is primarily due to the artificial origins of many species, the relatively short duration of the formation and development process, and the specific environmental conditions in which this occurs.
Given a decrease in anthropogenic impacts, the most likely direction for future successional changes in these unique hemisylvate-type ecosystems is the gradual development of broad-leaved forest plant communities. Apoptytes and alien species thrive in disturbed environments and form the foundation of the herbaceous cover in afforestation belts.
The flora of afforestation belts in the Left-Bank Forest-Steppe exhibits a distinct species composition, with differing proportions of natural, apophytic, and alien species across the studied structures. Taxonomic, life form, and coenotic characteristics show clear structural differentiation, including some patterns not typical of the surrounding regional flora. Apophytic and alien species are abundant in disturbed environments and contribute substantially to the herbaceous layer. Overall, these findings highlight the structural uniqueness of the flora in afforestation belts and provide a descriptive basis for understanding its ecological organization.