
Table 1.
Model parameterization.
Table 2.
Total carbon at the end of rotation in different forest management scenarios.
| White poplar | Black locust | |||||
|---|---|---|---|---|---|---|
| Sawmill | Board | Pulp | Sawmill | Board | Pulp | |
| Yield class I | 91.38 | 90.12 | 93.75 | 99.90 | 98.92 | 101.75 |
| Yield class II | 71.70 | 70.69 | 73.58 | 80.84 | 81.13 | 83.50 |
| Yield class III | 53.68 | 52.93 | 55.09 | 63.69 | 63.97 | 66.99 |
| Yield class IV | 39.44 | 38.88 | 40.48 | 50.30 | 49.79 | 51.24 |
| Yield class V | 28.07 | 27.67 | 28.81 | 37.39 | 37.01 | 38.09 |
| Yield class VI | 24.01 | 23.75 | 24.50 | 33.79 | 33.54 | 34.27 |
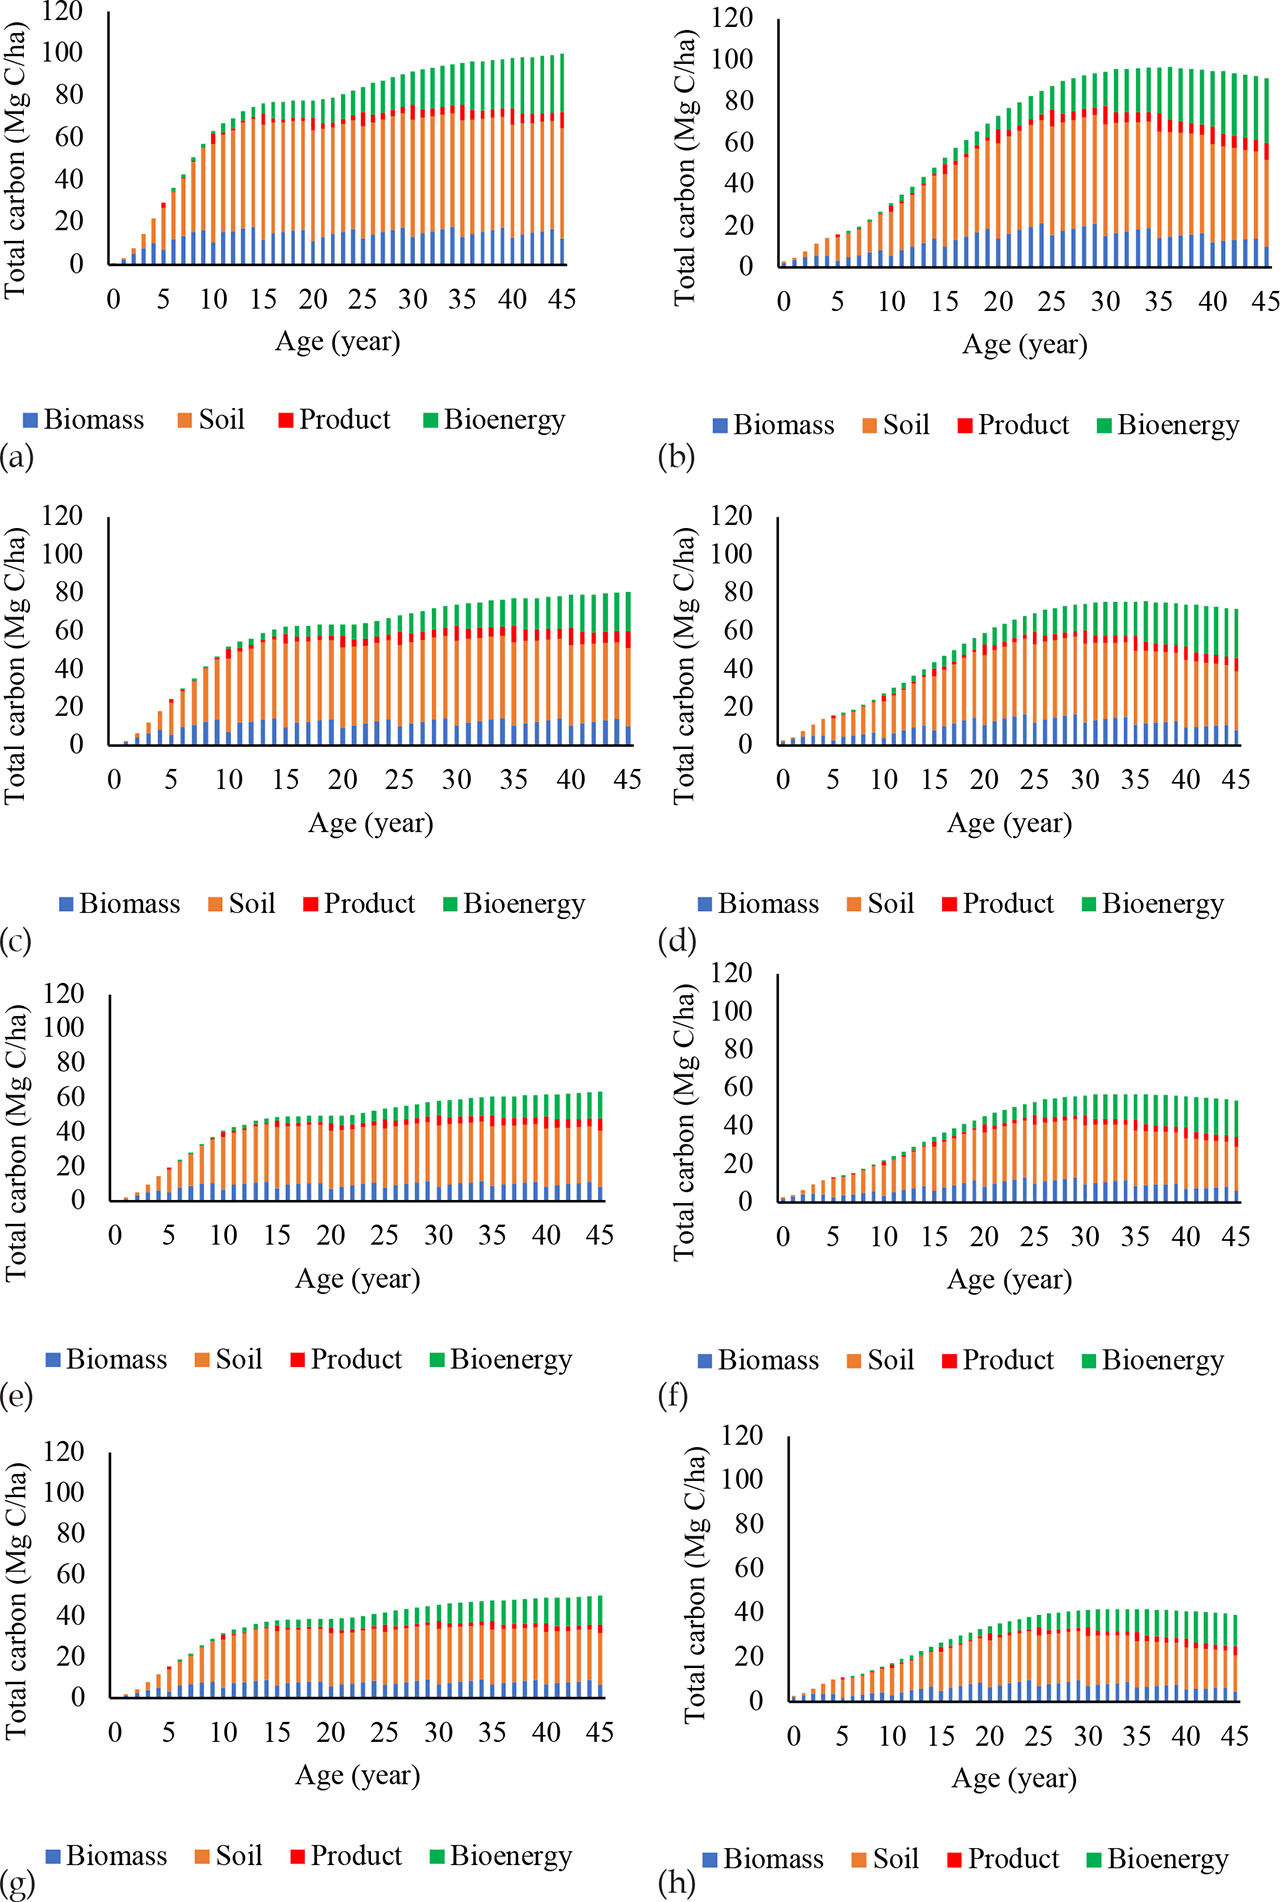
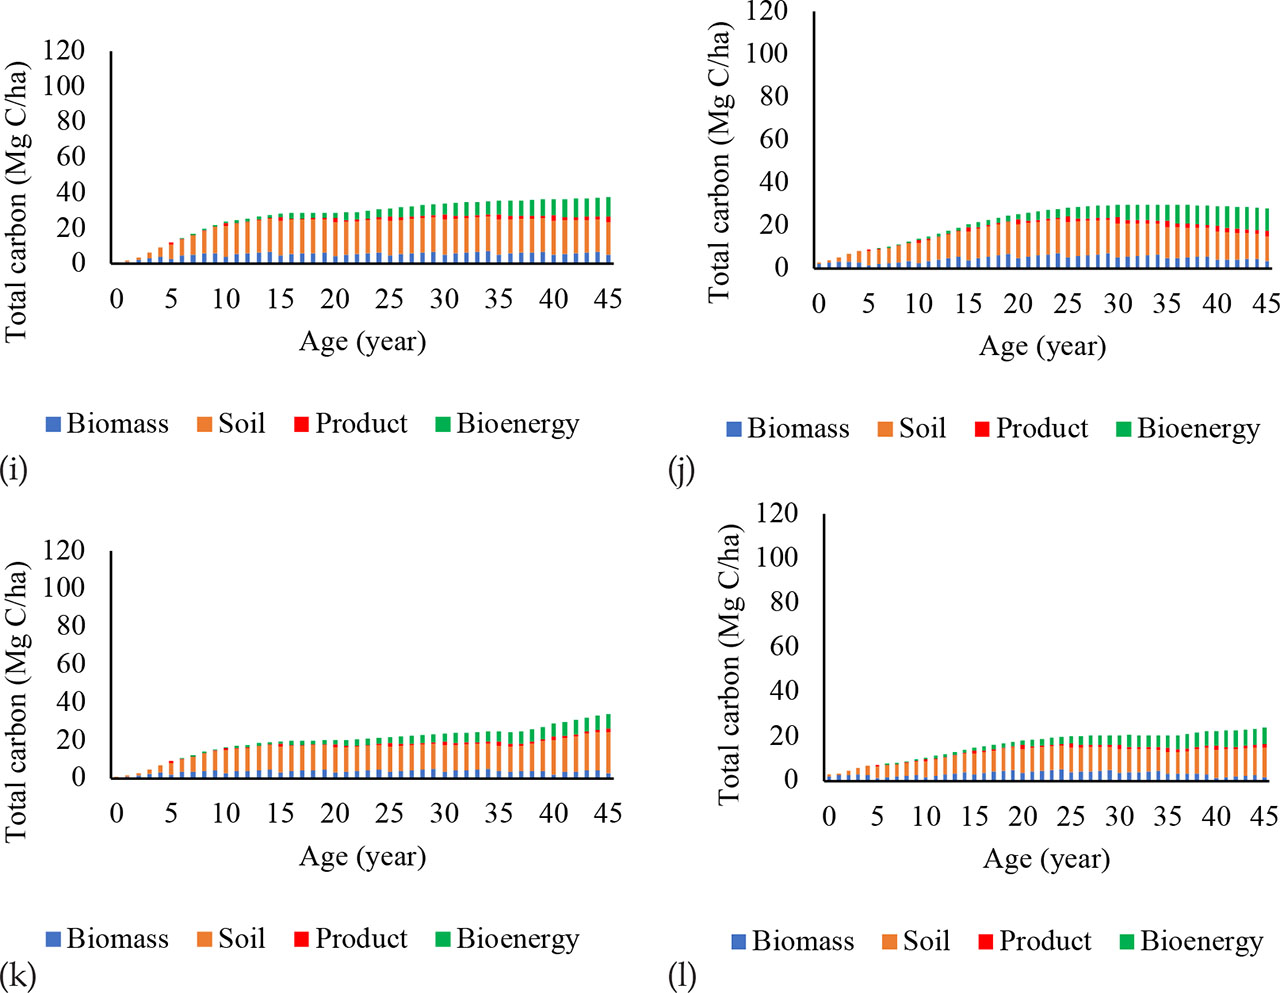
Figure 1.
Forest carbon dynamics for black locust (left) and white poplar (right) in different yield classes (started from yield class I on the upper side and yield class VI on the lower side).
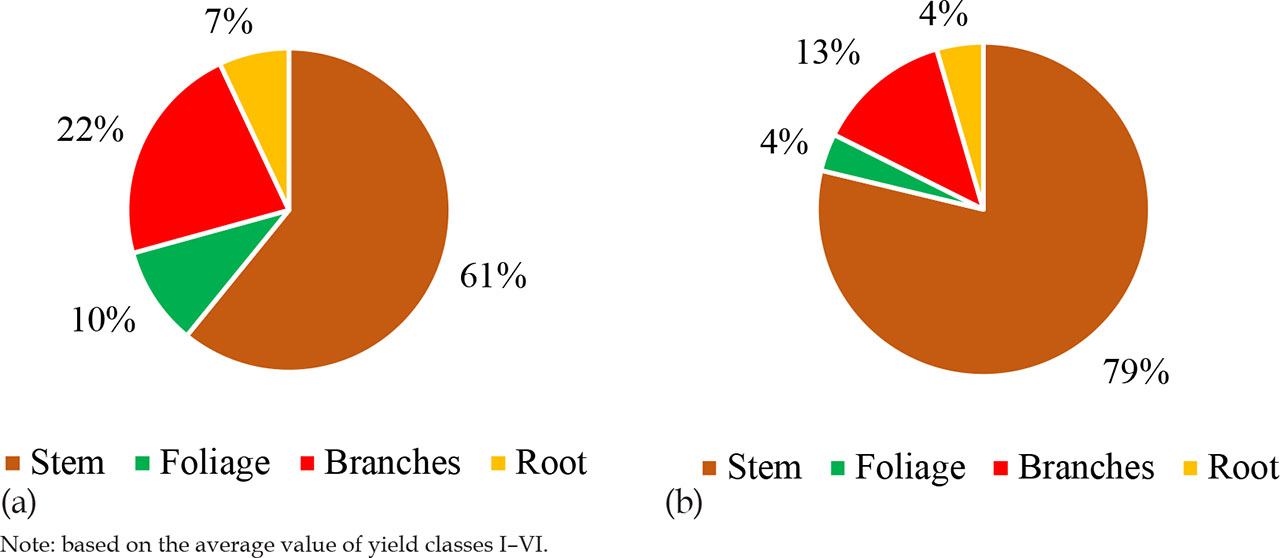
Figure 2.
Carbon allocation in tree’s organs: (a) black locust, (b) white poplar.
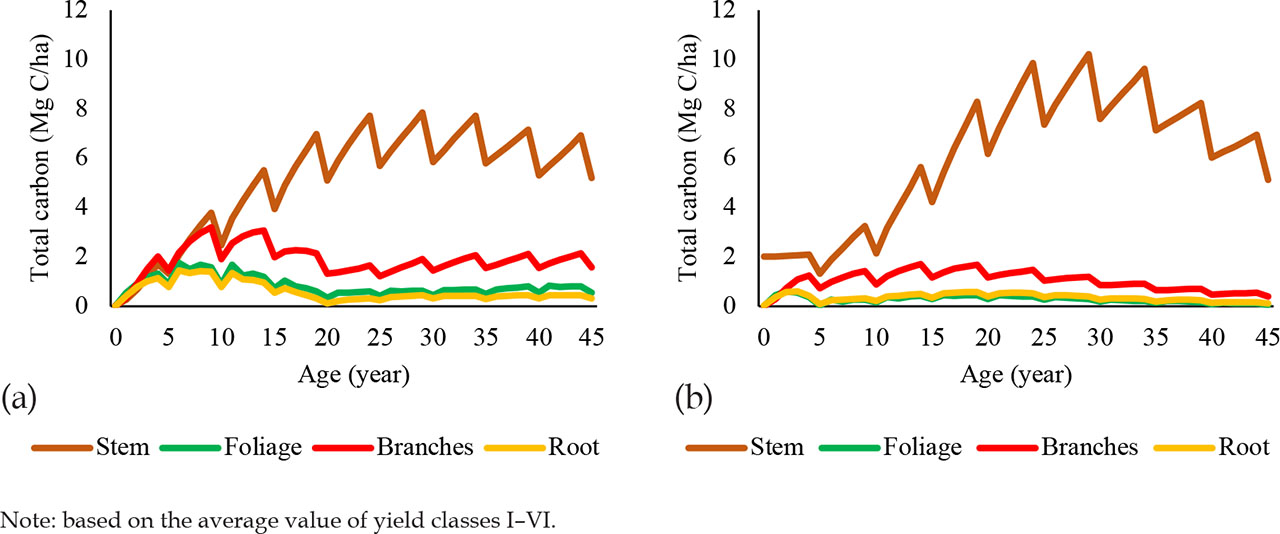
Figure 3.
Carbon dynamics in the biomass; (a) black locust, (b) white poplar.
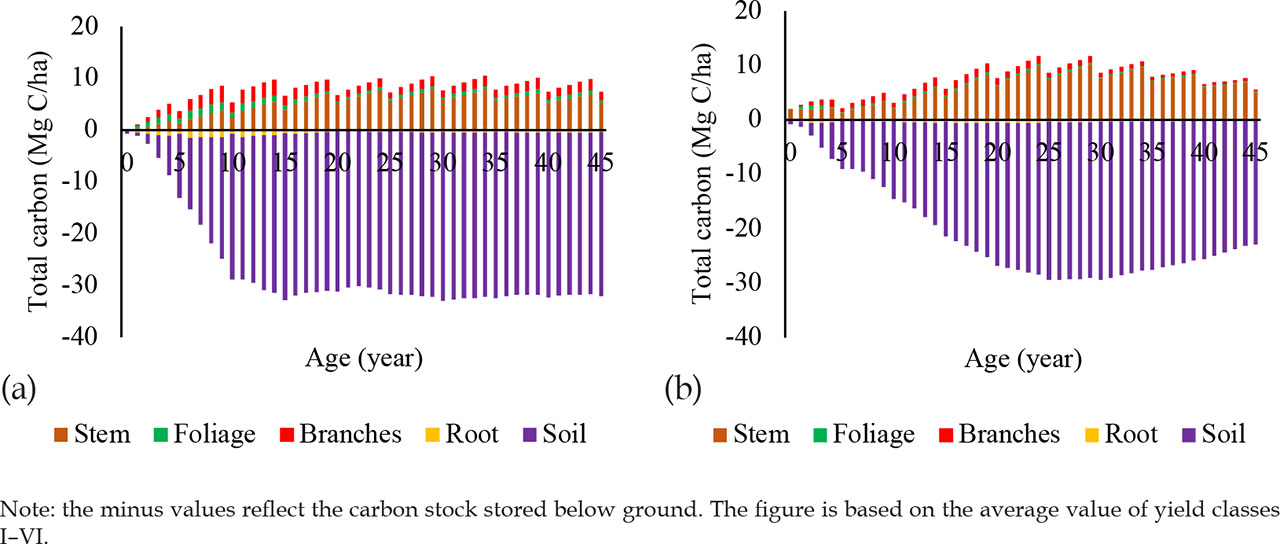
Figure 4.
Carbon dynamics in above- and below-ground carbon; (a) black locust, (b) white poplar.
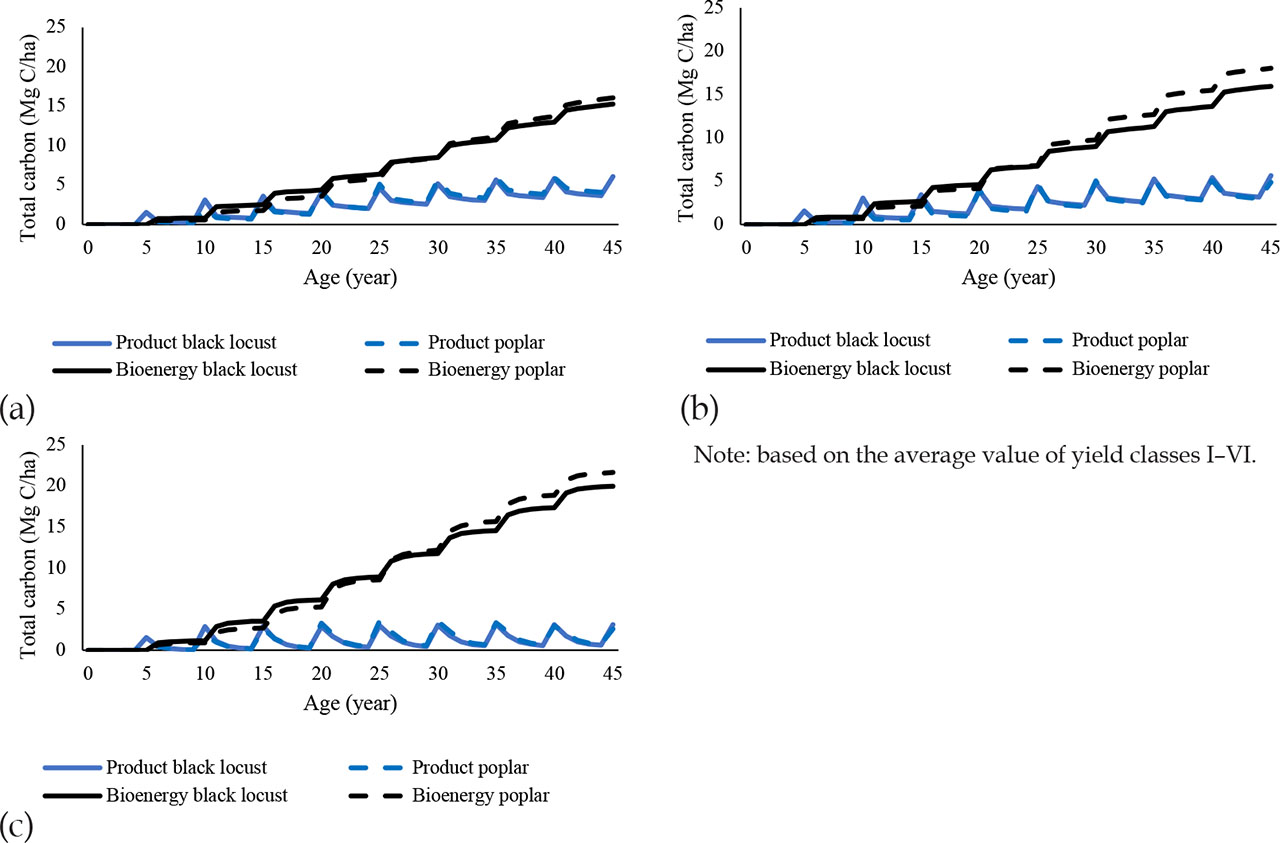
Figure 5.
Carbon dynamic in product and bio-energy compartments for: (a) board, (b) sawn mill, (c) pulp.