
Table 1.
Corner coordinates (EPSG:3301) of the test sites measured with differential GPS
Tabel 1. Katsealade nurgakoordinaadid Eesti põhikaardi süsteemis
| Corner | Xlocal | ylocal | XEPSG:3301 | yEPSG:3301 |
|---|---|---|---|---|
| Pine1 | 0 | 0 | 693110.5 | 6468117.1 |
| Pine2 | 0 | 100 | 693121.6 | 6468216.7 |
| Pine3 | 100 | 100 | 693220.8 | 6468205.6 |
| Pine4 | 100 | 0 | 693210.1 | 6468105.9 |
| Spruce1 | 0 | 0 | 690832.1 | 6466197.9 |
| Spruce2 | 0 | 100 | 690814.5 | 6466296.3 |
| Spruce3 | 100 | 100 | 690913.1 | 6466313.8 |
| Spruce4 | 100 | 0 | 690930.6 | 6466215.4 |
| Birch1 | 0 | 0 | 695299.9 | 6464769.0 |
| Birch2 | 0 | 100 | 695280.7 | 6464867.2 |
| Birch3 | 100 | 100 | 695378.8 | 6464886.6 |
| Birch4 | 100 | 0 | 695397.7 | 6464788.0 |
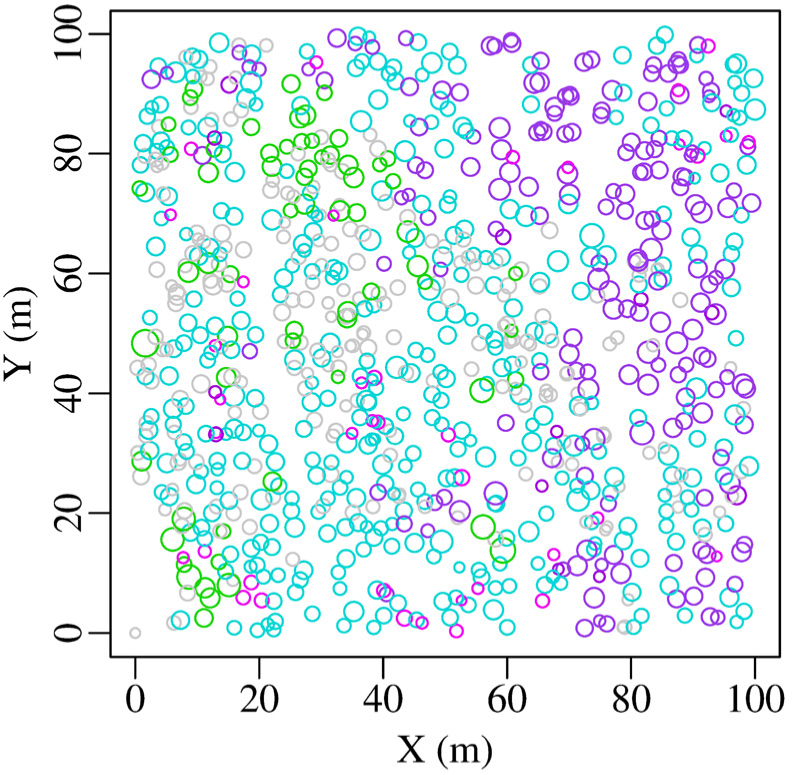
Figure 1.
Map of live trees in RAMI birch stand in 2019. The symbols are scaled according to tree size. Cyan corresponds to birch, magenta to spruce, blue-violet to black alder, green to European aspen and grey to other species.
Joonis 1. RAMI kaasiku kasvavate puude kaart aastal 2019. Sümbolid on skaleeritud kujutamaks puude suurust, värvid vastavad metsakorralduse juhendile.
Table 2.
Birch stand summary of forest inventory 2007 and 2019. Notations are explained under table.
Tabel 2. Kaasiku 2007. ja 2019. aasta takseerandmete kokkuvõte.
| Species | Code | N | G | D | H | Lcr | Rcr |
|---|---|---|---|---|---|---|---|
| 2007 inventory, upper layer | |||||||
| Populus tremula L. | HB | 78 | 2.848 | 21.6 | 27.5 | 9.4 | 1.95 |
| Betula pendula Roth | KS | 399 | 13.44 | 20.7 | 26.9 | 9.4 | 1.63 |
| Alnus glutinosa (L.) Gaertn. | LM | 176 | 6.921 | 22.4 | 23.8 | 9.8 | 2.04 |
| Salix spp. | PJ | 1 | 0.044 | 23.7 | 24.0 | 9.9 | 1.96 |
| 2007 inventory, second layer | |||||||
| Ulmus glabra Huds. | JA | 1 | 0.010 | 11.3 | 15.9 | 8.1 | 0.99 |
| Betula pendula | KS | 66 | 0.567 | 10.5 | 18.2 | 5.8 | 0.99 |
| Alnus glutinosa | LM | 20 | 0.271 | 13.1 | 17.9 | 8.5 | 1.40 |
| Tilia cordata | PN | 205 | 2.622 | 12.8 | 16.5 | 9.0 | 1.93 |
| Fraxinus excelsior | SA | 30 | 0.281 | 10.9 | 17.6 | 9.2 | 1.64 |
| Acer platanoides | VA | 16 | 0.159 | 11.2 | 16.3 | 8.5 | 1.85 |
| 2007 inventory, regeneration layer | |||||||
| Picea abies (L.) H. Karst. | KU | 39 | 0.245 | 8.9 | 10.3 | 4.8 | 1.16 |
| 2019 inventory, upper layer | |||||||
| Populus tremula | HB | 64 | 4.129 | 28.7 | 31.8 | 10.7 | 2.30 |
| Betula pendula | KS | 342 | 15.44 | 24.0 | 29.4 | 11.5 | 1.97 |
| Alnus glutinosa | LM | 159 | 8.654 | 26.3 | 26.4 | 13.1 | 2.27 |
| 2019 inventory, second layer | |||||||
| Ulmus glabra | JA | 1 | 0.015 | 13.8 | 17.3 | 11.0 | 2.03 |
| Betula pendula | KS | 27 | 0.275 | 11.4 | 19.7 | 8.0 | 1.20 |
| Alnus glutinosa | LM | 18 | 0.318 | 15.0 | 20.6 | 10.7 | 1.65 |
| Tilia cordata | PN | 264 | 4.369 | 14.5 | 20.2 | 13.0 | 2.13 |
| Fraxinus excelsior | SA | 18 | 0.263 | 13.6 | 20.4 | 12.3 | 2.12 |
| Acer platanoides | VA | 20 | 0.289 | 13.6 | 18.7 | 12.5 | 2.16 |
| 2019 inventory, regeneration layer | |||||||
| Picea abies | KU | 53 | 0.511 | 11.1 | 13.4 | 11.6 | 1.54 |
| 2019 | inventory, dead trees | ||||||
| Dead 2007–2019 | - | 159 | 1.349 | 10.4 | - | - | - |
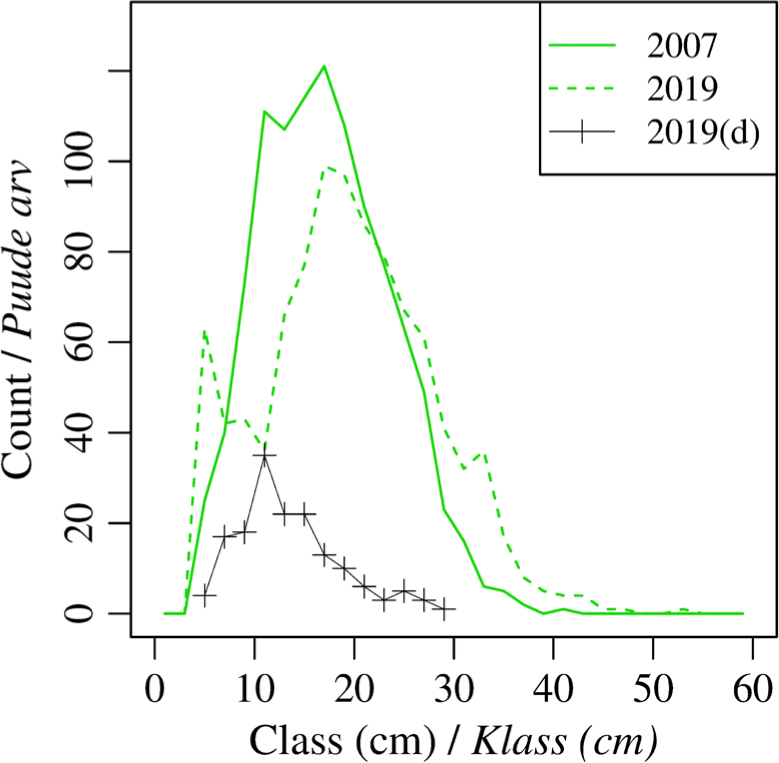
Figure 2.
Changes in stem breast height diameter distribution in the birch stand. Label (d) is for the trees that died between two measurements made in 2007 and 2019.
Joonis 2. Kaasiku puude diameetrijaotuse muutus. Ajavahemikus 2007–2019 surnud puud (d) on eraldi välja toodud.
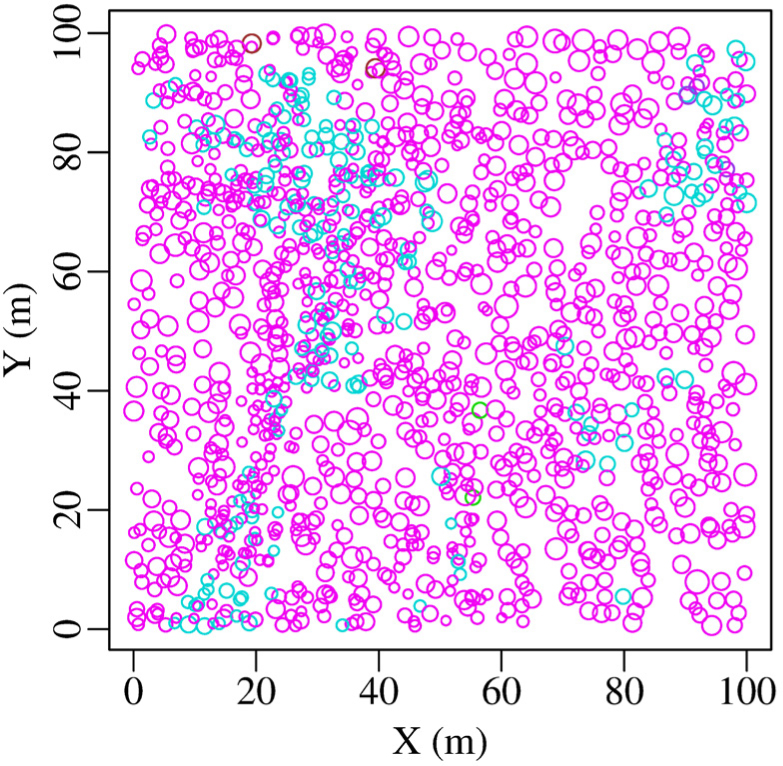
Figure 3.
Map of alive trees in RAMI spruce stand in 2019. The symbols are scaled according to tree size. Magenta corresponds to spruce and cyan corresponds to birch.
Joonis 3. RAMI kuusiku kasvavate puude kaart aastal 2019. Sümbolid on skaleeritud kujutamaks puude suurust, värvid vastavad metsakorralduse juhendile.
Table 3.
Spruce stand summary of forest inventory 2007 and 2019.
Tabel 3. Kuusiku 2007. ja 2019. aasta takseerandmete kokkuvõte.
| Species | Code | N | G | D | H | Lcr | Rcr |
|---|---|---|---|---|---|---|---|
| 2007 inventory, upper layer | |||||||
| Populus tremula | HB | 2 | 0.052 | 18.2 | 25.2 | 7.1 | 1.51 |
| Betula pendula | KS | 143 | 3.607 | 17.9 | 24.7 | 8.7 | 1.52 |
| Picea abies | KU | 624 | 27.04 | 23.5 | 23.8 | 12.0 | 1.81 |
| Alnus glutinosa | LM | 3 | 0.097 | 20.3 | 22.6 | 9.6 | 2.05 |
| Pinus sylvestris L. | MA | 2 | 0.109 | 26.3 | 24.5 | 10.4 | 2.11 |
| 2007 inventory, second layer | |||||||
| Betula pendula | KS | 152 | 1.024 | 9.3 | 18.1 | 4.9 | 0.92 |
| Picea abies | KU | 517 | 5.015 | 11.1 | 14.7 | 6.2 | 1.17 |
| 2007 inventory, regeneration layer | |||||||
| Picea abies | KU | 89 | 0.188 | 5.2 | 5.7 | 2.8 | 1.09 |
| Picea abies | KU | 157 | 0.586 | 6.9 | 9.1 | 3.5 | 1.10 |
| 2019 inventory, upper layer | |||||||
| Populus tremula | HB | 2 | 0.064 | 20.2 | 27.3 | 6.6 | 1.39 |
| Betula pendula | KS | 132 | 4.489 | 20.8 | 28.0 | 10.2 | 1.67 |
| Picea abies | KU | 585 | 30.61 | 25.8 | 26.7 | 12.1 | 1.57 |
| Alnus glutinosa | LM | 3 | 0.111 | 21.7 | 24.4 | 12.3 | 2.12 |
| Pinus sylvestris | MA | 2 | 0.139 | 29.7 | 27.2 | 13.4 | 2.70 |
| 2019 inventory, second layer | |||||||
| Betula pendula | KS | 45 | 0.494 | 11.8 | 23.1 | 5.2 | 0.93 |
| Picea abies | KU | 375 | 4.198 | 11.9 | 16.4 | 7.1 | 1.04 |
| 2019 inventory, regeneration layer | |||||||
| Picea abies | KU | 87 | 0.248 | 6.0 | 7.2 | 3.2 | 0.92 |
| Picea abies | KU | 70 | 0.326 | 7.7 | 11.7 | 4.8 | 0.92 |
| Dead 2007–2019 | - | 394 | 1.861 | 7.8 | - | - | - |
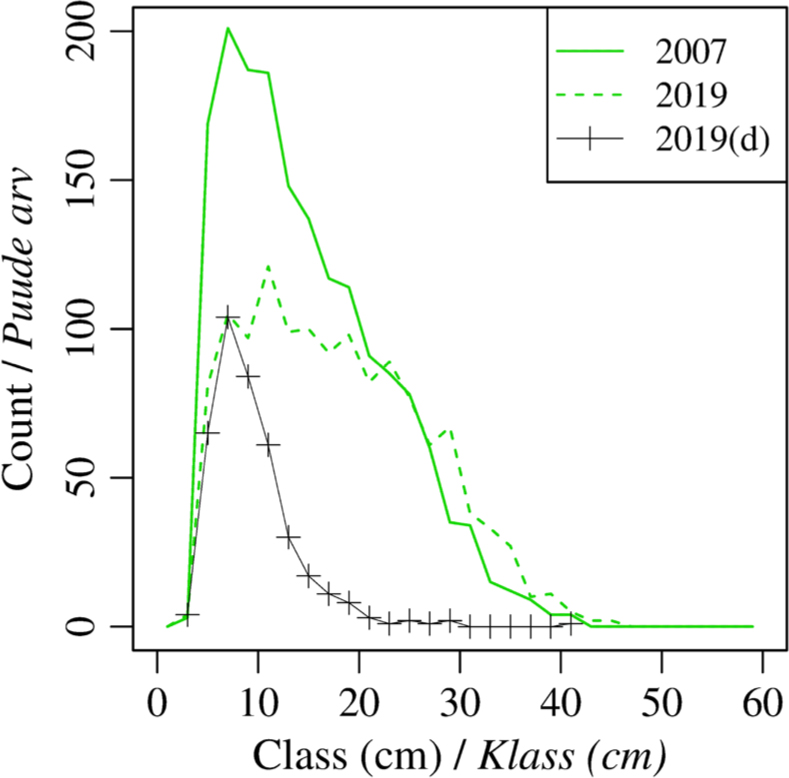
Figure 4.
Changes in stem breast height diameter distribution in the spruce stand. Label (d) is for trees that died between two measurements made in 2007 and 2019.
Joonis 4. Kuusiku puude diameetrijaotuse muutus. Ajavahemikus 2007–2019 surnud puud (d) on eraldi välja toodud.
Table 4.
Summary of forest inventory 2007 and 2019 of the pine stand.
Tabel 4. Männiku 2007. ja 2019. aasta takseerandmete kokkuvõte.
| Species | Code | N | G | D | H | Lcr | Rcr |
|---|---|---|---|---|---|---|---|
| 2007 inventory, upper layer | |||||||
| Pinus sylvestris | MA | 1116 | 28.25 | 18 | 16.1 | 4.5 | 1.52 |
| 2007 inventory, regeneration layer | |||||||
| Betula pendula | KS | 6 | 0.014 | 5.5 | 4.1 | 2.9 | 0.78 |
| Picea abies* | KU | 1 | 0.002 | 5.0 | 5.0 | 1.8 | 1.09 |
| 2019 inventory, upper layer | |||||||
| Pinus sylvestris | MA | 971 | 29.09 | 19.5 | 17.4 | 4.6 | 1.53 |
| 2019 inventory, regeneration layer | |||||||
| Betula pendula | KS | 6 | 0.022 | 6.8 | 5.0 | 3.1 | 0.90 |
| Picea abies* | KU | 1 | 0.003 | 6.2 | 6.9 | 3.8 | 0.97 |
| Dead 2007–2019 | - | 145 | 1.831 | 12.7 | - | - | - |
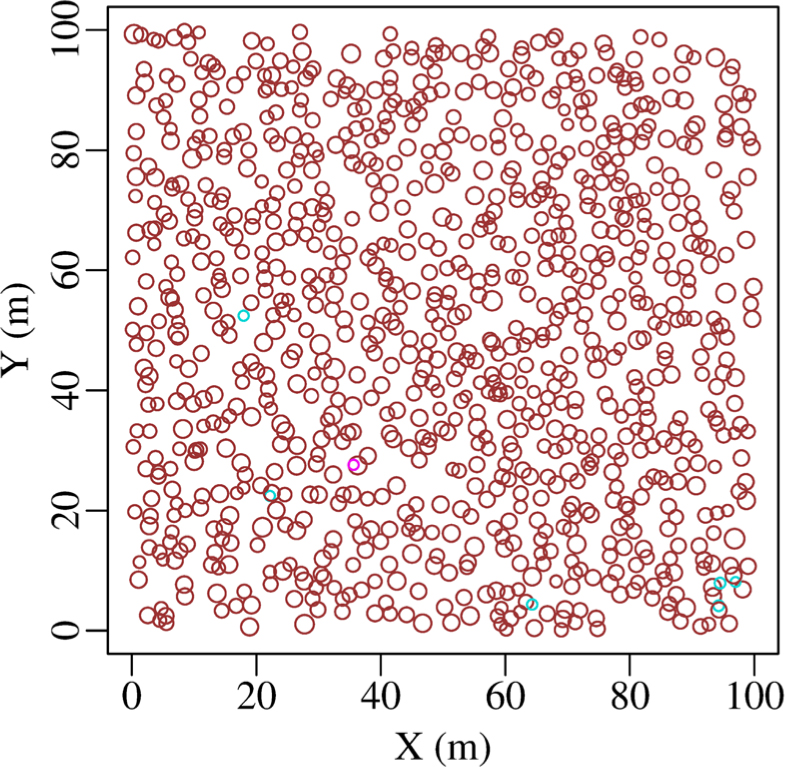
Figure 5.
Map of alive trees in RAMI pine stand in 2019. The symbols are scaled according to tree size. Brown corresponds to pine, cyan to birch, magenta to spruce.
Joonis 5. RAMI männiku kasvavate puude kaart aastal 2019. Sümbolid on skaleeritud kujutamaks puude suurust, värvid vastavad metsakorralduse juhendile.
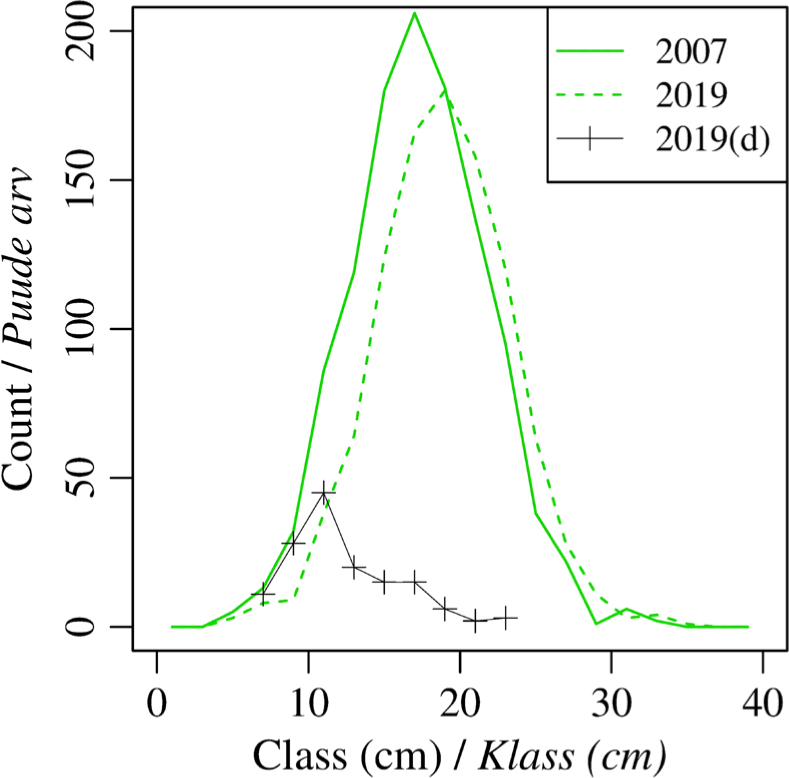
Figure 6.
Changes in stem breast height diameter distribution in the pine stand. Label (d) is for trees that died between two measurements made in 2007 and 2019.
Joonis 6. Männiku puude diameetrijaotuse muutus. Ajavahemikus 2007–2019 surnud puud (d) on eraldi välja toodud.
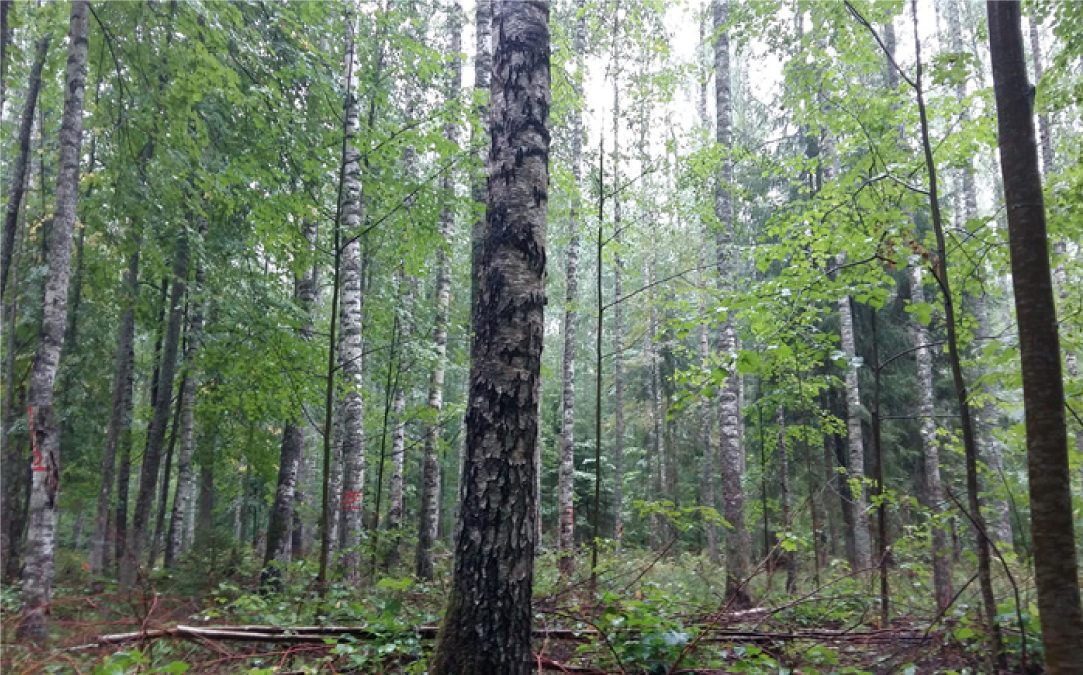
RAMI birch stand at Järvselja, Estonia 15 August 2018
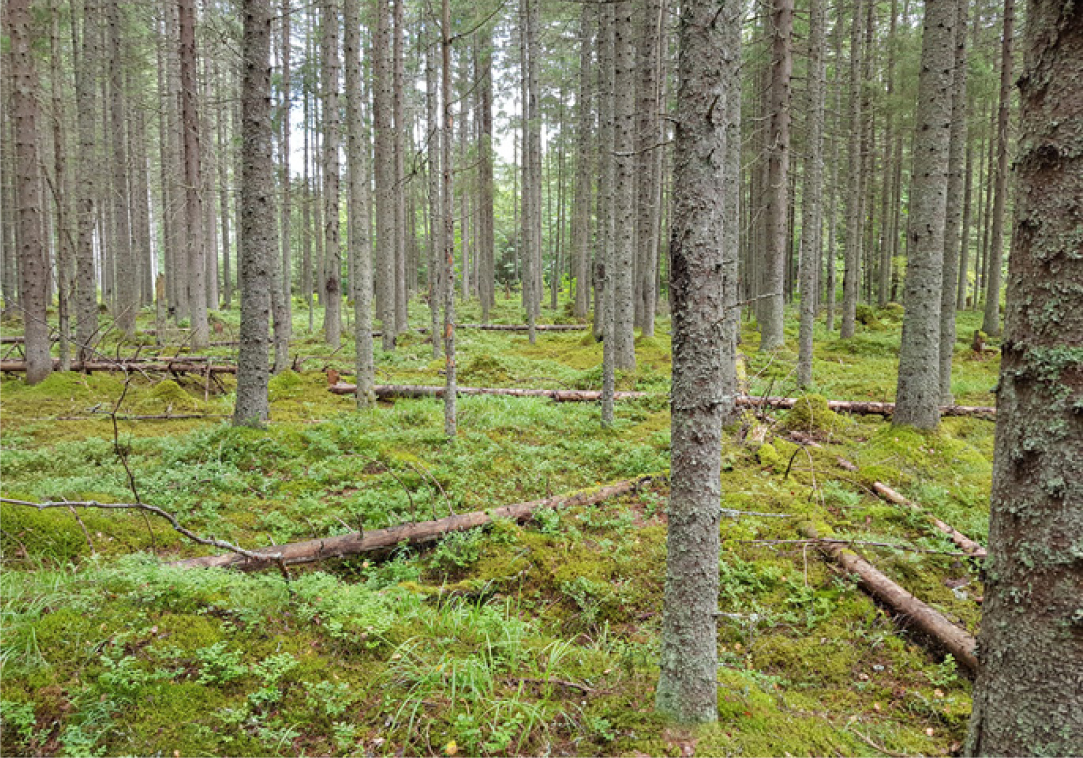
RAMI spruce stand at Järvselja, Estonia 01 August 2019
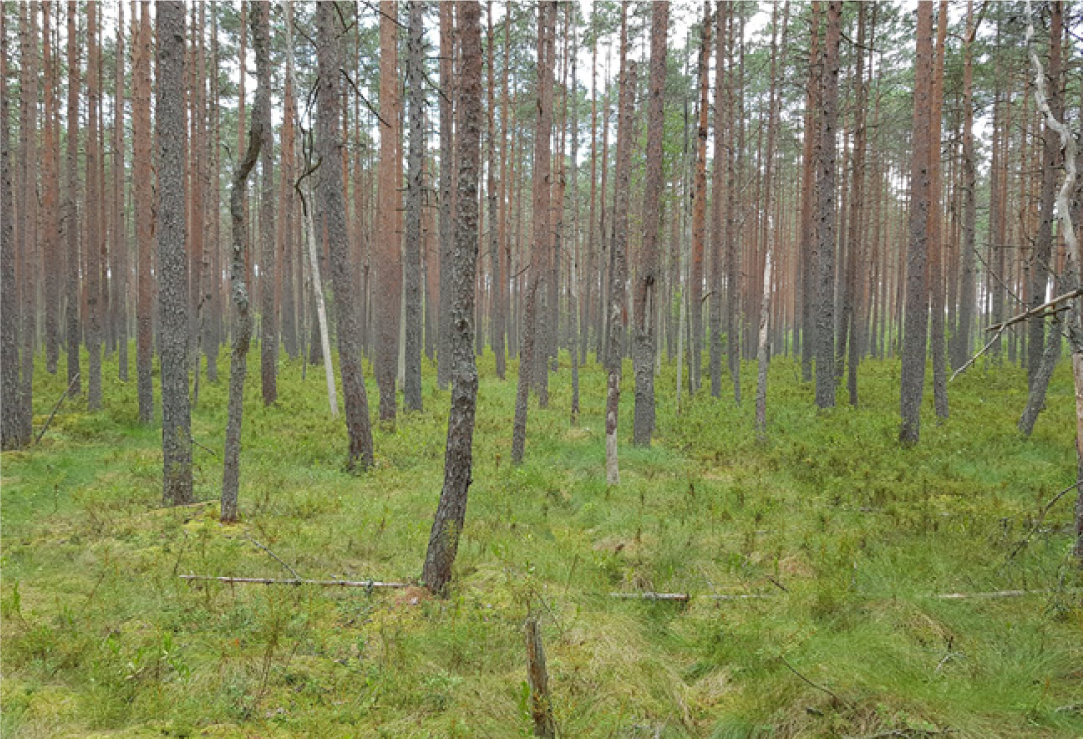
RAMI pine stand at Järvselja, Estonia 01 August 2019