
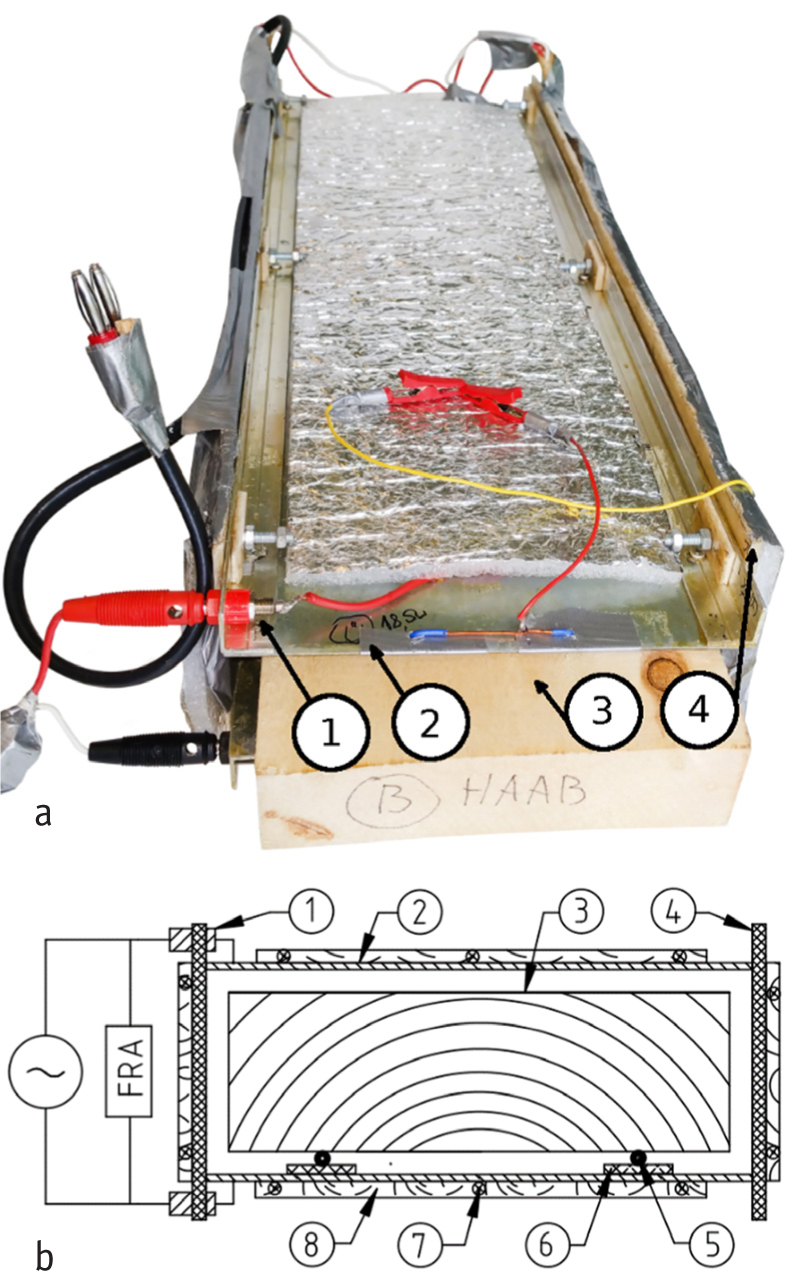
Figure 1.
(a) Circuit diagram of the measuring capacitor (MEC) and (b) photograph of the MEC prototype with the tested birch wood specimen. 1 – signal connector, 2 – capacitor plate, 3 – wood specimen, 4 – capacitor insulator, FRA – frequency response analyser, 5 – triboelectric charge collector, 6 – film insulator, 7– heating cable, 8 – heat insulator.
Table 1.
The main physical reliability characteristics of the dielectric capacitance method (DECM) in kiln climate and the corresponding capacitance meter (CAM) response.
| Effect, parameter, figure no. | Effect range | CAM response |
| Condensation of water vapor on MEC plates, Fig. 2, 3 | Cparasite = 340 to 845 pF Cparasite = 681 pF, determined using EIS method | CAM reading recorded ca. 5× and moderately increasing** |
| Leakage of MEC insulators, Fig. 4 | Cparasite = 163 to 681 pF Rparallel = 61 to 0.778 kOhm | Floating of CAM reading |
| Triboelectric charges on MEC plates, Fig. 5 | Ustatic = -10.5 to 4.29 V | Floating of CAM reading, CAM spoilage risk |
| Useful MEC capacitance,* below FSP (0.% to 30%) Useful MEC capacitance, above FSP (30% to 105%) | Cuseful = 121 to 205 pF MC = 0 % to 30% C useful = 205 to 231 pF MC = 30% to 105% | CAM reading stable and reliable |
* Useful MEC capacitance depends on the moisture content of wood and the thickness of the wood material according to the MEC, formula 1. Wood moisture content is related to the dielectric constant ε in formula 1.
** “Moderately increasing” means that it is possible to manually retrieve a CAM numerical reading, but it slowly increases as the water vapor condensation progresses (see Figure 3).
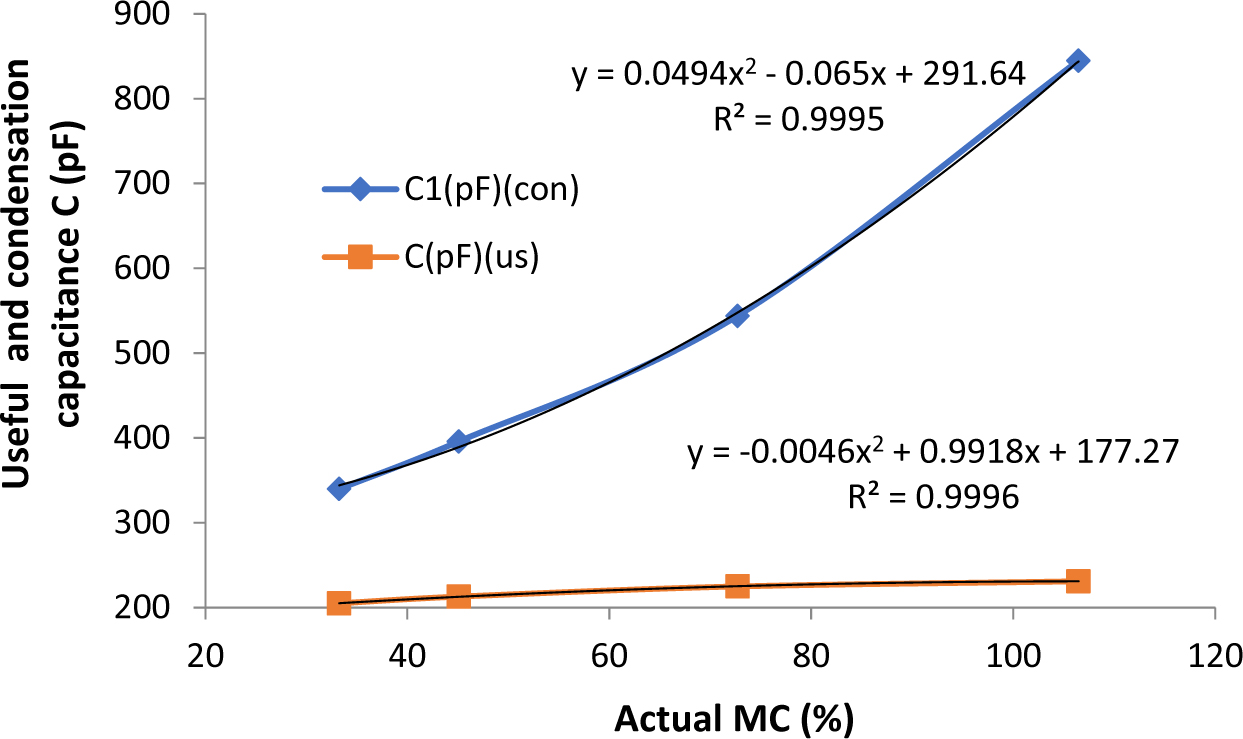
Figure 2.
The dependence of MEC useful capacitance and parasitic capacitance caused by water vapor condensation on MEC plates on the actual average moisture content of wood in the same coordinate grid. The upper curve in the figure represents parasitic capacitance, and the lower, useful capacitance.
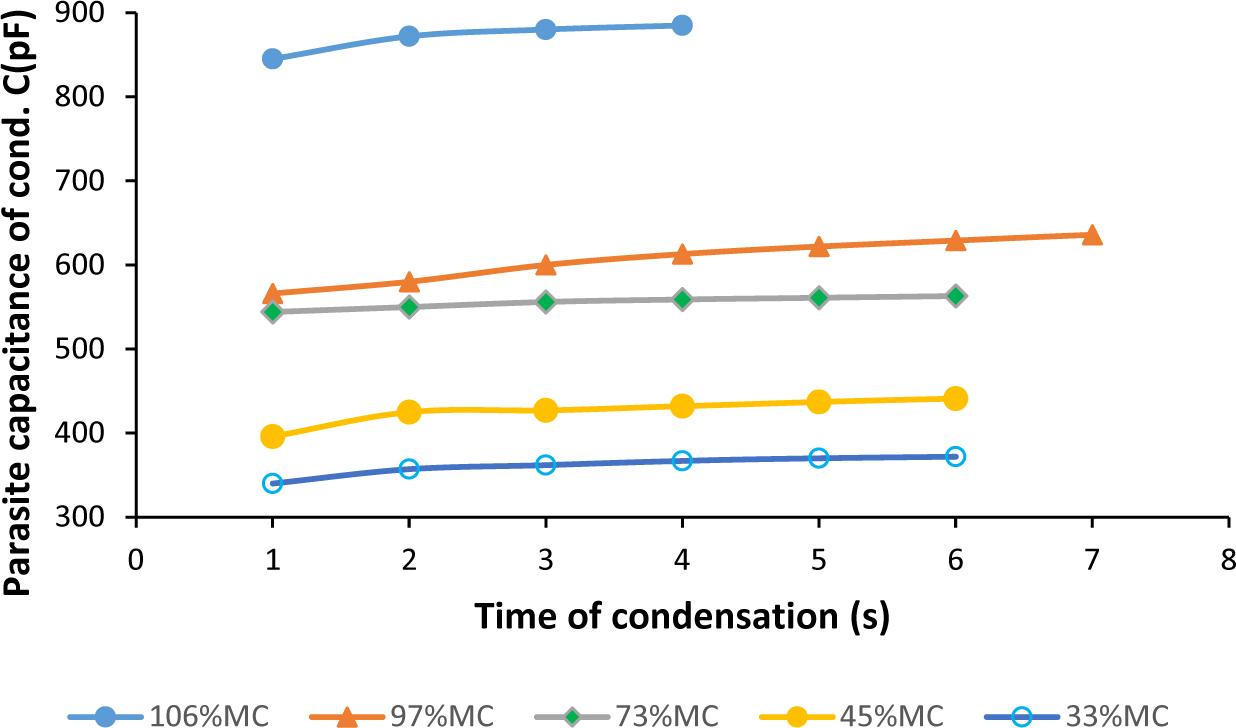
Figure 3.
Increment of parasitic capacitance due to condensation of water vapor on MEC plates at varying wood moisture levels.
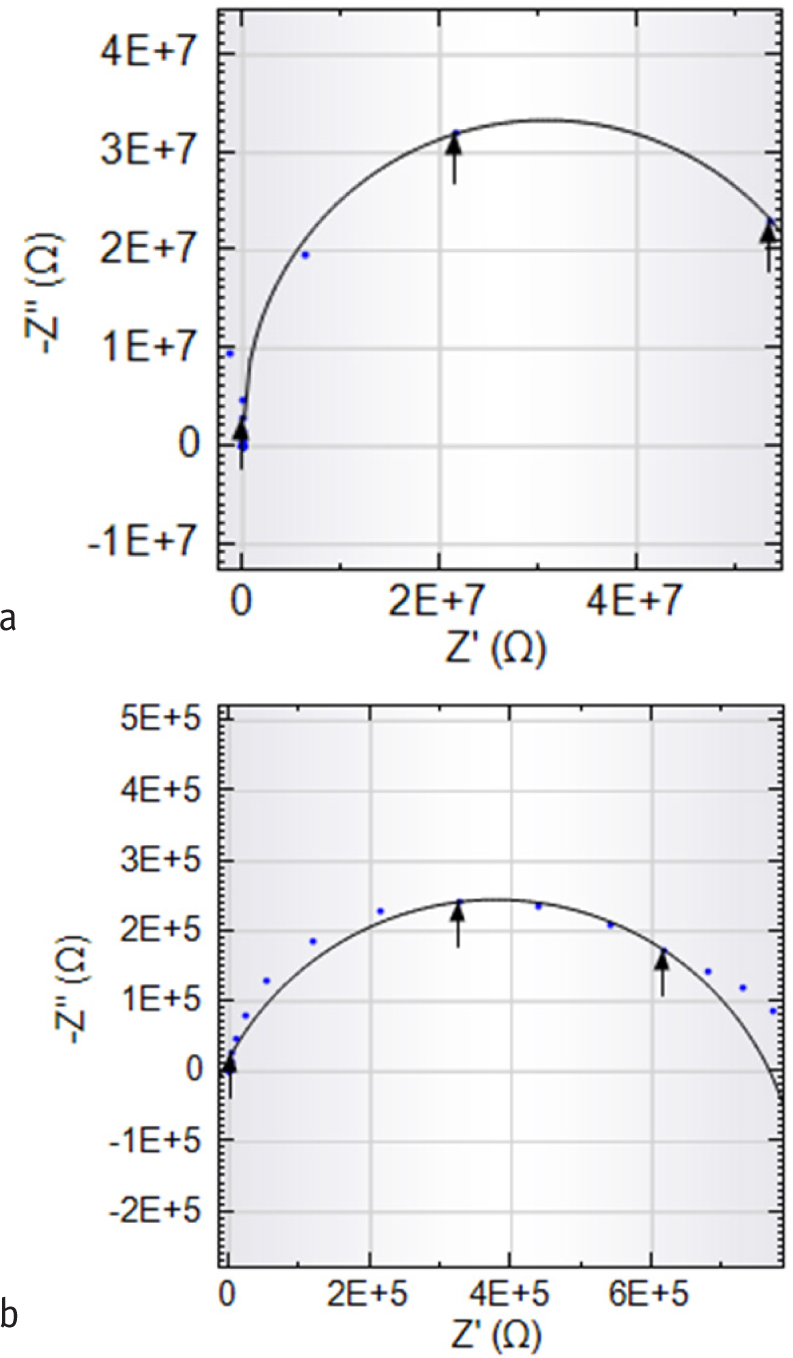
Figure 4.
Impedance spectra of leakage of MEC insulators: (a) Start phase of the leakage and (b) End phase of developed leakage.
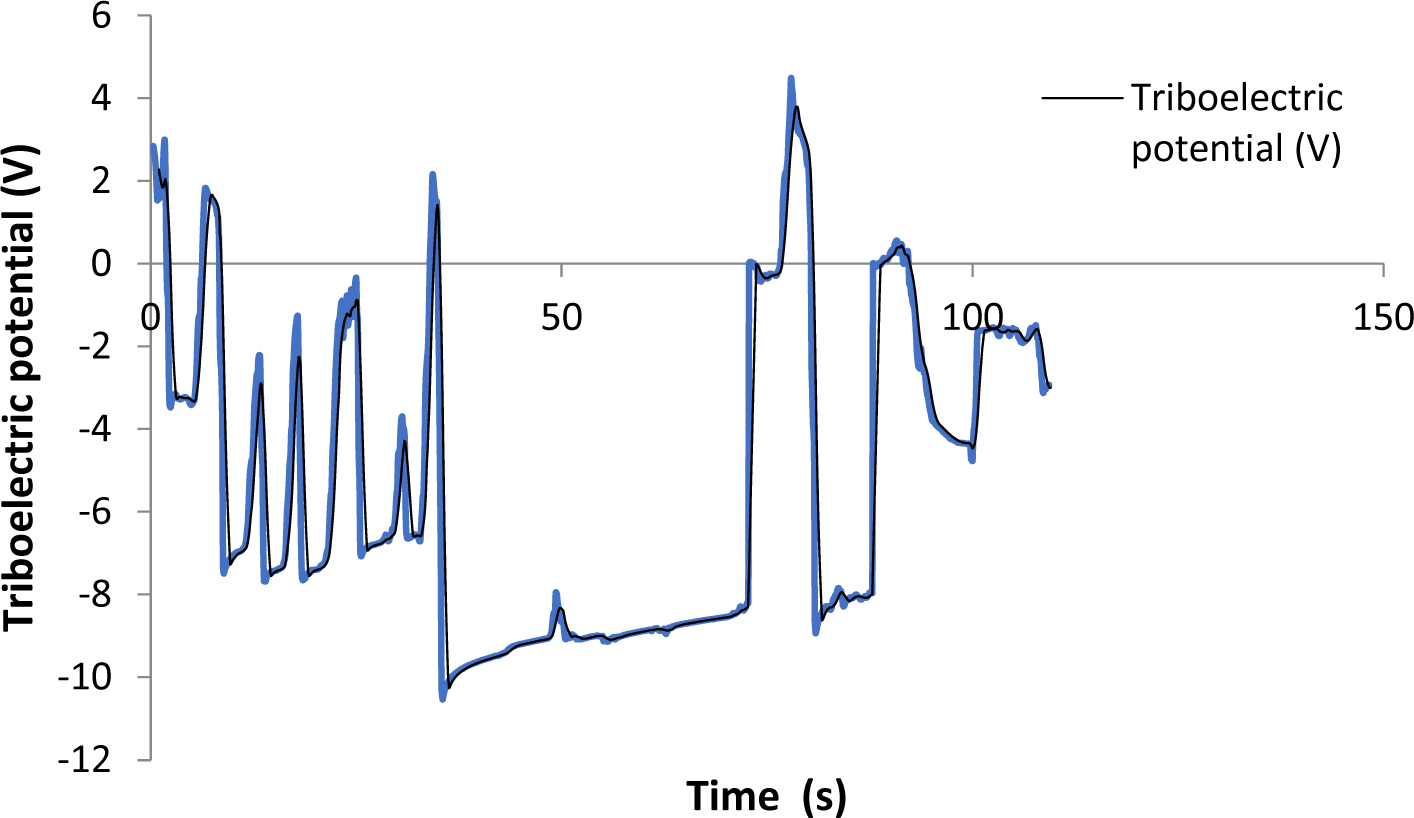
Figure 5.
Dynamics of the potential for static electric charges of triboelectric origin when the birch wood specimen is placed between and then removed from the MEC plates.
Table 2.
Modelling results of the dielectric capacitance method (DECM) and electric impedance spectrometry (EIS) method. In regression models, the independent x-variable is the actual MC (%), and the dependent y-variable is the predicted MC (%). The predicted single measurement tolerance bands on the 95% confidence level, yupper and ylower, are calculated using formulas 2, 3, 4 and 5. The SE is calculated according to formula 6. The tolerance interval (TI) is calculated using the formula TI = yupper - ylower. N is the number of measurements repeated under the same test conditions and k is the number of measurements averaged per series of measurements (i.e., the averaging period). For models with a series of measurements (k), the identification type shall be “multiple”.
| N obs., k-period | Method type, Fig. no. | Equations for predicting single measurement tolerance bands and TI | R2 | p-value and tests* | SE |
|---|---|---|---|---|---|
| N = 63 | DECM (above FSP), Fig. 6 | yupper = 1.0131x + 5.9063 ylower = 0.9406x +0.8399 TI = 0.0728x +5.075 | 0.97 | <0.01 K-S | 4.88 |
| N = 42 | DECM (below FSP), Fig. 7 | yupper = 1.0135x + 0.2792 ylower = 0.9788x – 0.1954 TI = 0.0348x +0.4746 | 0.99 | <0.01 K-S S-W | 0.61 |
| N = 63 k = 16 | DECM (above FSP) (multiple), Fig. 8 | yupper = 1.006x + 0.44 ylower = 0.9929x – 0.4163 TI = 0.0124x + 0.8775 | 0.99 | <0.01 K-S S-W | 0.46 |
| N = 63 | EIS (above FSP), Fig. 9 | yupper = 0.9448x + 11.196 ylower = 0.787x + 2.41 TI = 0.1622x + 8.135 | 0.87 | <0.01 K-S | 5.01 |
| N = 63 k = 16 | EIS (above FSP) (multiple), Fig. 10 | yupper = 1.0134x +1.728 ylower = 0.968x – 0.84 TI = 0.0365x + 2.836 | 0.99 | <0.01 K-S | 0.867 |
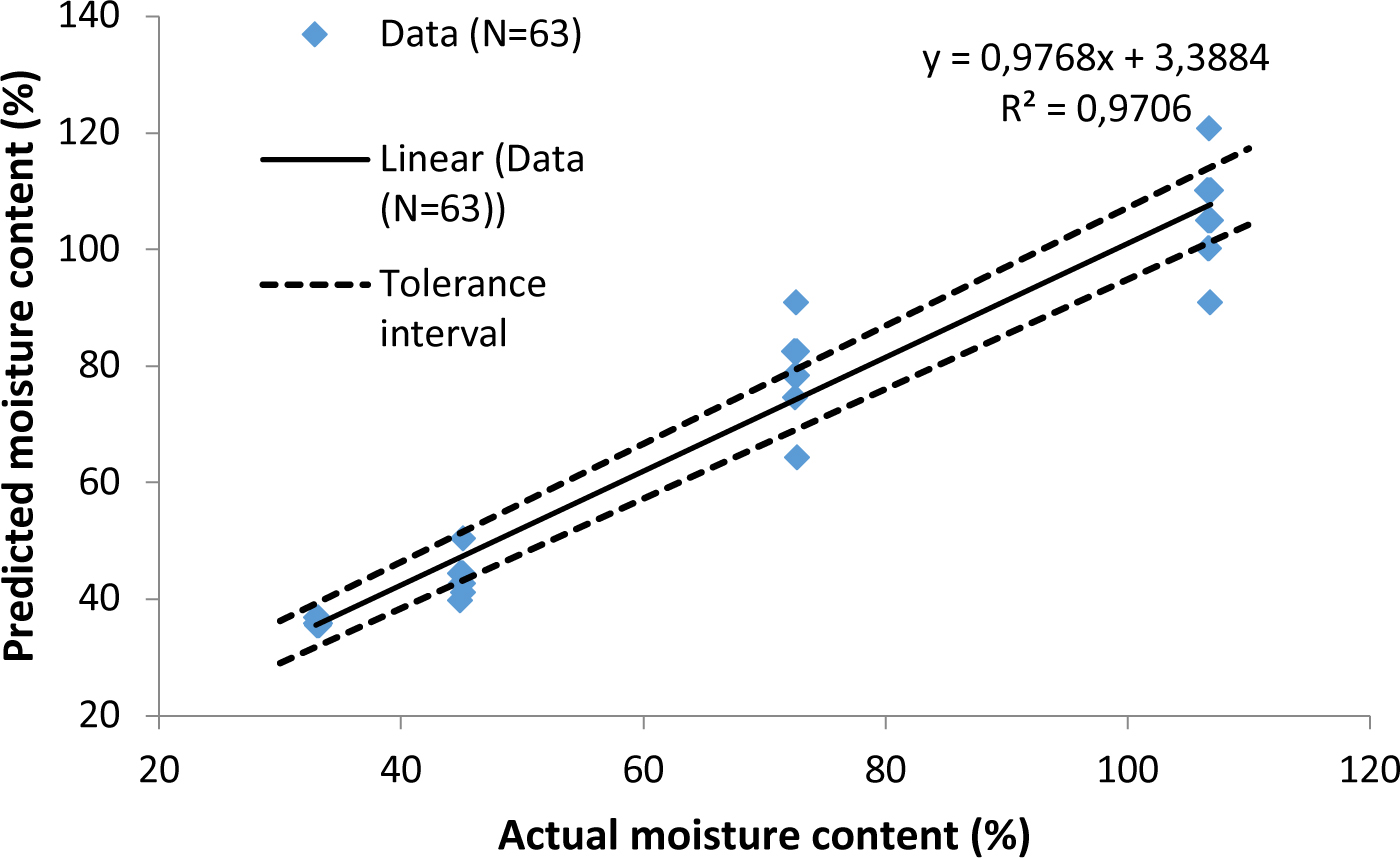
Figure 6.
DECM modelling at wood moisture levels above FSP.
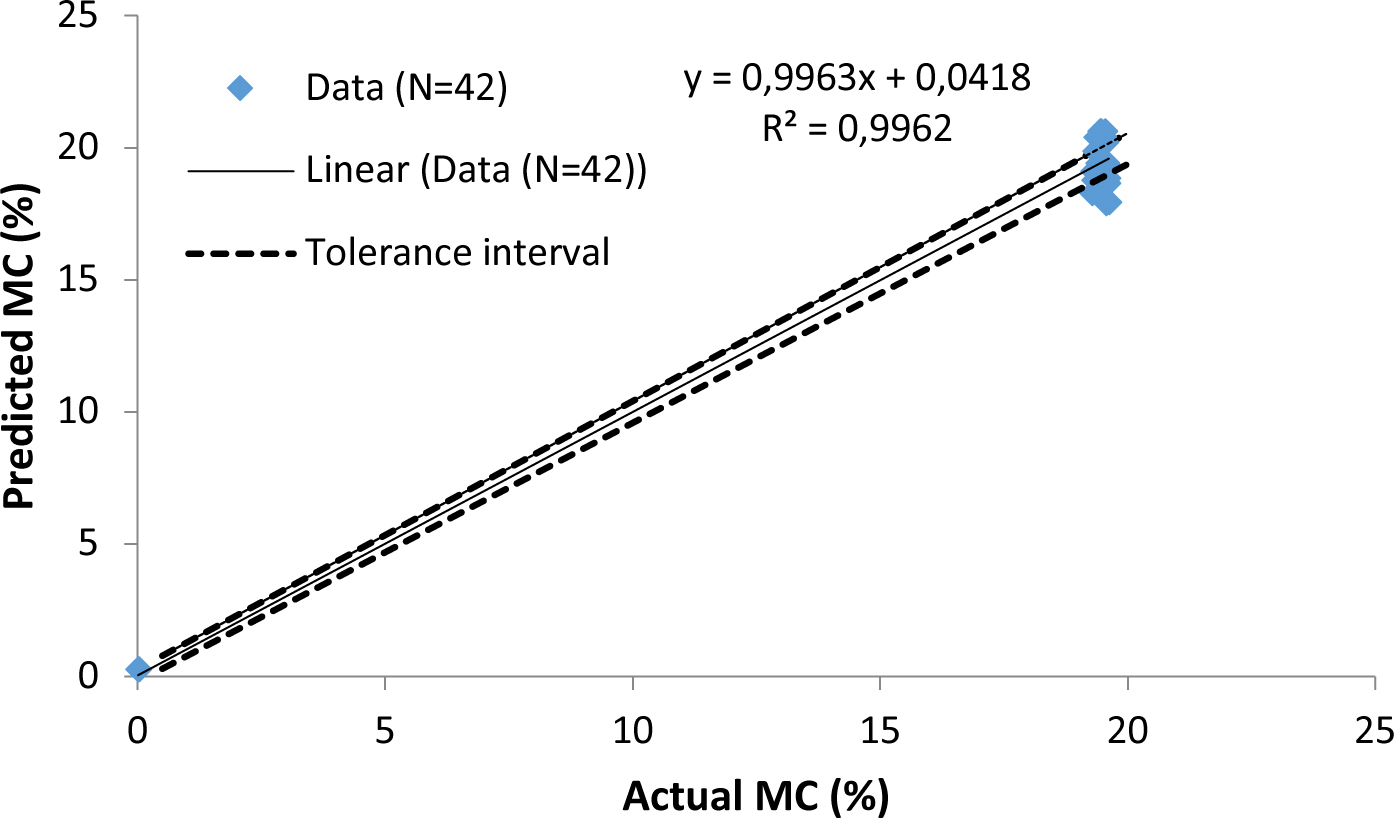
Figure 7.
DECM modelling at wood moisture levels below FSP.
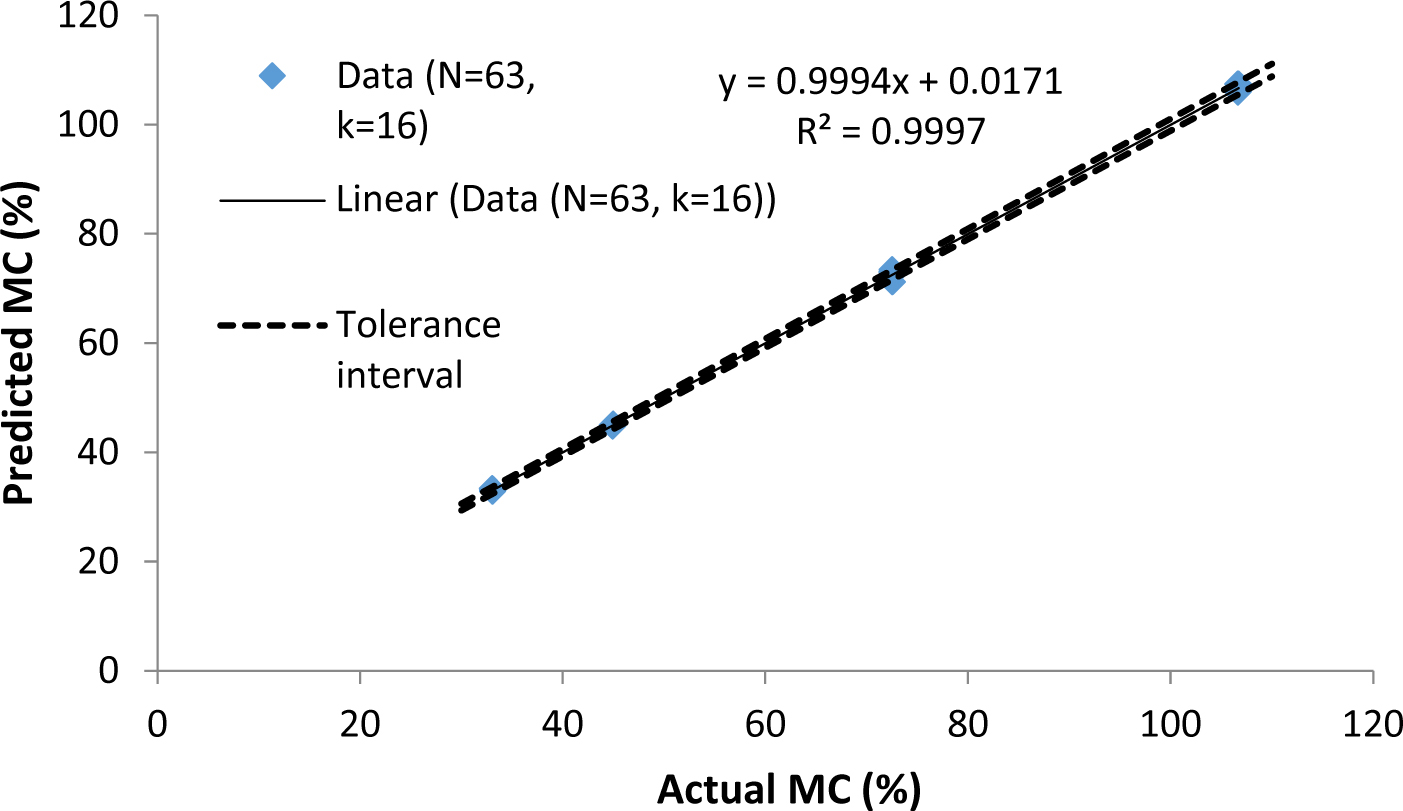
Figure 8.
DECM modelling at wood moisture levels above FSP, multiple (k = 16) model.
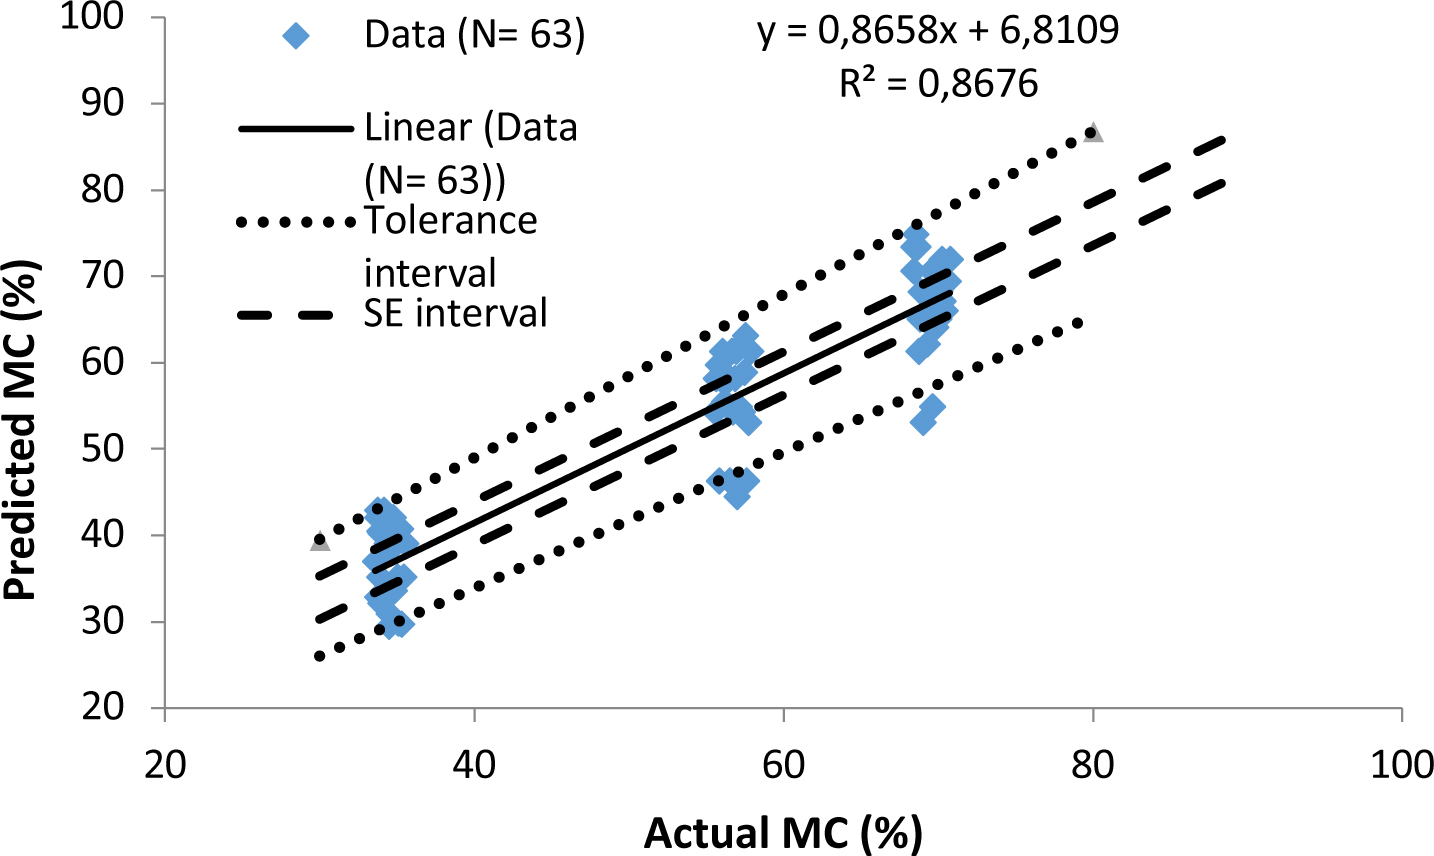
Figure 9.
EIS modelling at wood moisture levels above FSP.
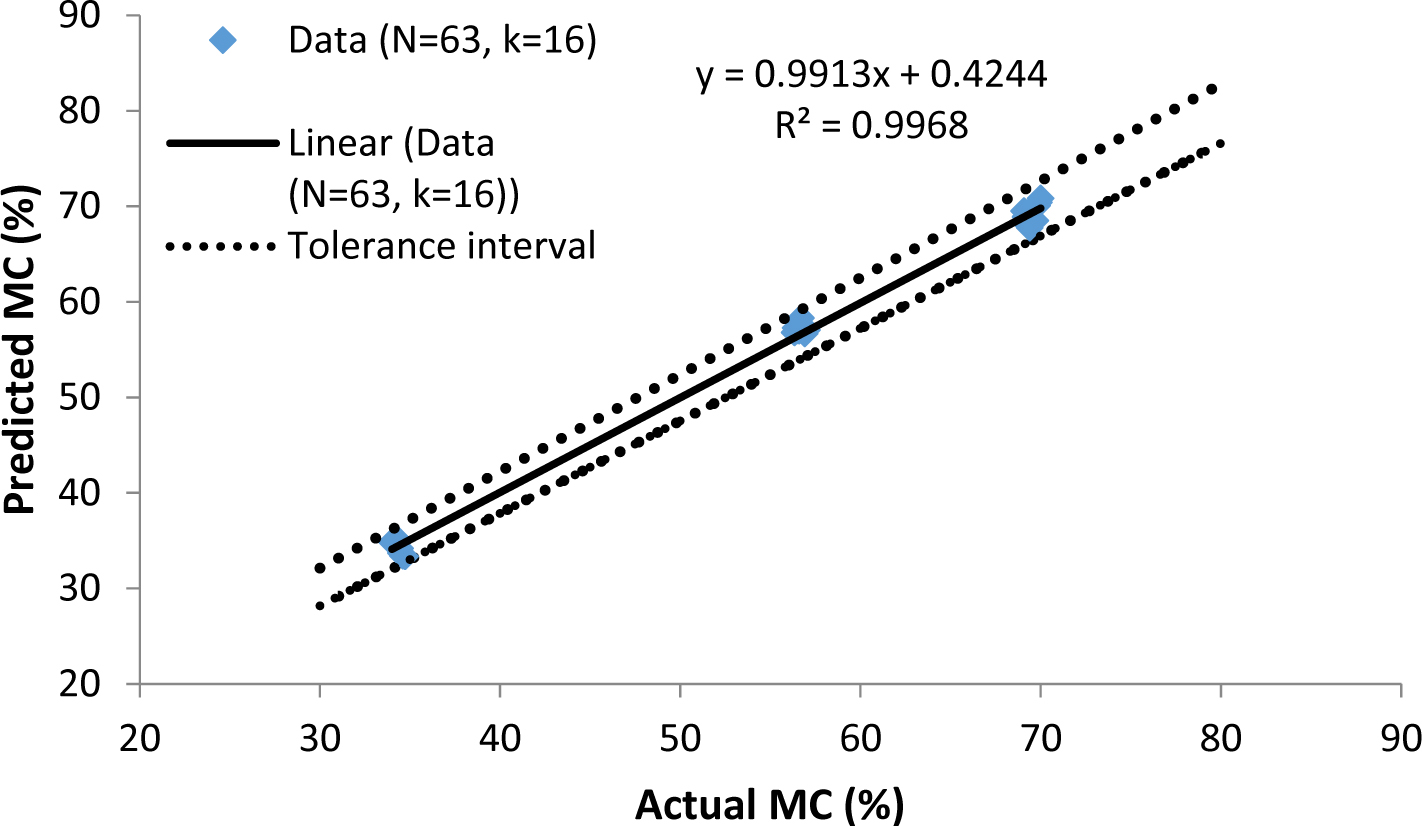
Figure 10.
EIS modelling at wood moisture levels above FSP, multiple (k = 16) model.
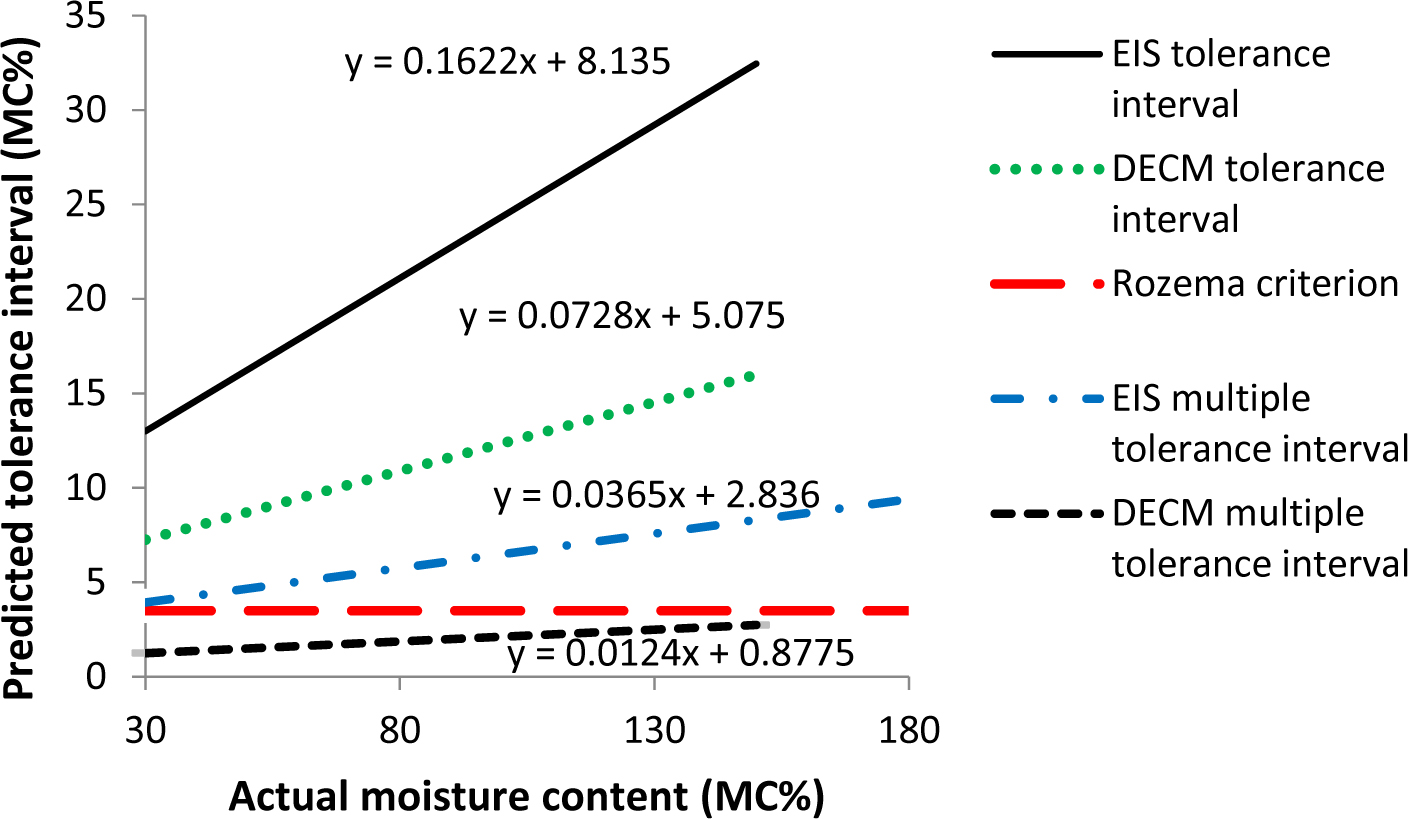
Figure 11.
Comparison of the tolerance intervals (TI) predicted for single measurements of different models (using formulas in Table 2) and with the Rozema quality criterion at wood moisture levels above FSP. Corresponding graphs of the predicted TI are given from top to bottom as follows: EIS, DECM, EIS multiple, Rozema quality criterion (dashed line, parallel to x-axis), and DECM multiple.