
Table 1.
Characteristics of respondents (n = 30).
| Variables | n | % |
|---|---|---|
| Age (years) | ||
| <20 | 0 | 0 |
| 20–35 | 21 | 70 |
| >35 | 9 | 30 |
| The number of children | ||
| 1 child | 12 | 40 |
| 2–4 children | 16 | 53 |
| >4 children | 2 | 7 |
| Education level | ||
| Primary | 5 | 16.7 |
| Secondary (junior and senior high school) | 21 | 70 |
| University | 4 | 13.3 |
| Occupation | ||
| Employed | 17 | 56.7 |
| Unemployed | 13 | 43.3 |
Table 2.
Variable mean and standard deviation values
| Variable | n | Minimum | Maximum | Mean | SD | Variance |
|---|---|---|---|---|---|---|
| Knowledge | 30 | 7 | 16 | 10.33 | 2.279 | 5.195 |
| Attitude | 30 | 34 | 61 | 48.17 | 6.298 | 39.661 |
| Motivation | 30 | 24 | 45 | 34.03 | 5.014 | 25.137 |
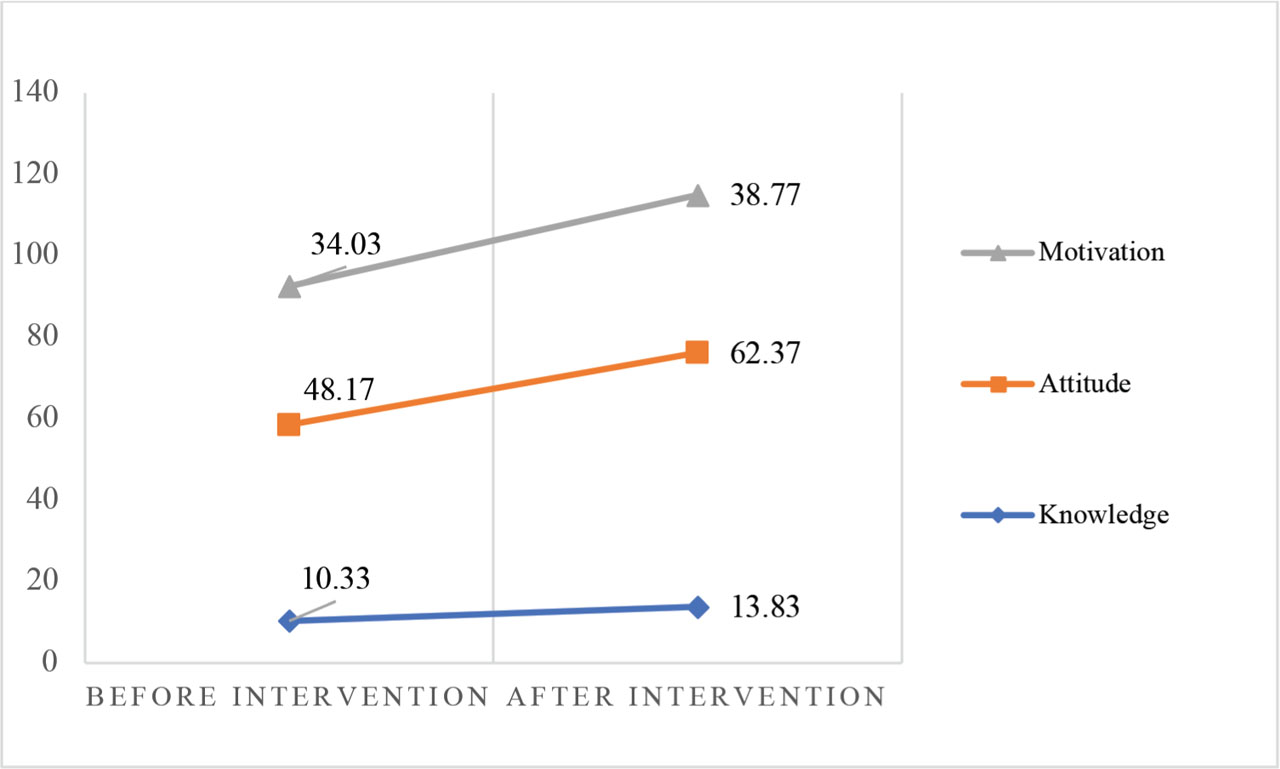
Figure 1.
The average value of improvement in knowledge, attitudes, motivation, and implementation of food safety before and after the intervention.
Table 3.
Normality test.
| Variable | Sig | Result |
|---|---|---|
| Pretest knowledge | 0.002 | Not normal |
| Posttest knowledge | 0.152 | Normal |
| Pretest attitude | 0.746 | Normal |
| Posttest attitude | 0.005 | Not normal |
| Pretest motivation | 0.710 | Normal |
| Posttest motivation | 0.007 | Not normal |
Table 4.
Results of the bivariate test of knowledge, attitude, and motivation before and after the intervention (n = 30).
| Variable | Min | Max | Mean ± SD | Z score | P-value* |
|---|---|---|---|---|---|
| Knowledge | −4.72 | <0.001 | |||
| Before intervention | 7 | 16 | 10.33 ± 2.27 | ||
| After intervention | 11 | 18 | 13.83 ± 1.66 | ||
| Attitude | −4.46 | <0.001 | |||
| Before intervention | 34 | 52 | 48.17 ± 6.29 | ||
| After intervention | 61 | 68 | 62.37 ± 4.06 | ||
| Motivation | −3.38 | 0.001 | |||
| Before intervention | 24 | 45 | 34.03 ± 5.01 | ||
| After intervention | 28 | 48 | 38.77 ± 6.05 |
Table 5.
Robustness check.
| Variable | t-score | P-value | 95% CI |
|---|---|---|---|
| Knowledge | |||
| Handling of raw food and contamination risks | −2.112 | 0.043 | −0.262, −0.004 |
| Cleanliness and hygiene in food preparation | −2.408 | 0.023 | −0.308, −0.025 |
| Safe food storage | −3.247 | 0.003 | −0.435, −0.099 |
| Safe cooking techniques | −2.693 | 0.012 | −0.352, −0.048 |
| Food safety in toddler consumption | −3.808 | 0.001 | −0.474, −0.126 |
| Prevention of choking risks | −1.795 | 0.083 | −0.214, 0.014 |
| Use of harmful substances in food processing | −2.971 | 0.006 | −0.394, −0.073 |
| Attitude | |||
| Beliefs and perceptions regarding food safety | 11.298 | <0.001 | 2.020, 2.913 |
| Behavior in food product safety checks | 11.937 | <0.001 | 2.066, 3.001 |
| Safe food handling and processing practices | 12.740 | <0.001 | 2.132, 2.934 |
| Attitudes toward potential food contamination risks | 12.917 | 0.014 | 2.212, 3.055 |
| Attitudes toward food source and purchase locations | 17.750 | 0.004 | 2.507, 3.160 |
| Attitudes toward increasing knowledge of food safety | 16.078 | <0.001 | 2.647, 3.419 |
| Motivation | |||
| Value motivation | −6.151 | <0.001 | −1.954, −0.979 |
| Action motivation | −2.140 | 0.041 | −0.978, −0.200 |
| Cognitive motivation | −3.084 | 0.004 | −0.942, −0.191 |