Figure 1.
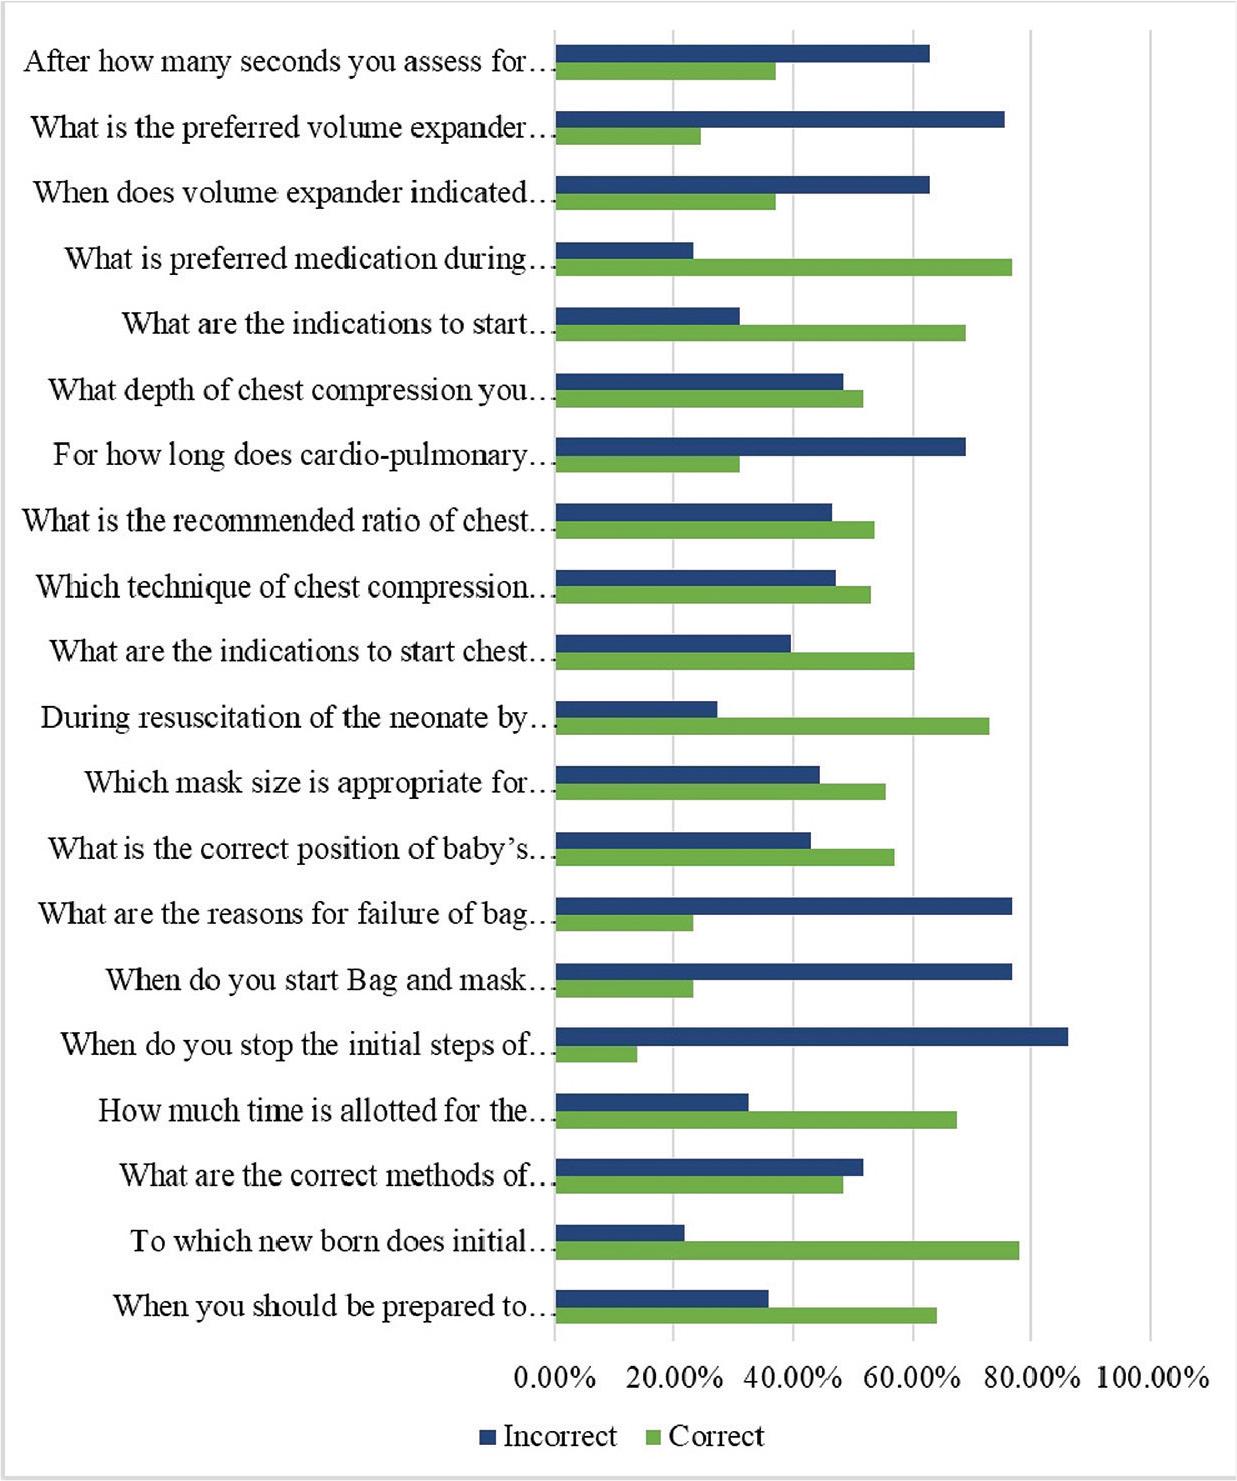
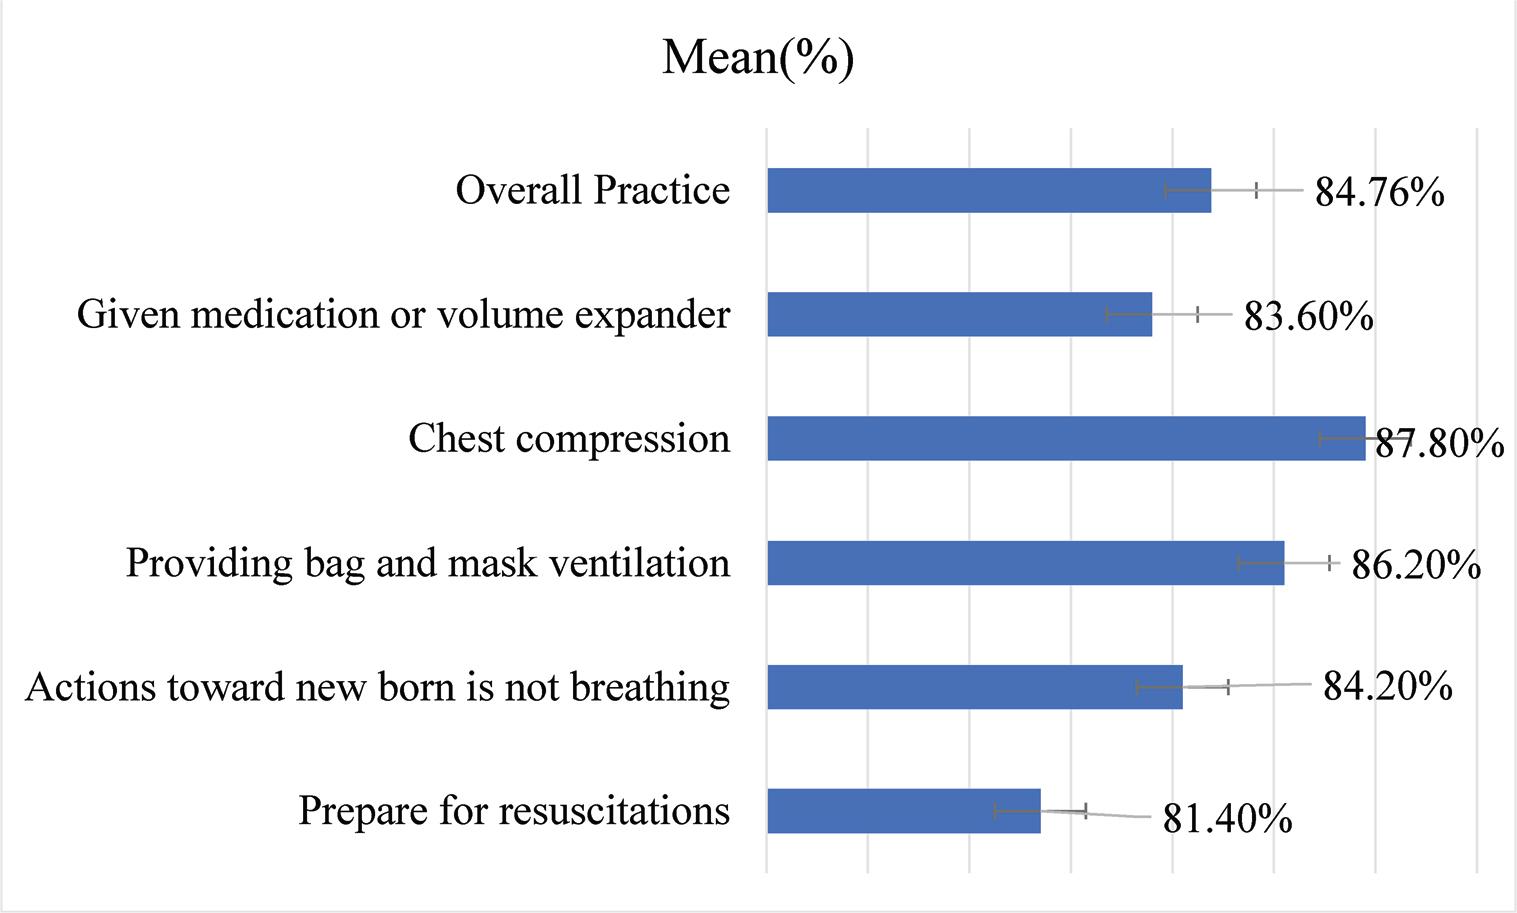
Figure 2.
Factors associated with participants’ knowledge toward neonatal resuscitation_
| Variables and categories | Mean (%) | SD (%) | T/F value | p-Value | Test used |
|---|---|---|---|---|---|
| Provider characteristics | |||||
| Age, R = 0.47 | 0.001* | Bivariate correlation | |||
| Age categories in years | 7.868 | 0.001* | One Way-ANOVA | ||
| 20–29 | 43.56 | 17.89 | |||
| 30–39 | 55.39 | 18.99 | |||
| ≥40 | 58.33 | 18.88 | |||
| Gender | 1.41 | 0.16 | Independent T-Test | ||
| Male | 49.45 | 18.15 | |||
| Female | 44.50 | 21.41 | |||
| Educational level | 1.87 | 0.15 | One Way-ANOVA | ||
| Diploma | 51.80 | 23.49 | |||
| Bachelor | 46.19 | 17.34 | |||
| Master and higher | 53.57 | 21.22 | |||
| Resuscitation training | –0.10 | 0.91 | Independent T-Test | ||
| Yes | 48.37 | 19.53 | |||
| No | 48.75 | 17.78 | |||
| Institutional characteristics Type of hospital | 1.04 | 0.35 | One Way-ANOVA | ||
| Private hospital | 45.34 | 19.86 | |||
| Referral hospital | 51.51 | 21.67 | |||
| Public hospital | 47.34 | 17.29 | |||
| Full resuscitation Material | 1.63 | 0.10 | Independent T-Test | ||
| Yes | 49.24 | 19.19 | |||
| No | 40.93 | 18.72 | |||
| Resuscitation guideline | 0.18 | 0.85 | Independent T-Test | ||
| Yes | 48.66 | 19.26 | |||
| No | 48.05 | 18.61 | |||
| Supportive supervision | 0.29 | 0.007 | Independent T-Test | ||
| Yes | 48.80 | 18.62 | |||
| No | 44.79 | 19.94 | |||
Factors associated with participants’ practice toward neonatal resuscitation_
| Variables and categories | Mean (%) | SD (%) | T/F value | p-Value | Test used |
|---|---|---|---|---|---|
| Provider characteristics | |||||
| Age, R = 0.13 | 0.10 | Bivariate correlation | |||
| Age categories in years | 0.72 | 0.48 | One way-ANOVA | ||
| 20–29 | 83.74 | 14.83 | |||
| 30–39 | 86.11 | 14.82 | |||
| ≥40 | 89.33 | 14.67 | |||
| Gender | 0.63 | 0.52 | Independent t-test | ||
| Male | 85.22 | 14.35 | |||
| Female | 83.50 | 16.08 | |||
| Educational level | 0.81 | 0.44 | One way-ANOVA | ||
| Diploma | 83.04 | 14.34 | |||
| Bachelor | 84.45 | 14.77 | |||
| Master and higher | 88.38 | 15.58 | |||
| Resuscitation training | 0.58 | 0.011 | Independent t-test | ||
| Yes | 88.44 | 15.24 | |||
| No | 77.22 | 13.01 | |||
| Institutional characteristics Type of hospital | 1.28 | 0.28 | One way-ANOVA | ||
| Private hospital | 85.24 | 14.34 | |||
| Referral hospital | 87.53 | 12.59 | |||
| Public hospital | 83.08 | 15.96 | |||
| Full resuscitation material | 1.95 | 0.06 | Independent t-test | ||
| Yes | 86.00 | 14.64 | |||
| No | 78.50 | 12.97 | |||
| Resuscitation guideline | -0.08 | 0.028 | Independent t-test | ||
| Yes | 87.71 | 15.64 | |||
| No | 76.67 | 13.72 | |||
| Supportive supervision | 0.27 | 0.000 | Independent t-test | ||
| Yes | 88.43 | 15.26 | |||
| No | 67.33 | 13.51 | |||
Sociodemographic characteristics of the study participants_
| Variables and categories | Frequency (N) | Percentage (%) |
|---|---|---|
| Age (years), Mean = 29.08 ± 5.48, Range = (21–44) | ||
| Age categories in years | ||
| 20–29 | 94 | 62.3 |
| 30–39 | 51 | 33.8 |
| ≥40 | 6 | 4.0 |
| Gender | ||
| Male | 111 | 73.5 |
| Female | 40 | 26.5 |
| Educational level | ||
| Diploma | 25 | 16.6 |
| Bachelor | 105 | 69.5 |
| Master and higher | 21 | 13.9 |
| Resuscitation Training | ||
| Yes | 108 | 71.5 |
| No | 40 | 26.5 |
| Type of hospital | ||
| Private hospital | 29 | 19.2 |
| Referral hospital | 43 | 28.5 |
| Public hospital | 79 | 52.3 |
| Full resuscitation material | ||
| Yes | 132 | 87.4 |
| No | 19 | 12.6 |
| Resuscitation guideline | ||
| Yes | 90 | 59.6 |
| No | 61 | 40.4 |
| Supportive supervision | ||
| Yes | 105 | 69.5 |
| No | 46 | 30.5 |