Figure 1.
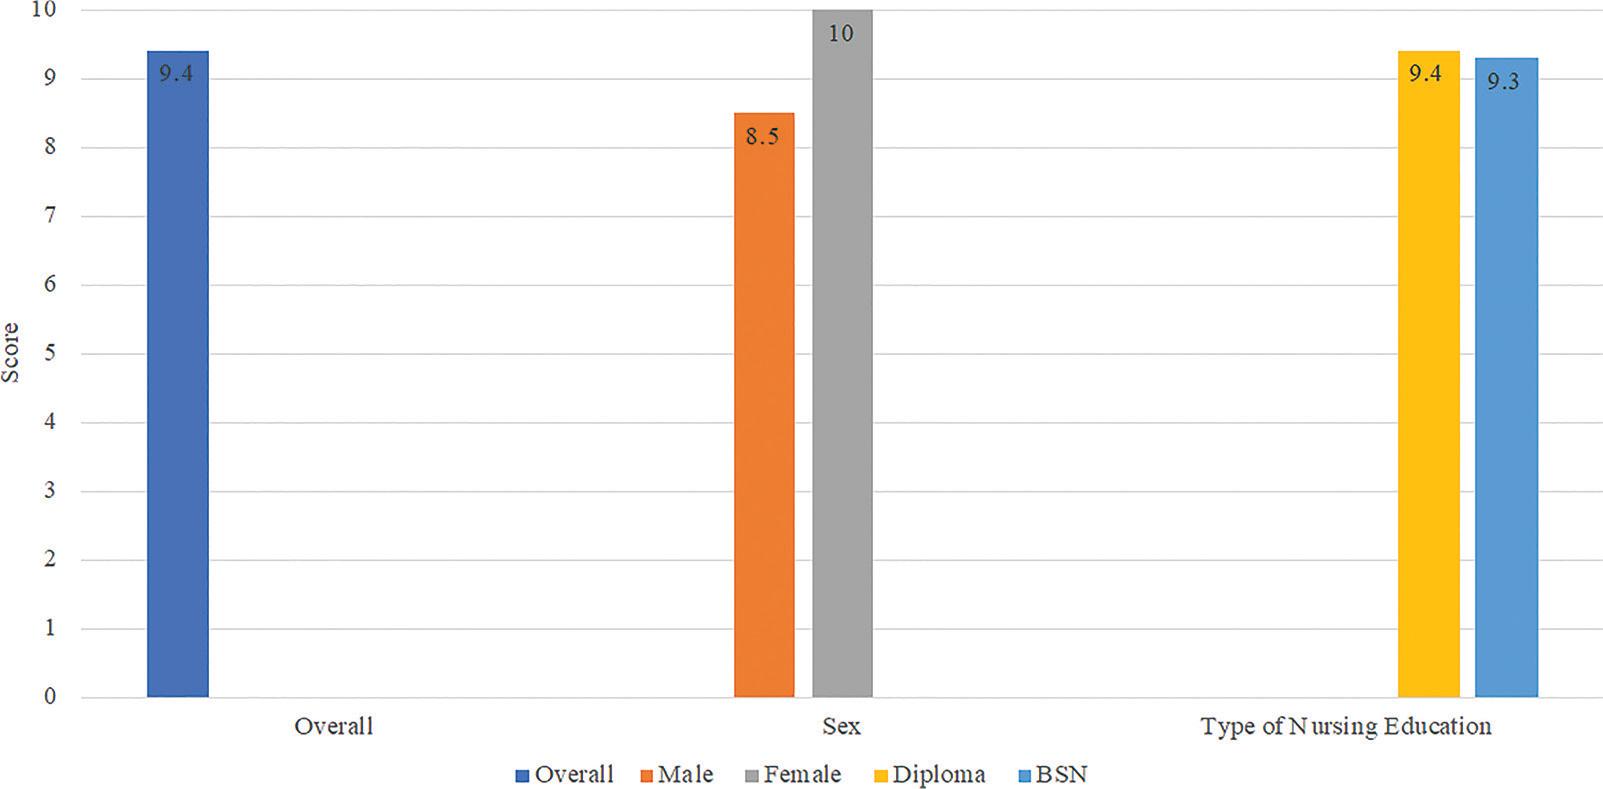
Comparison of nurses’ physical assessment performance by gender and type of nursing degree (N = 101)_
| Components | Sex | Professional qualification | ||||
|---|---|---|---|---|---|---|
| Male (%) | Female (%) | P-value | Diploma (%) | BSN (%) | P-value | |
| Hand washing | 58.3 | 77.4 | 0.129 | 69.2 | 68.8 | 0.972 |
| Introduction to patient | 70.8 | 87.1 | 0.180 | 79.5 | 81.3 | 1.00 |
| General survey | 79.2 | 83.9 | 0.733 | 82.1 | 81.3 | 1.00 |
| Vital signs | 91.7 | 100.0 | 0.186 | 100.0 | 87.5 | 0.081 |
| Orientation | 91.7 | 93.5 | 1.00 | 92.3 | 93.8 | 1.00 |
| Pupils (PERRLA) | 79.2 | 83.9 | 0.733 | 84.6 | 75.0 | 0.453 |
| Neck veins | 4.2 | 3.2 | 1.00 | 2.6 | 6.3 | 0.501 |
| Skin | 91.7 | 96.8 | 0.575 | 97.4 | 87.5 | 0.200 |
| Peripheral edema | 91.7 | 87.1 | 0.686 | 87.2 | 93.7 | 0.660 |
| Bilateral checks | 62.5 | 83.9 | 0.071 | 71.8 | 81.3 | 0.734 |
| Homan’s signs | 4.2 | 16.1 | 0.216 | 12.8 | 6.3 | 0.478 |
| Pain | 50.0 | 77.4 | 0.034 | 66.7 | 62.5 | 0.768 |
| Breath sounds | 0.0 | 3.2 | 1.00 | 2.56 | 0.0 | 1.00 |
| Heart sounds | 0.0 | 3.2 | 1.00 | 2.56 | 0.0 | 1.00 |
| Bowel sounds | 25.8 | 20.8 | 0.667 | 20.5 | 31.5 | 0.395 |
| Closure | 58.3 | 74.2 | 0.214 | 62.2 | 37.8 | 0.041 |
Descriptive evaluation of physical assessment by critical care nurses (n = 101)_
| Components | Correct (%) | Incorrect (%) | Not performed (%) |
|---|---|---|---|
| Hand washing | 69.1 | 12.7 | 18.2 |
| Introduction to patient | 80.0 | 5.5 | 14.5 |
| General survey | 81.8 | 12.7 | 5.5 |
| Vital signs | 96.4 | 3.6 | 0.0 |
| Orientation | 92.7 | 7.3 | 0.0 |
| Pupils (PERRLA) | 81.8 | 9.1 | 9.1 |
| Neck veins | 3.6 | 20.0 | 76.4 |
| Skin | 94.5 | 3.6 | 1.8 |
| Peripheral edema | 89.1 | 7.3 | 3.6 |
| Bilateral checks | 74.5 | 10.9 | 14.5 |
| Homan’s signs | 10.9 | 16.9 | 72.7 |
| Pain | 65.5 | 29.1 | 5.5 |
| Breath sounds | 1.8 | 7.3 | 90.9 |
| Heart sounds | 1.8 | 1.8 | 96.4 |
| Bowel sounds | 23.6 | 16.4 | 60.0 |
| Closure | 67.3 | 7.3 | 25.5 |