

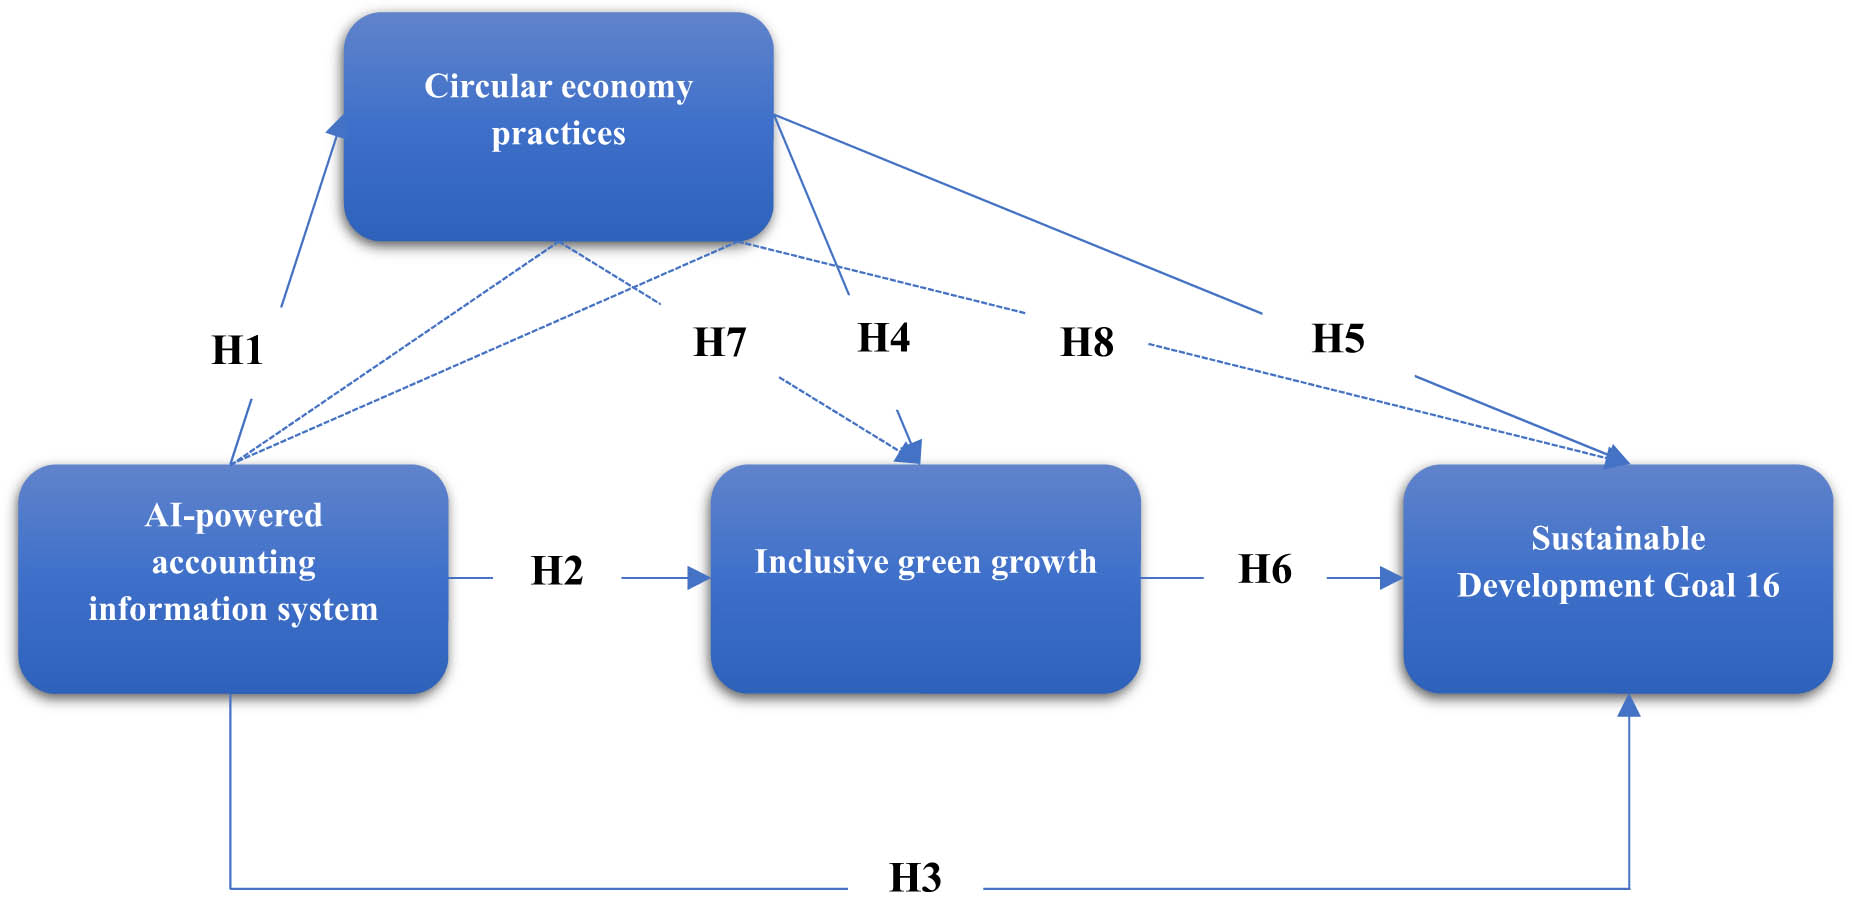
Figure 1
Research model and hypotheses.
(Source: Authors’ own proposal)
Table 1
Variables and items.
| Variables | Items | Description | Sources |
|---|---|---|---|
| Artificial intelligence-powered accounting information system | AIA1 | Our organisation acknowledges the integration of artificial intelligence in accounting processes, enhancing the efficiency of the accounting system | Abu Afifa et al. (2025) |
| AIA2 | Our organisation acknowledges that artificial intelligence in accounting processes enhances efficiency in budget planning and performance evaluation methods | ||
| AIA3 | Our organisation acknowledges that artificial intelligence in accounting processes enhances the efficiency of decision support systems | ||
| AIA4 | Our organisation acknowledges that artificial intelligence in accounting processes enhances efficiency in planning and control | ||
| AIA5 | Our organisation acknowledges that artificial intelligence in accounting methods enhances efficiency in responsibility accounting | ||
| Circular economy practices (CEE) | CEE1 | Our organization proactively shares certain resources to enhance collective efficiency | Kuzma et al. (2021); Hazen et al. (2021); Pizzi et al. (2022) |
| CEE2 | Our organization encourages energy conservation | ||
| CEE3 | Our organization promotes waste recycling | ||
| CEE4 | Our organization takes initiative in generating useful contributions for partners inside the public service supply chain | ||
| CEE5 | Our organization actively addresses operational matters by implementing a suitable organisation model aligned with circular economy principles | ||
| Sustainable Development Goal 16 | SDG_16_1 | Our organization contributes to promoting peace and reducing violence in society | Greenland et al. (2023) |
| SDG_16_2 | Our organization supports diversity and social harmony | ||
| SDG_16_3 | Our organization promotes fair laws and justice for all | ||
| SDG_16_4 | Our organization supports industry regulation and accountability | ||
| SDG_16_5 | Our organization promotes accountable governments and public institutions | ||
| Inclusive green growth | IGG1 | Our organization's inclusive green growth practices recognize the contributions of marginalized groups as stakeholders | Bouma and Berkhout (2015), Kourula et al. (2017), Chapman and Shigetomi (2018) |
| IGG2 | Our organization’s inclusive green growth practices promote social equity | ||
| IGG3 | Our organization’s inclusive green growth practices enhance ecological environments | ||
| IGG4 | Our organization’s inclusive green growth practices have the potential to support long-term growth by reducing poverty and expanding the middle class | ||
| IGG5 | Our organization’s inclusive green growth practices create employment opportunities and enhance resilience to economic shocks |
(Source: Author’s contribution)
Table 2
Demographic characteristics of survey respondents.
| Items | Frequency | Percentage |
|---|---|---|
| Gender of respondent | ||
| Male | 235 | 33.01 |
| Female | 477 | 66.99 |
| Age of respondent | ||
| Under 30 | 26 | 3.65 |
| 30 to under 40 | 287 | 40.31 |
| 40 to under 50 | 319 | 44.80 |
| Over 50 | 80 | 11.24 |
| Experience of respondent (years) | ||
| Under 10 | 42 | 5.90 |
| 10 to under 20 | 398 | 55.90 |
| 20 to under 30 | 215 | 30.20 |
| Over 30 | 57 | 8.01 |
| Education | ||
| Undergraduate | 677 | 95.08 |
| Postgraduate | 35 | 4.92 |
(Source: Extracted from statistical software and authors’ own study)
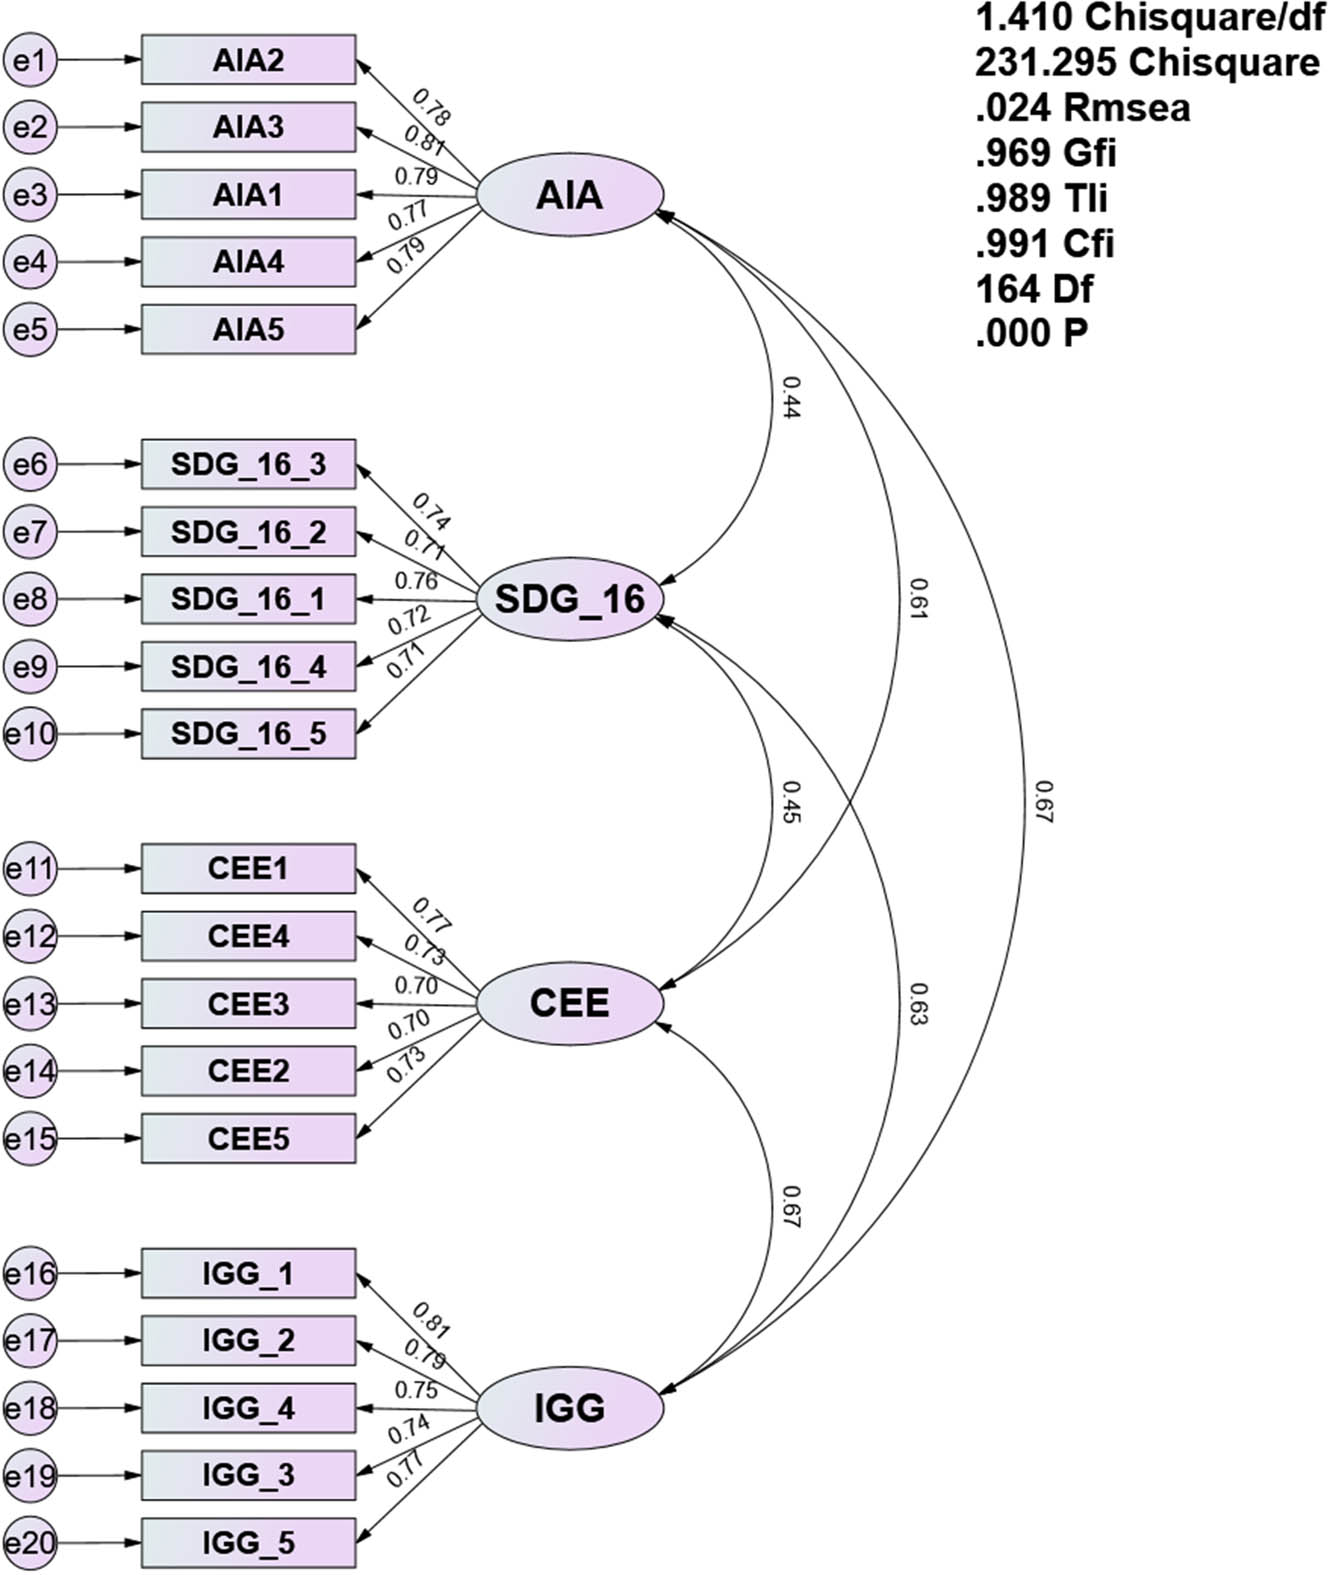
Figure 2
CFA result.
(Source: Extracted from statistical software and authors’ own study)
Table 3
Construct reliability and convergent validity.
| Constructs and operationalisation | Convergent validity | Construct reliability | Result | |||||||||
|---|---|---|---|---|---|---|---|---|---|---|---|---|
| Factor loading ranges | AVE | Cronbach’s alpha | Composite reliability (rho_c) | Composite reliability (rho_a) | ||||||||
| Artificial intelligence-powered accounting information system | AIA | 0.821–0.848 | 0.696 | 0.891 | 0.920 | 0.892 | Retained | |||||
| Circular economy practices | CEE | 0.768–0.818 | 0.622 | 0.848 | 0.892 | 0.849 | Retained | |||||
| Inclusive green growth | IGG | 0.798–0.852 | 0.676 | 0.880 | 0.912 | 0.881 | Retained | |||||
| Sustainable development goal 16 | SDG_16 | 0.774–0.814 | 0.625 | 0.850 | 0.893 | 0.853 | Retained | |||||
(Source: Extracted from statistical software and authors’ own study)
Table 4
Discriminant validity.
| Fornell–Larcker criterion | ||||
|---|---|---|---|---|
| AIA | CEE | SDG_16 | IGG | |
| AIA | 0.835 | |||
| CEE | 0.528 | 0.789 | ||
| SDG_16 | 0.389 | 0.385 | 0.790 | |
| IGG | 0.591 | 0.586 | 0.546 | 0.822 |
| Heterotrait–monotrait ratio | ||||
|---|---|---|---|---|
| AIA | CEE | SDG_16 | IGG | |
| AIA | ||||
| CEE | 0.606 | |||
| SDG_16 | 0.444 | 0.451 | ||
| IGG | 0.666 | 0.678 | 0.628 | |
(Source: Extracted from statistical software and authors’ own study)
Table 5
Results summary of hypotheses acceptance.
| Relevant path | Path coefficient | Standard deviation (STDEV) | 95% Confidence interval | VIF | t-value | p-value | Result |
|---|---|---|---|---|---|---|---|
| Direct effect | |||||||
| AIA → CEE | 0.528 | 0.027 | [0.471–0.579] | 1.000 | 19.406 | 0.000 | Supported |
| AIA → IGG | 0.390 | 0.033 | [0.324–0.454] | 1.386 | 11.796 | 0.000 | Supported |
| AIA → SDG_16 | 0.080 | 0.037 | [0.009–0.153] | 1.664 | 2.199 | 0.028 | Supported |
| CEE → IGG | 0.380 | 0.031 | [0.316–0.438] | 1.386 | 12.314 | 0.000 | Supported |
| CEE → SDG_16 | 0.077 | 0.036 | [0.006–0.145] | 1.650 | 2.166 | 0.030 | Supported |
| IGG → SDG_16 | 0.454 | 0.039 | [0.374–0.527] | 1.829 | 11.634 | 0.000 | Supported |
| Mediating effect | |||||||
| AIA → CEE → IGG | 0.201 | 0.020 | [0.163–0.240] | — | 10.231 | 0.000 | Supported |
| AIA → CEE → SDG_16 | 0.041 | 0.019 | [0.004–0.079] | — | 2.141 | 0.032 | Supported |
| R 2 | |||||||
| f 2 | |||||||
| Q 2 | |||||||
(Source: Extracted from statistical software and authors’ own study)
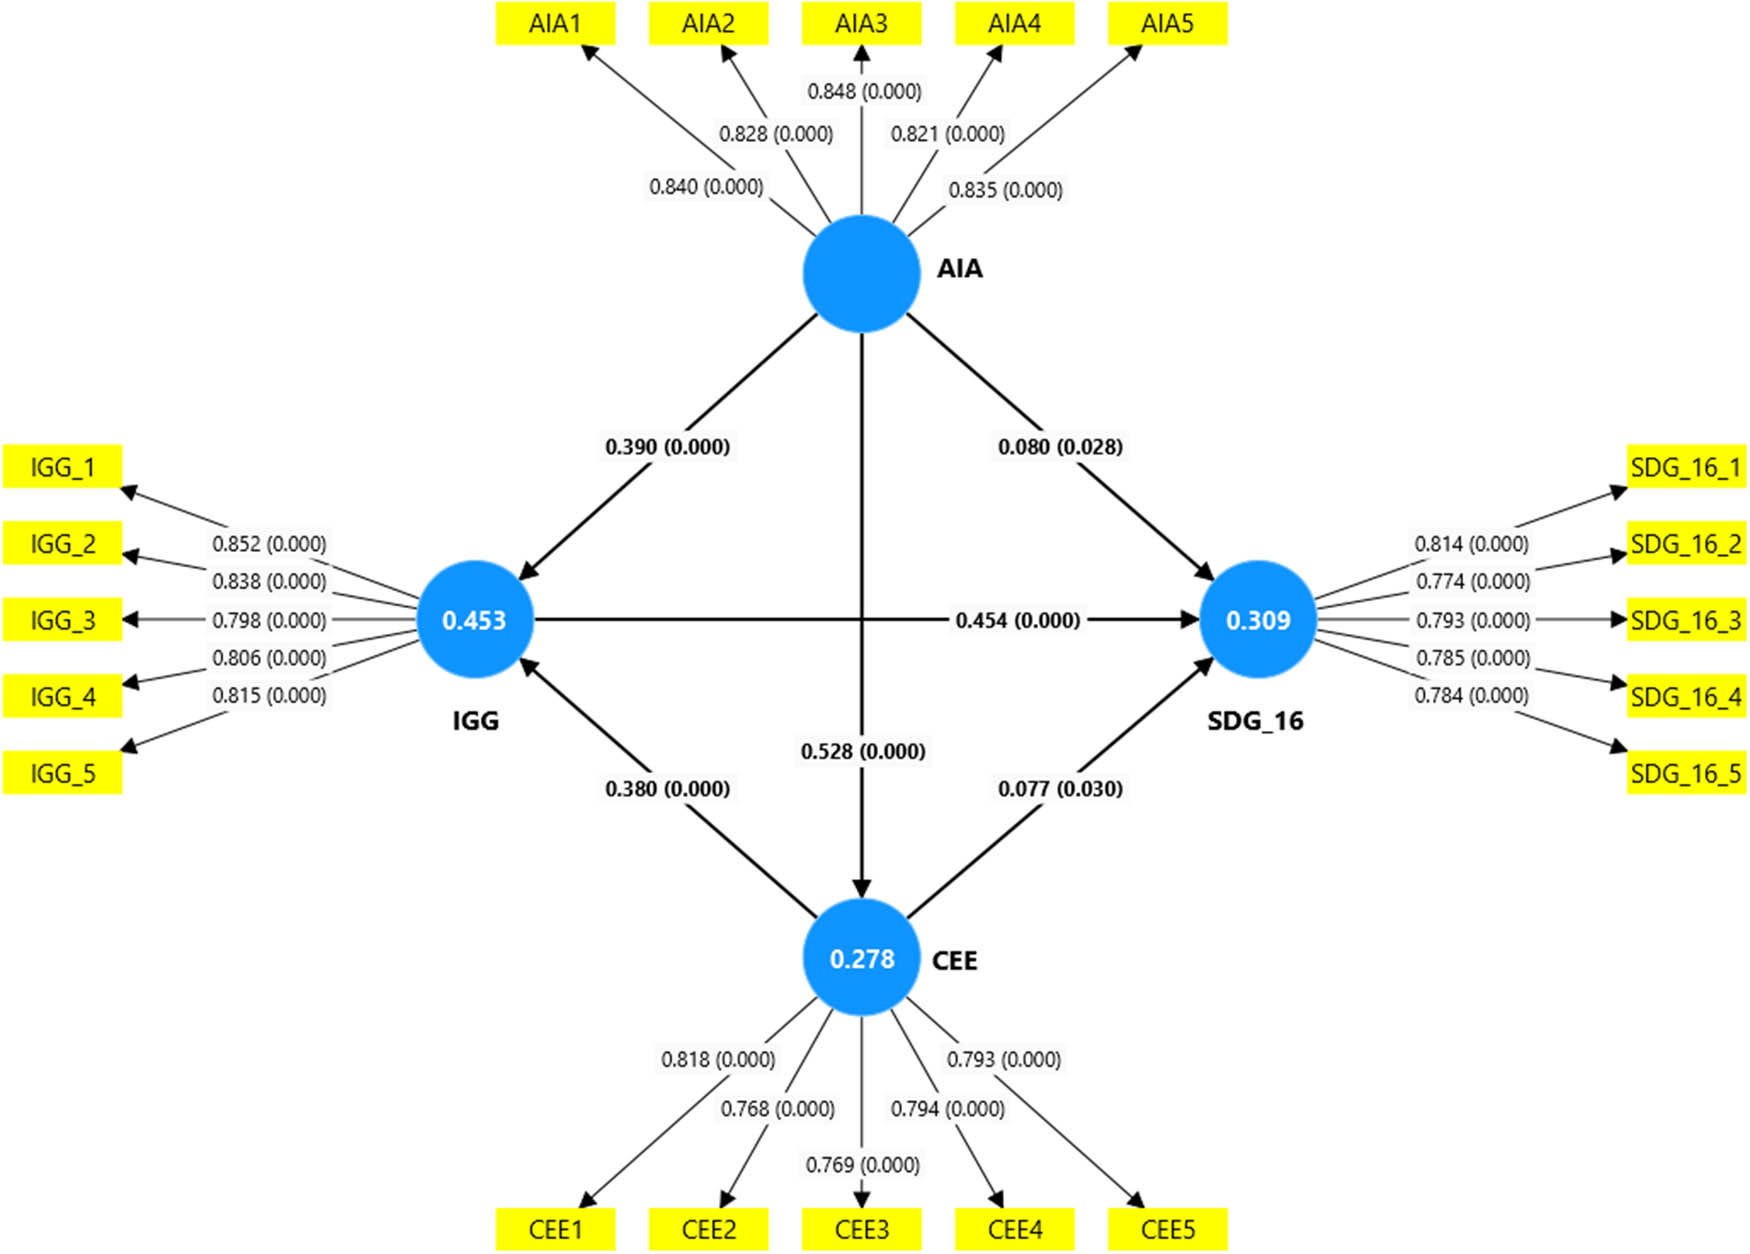
Figure 3
Structural model.
(Source: Extracted from statistical software and authors’ own study)
Table 6
fsQCA results (consistency threshold: 0.80).
| Model: fIGG = f(fAIA, fCEE) | |||
| --- Complex Solution, Parsimonious Solution, Intermediate Solution --- | |||
| Frequency cutoff: 80 | |||
| Consistency cutoff: 0.849204 | |||
| Raw coverage | Unique coverage | Consistency | |
| fAIA | 0.674014 | 0.199743 | 0.848564 |
| fCEE | 0.603794 | 0.129522 | 0.857721 |
| Solution coverage: 0.803536 | |||
| Solution consistency: 0.821044 | |||
(Source: Extracted from statistical software and authors’ own study)
Table 7
fsQCA results (consistency threshold: 0.90).
| Model: fIGG = f(fAIA, fCEE) | |||
| --- Complex Solution, Parsimonious Solution, Intermediate Solution --- | |||
| Frequency cutoff: 80 | |||
| Consistency cutoff: 0.912807 | |||
| Raw coverage | Unique coverage | Consistency | |
| fAIA*fCEE | 0.474271 | 0.474271 | 0.912807 |
| Solution coverage: 0.474271 | |||
| Solution consistency: 0.912807 | |||
(Source: Extracted from statistical software and authors’ own study)
Table 8
fsQCA results (consistency threshold: 0.80).
| Model: fSDG16 = f(fAIA, fCEE, fIGG) | |||
| --- Complex Solution, Parsimonious Solution, Intermediate Solution --- | |||
| Frequency cutoff: 16 | |||
| Consistency cutoff: 0.896712 | |||
| Raw coverage | Unique coverage | Consistency | |
| fAIA | 0.59314 | 0.0377332 | 0.838442 |
| fCEE | 0.542559 | 0.0245547 | 0.865376 |
| fIGG | 0.738079 | 0.120791 | 0.828712 |
| Solution coverage: 0.832996 | |||
| Solution consistency: 0.795891 | |||
(Source: Extracted from statistical software and authors’ own study)
Table 9
fsQCA results (consistency threshold: 0.90).
| Model: fSDG16 = f(fAIA, fCEE, fIGG) | |||
| --- Complex Solution, Parsimonious Solution, Intermediate Solution --- | |||
| Frequency cutoff: 16 | |||
| Consistency cutoff: 0.903828 | |||
| Raw coverage | Unique coverage | Consistency | |
| fAIA*fCEE | 0.423493 | 0.0326294 | 0.915166 |
| fAIA*fIGG | 0.522778 | 0.131913 | 0.87086 |
| fCEE*fIGG | 0.485375 | 0.0945106 | 0.902587 |
| Solution coverage: 0.649917 | |||
| Solution consistency: 0.859673 | |||
(Source: Extracted from statistical software and authors’ own study)