

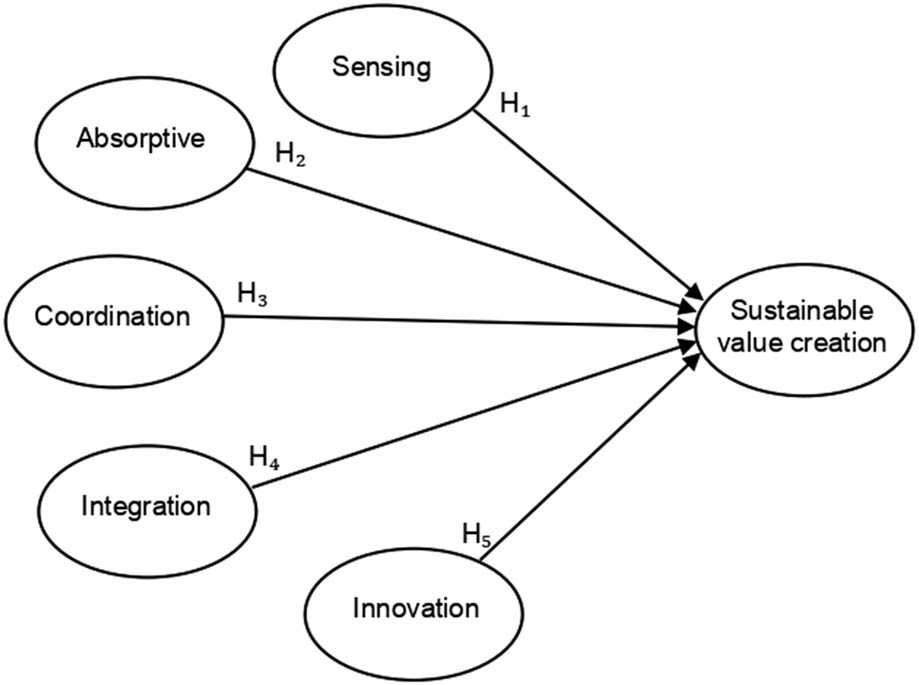
Figure 1
Hypothetical model
(Source: Own elaboration)
Table 1
Microenterprises in rural communities of Cajeme
| Localities | Microenterprises |
|---|---|
| Esperanza | 1,615 |
| Pueblo Yaqui | 746 |
| Marte R. Gómez (Tobarito) | 371 |
| Cócorit | 345 |
| Providencia | 257 |
| Quetchehueca | 105 |
| Cuauhtémoc (Campo Cinco) | 69 |
| Estación Corral | 70 |
| 31 de Octubre | 29 |
| Centauro del Norte | 2 |
(Source: Author’s own elaboration based on data from INEGI (2023))
Table 2
Cronbach’s alpha
| Variable | Alfa de Cronbach |
|---|---|
| Sensing dynamic capability (CDD) | 0.798 |
| Absorptive capacity dynamic capability (CDAC) | 0.824 |
| Integration dynamic capability (CDINT) | 0.778 |
| Coordination dynamic capability (CDC) | 0.812 |
| Innovation dynamic capability (CDINNO) | 0.879 |
| Sustainable value creation (Environmental) (CVSDA) | 0.794 |
| Sustainable value creation (Economic) (CVSDE) | 0.709 |
| Sustainable value creation (Social) (CVSDS) | 0.740 |
(Source: Own elaboration using IBM SPSS Statistics v.27)
Table 3
Number of employees and years of operation
| Number of employees | Frequency | Percentage |
|---|---|---|
| 1 a 5 | 189 | 93.1 |
| 5 a 10 | 13 | 6.4 |
| 10 a 15 | 1 | 0.5 |
| Total | 203 | 100 |
| Years of operation | Frequency | Percentage |
|---|---|---|
| 0–5 years | 90 | 44.3% |
| 6–10 years | 49 | 24.1% |
| 11–15 years | 19 | 9.4% |
| 15 or more | 45 | 22.1% |
| Total | 203 | 100 |
(Source: Own elaboration)
Table 4
Factor loadings dynamic capability variable
| Estimate | |||
|---|---|---|---|
| Innovation dynamic capability (items) (CDINOVA)17 | ← | CDINN | 0.736 |
| CDINOVA18 | ← | CDINN | 0.737 |
| CDINOVA19 | ← | CDINN | 0.891 |
| CDINOVA20 | ← | CDINN | 0.829 |
| CDD1 | ← | CDD | 0.716 |
| CDD2 | ← | CDD | 0.826 |
| CDD3 | ← | CDD | 0.725 |
| CDAC5 | ← | CDAC | 0.630 |
| CDAC7 | ← | CDAC | 0.845 |
| CDAC8 | ← | CDAC | 0.784 |
| CDI9 | ← | CDINT | 0.711 |
| Integration dynamic capability (items) (CDINTE)10 | ← | CDINT | 0.667 |
| CDINTE11 | ← | CDINT | 0.667 |
| CDINTE12 | ← | CDINT | 0.720 |
| CDC14 | ← | CDC | 0.778 |
| CDC15 | ← | CDC | 0.879 |
| CDC16 | ← | CDC | 0.639 |
(Source: Data were analyzed using IBM AMOS Version 29)
Table 5
Factor loadings SVC variable
| Estimate | |||
|---|---|---|---|
| Environmental value creation (Item) (CVDA)22 | ← | Sustainable value creation (Environmental) (CVSDA) | 0.781 |
| CVDA23 | ← | CVSDA | 0.877 |
| Economic value creation (Item) (CVDE)26 | ← | Sustainable value creation (Economic) (CVSDE) | 0.785 |
| CVDE27 | ← | CVSDE | 0.699 |
| Social value creation (Item) (CVDS)32 | ← | Sustainable value creation (Social) (CVSDS) | 0.781 |
| CVDS33 | ← | CVSDS | 0.879 |
| CVDS34 | ← | CVSDS | 0.650 |
(Source: Data were analyzed using IBM SPSS AMOS (Version 29). The table was prepared by the author)
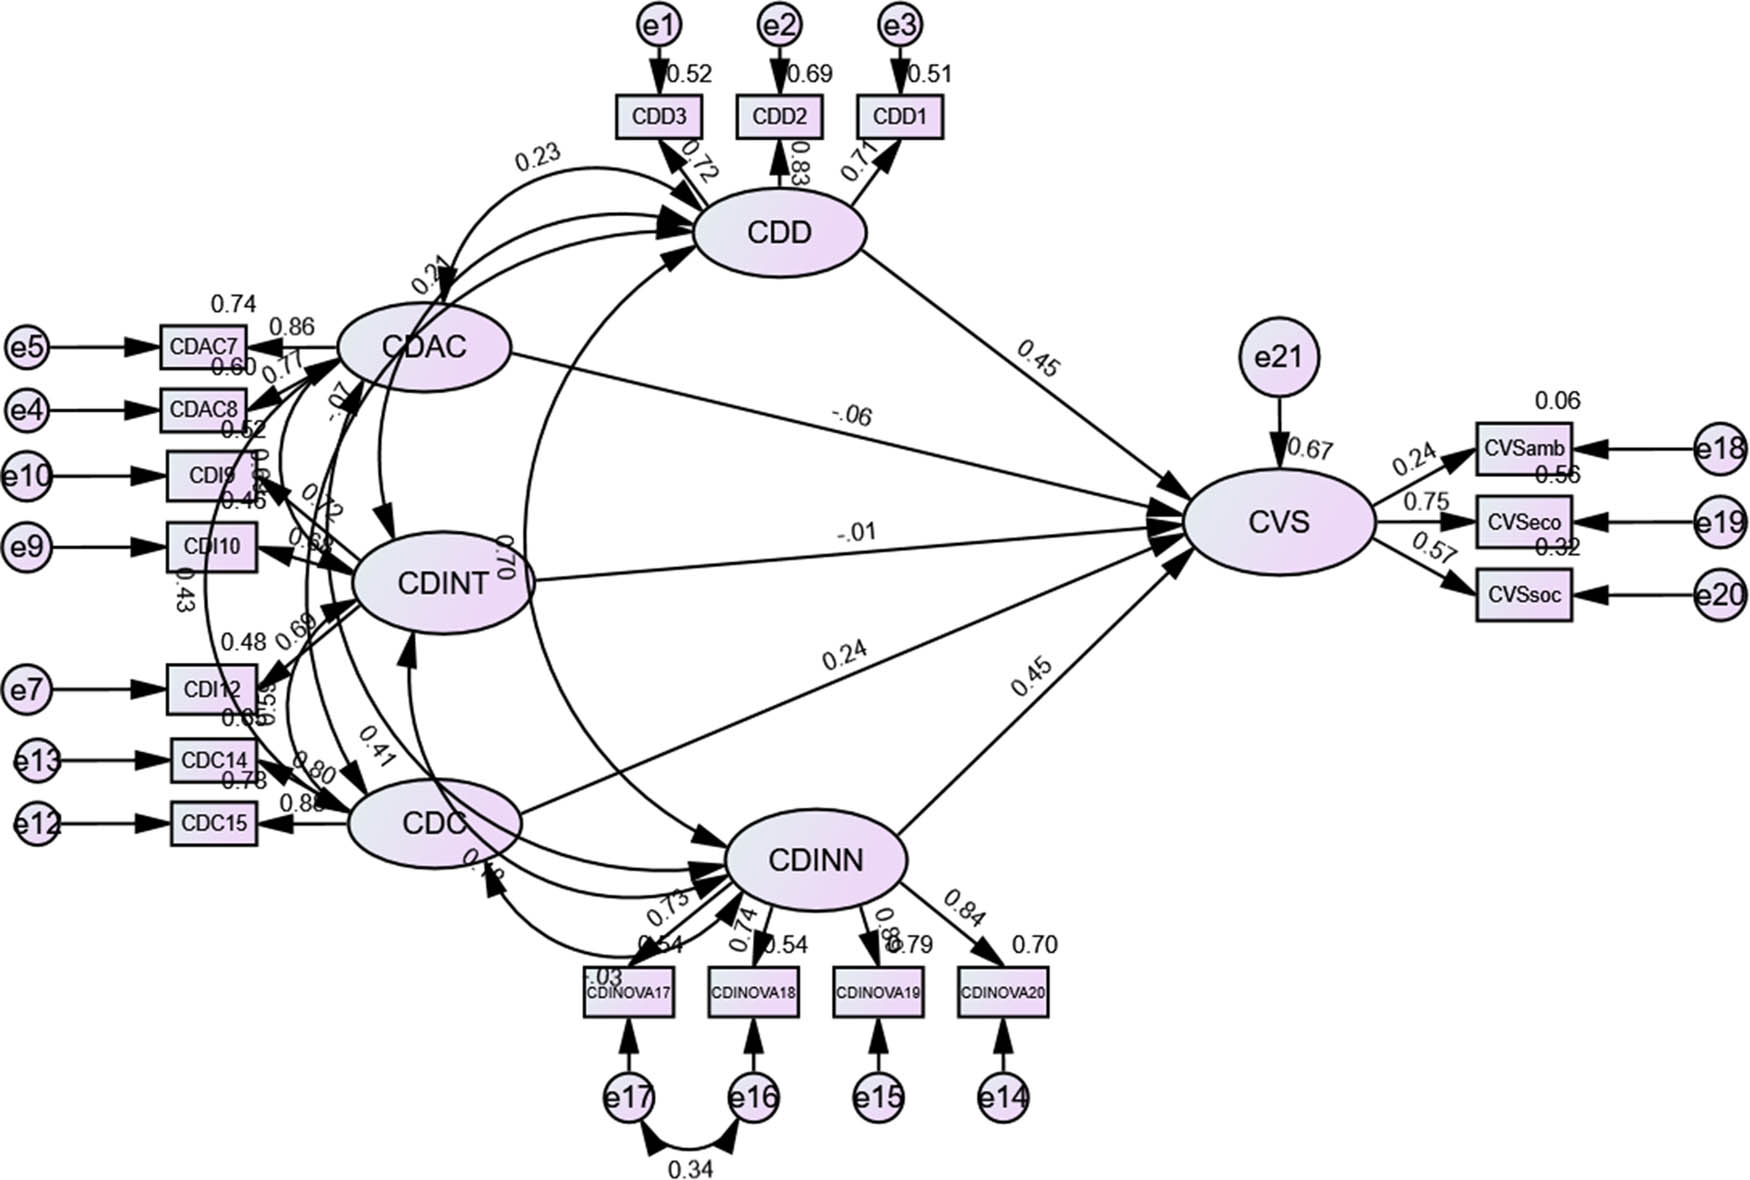
Figure 2
Structural equation model
(Source: Own elaboration based on results from IBM AMOS Version 29)
Table 6
Hypothesis testing
| Hypothesis | Indicator | Acceptance rejection | |
|---|---|---|---|
| H1 | The dynamic capability of sensing has a positive effect on SVC. | 0.024 | Accepted |
| H2 | The dynamic capability of absorption has a positive effect on SVC. | 0.716 | Rejected |
| H3 | The dynamic capability of coordination has a positive effect on SVC. | 0.960 | Rejected |
| H4 | The dynamic capability of integration has a positive effect on SVC. | 0.072 | Accepted |
| H5 | The dynamic capability of innovation has a positive effect on SVC. | 0.027 | Accepted |
(Source: Own elaboration based on the results from IBM SPSS AMOS Version 29)