

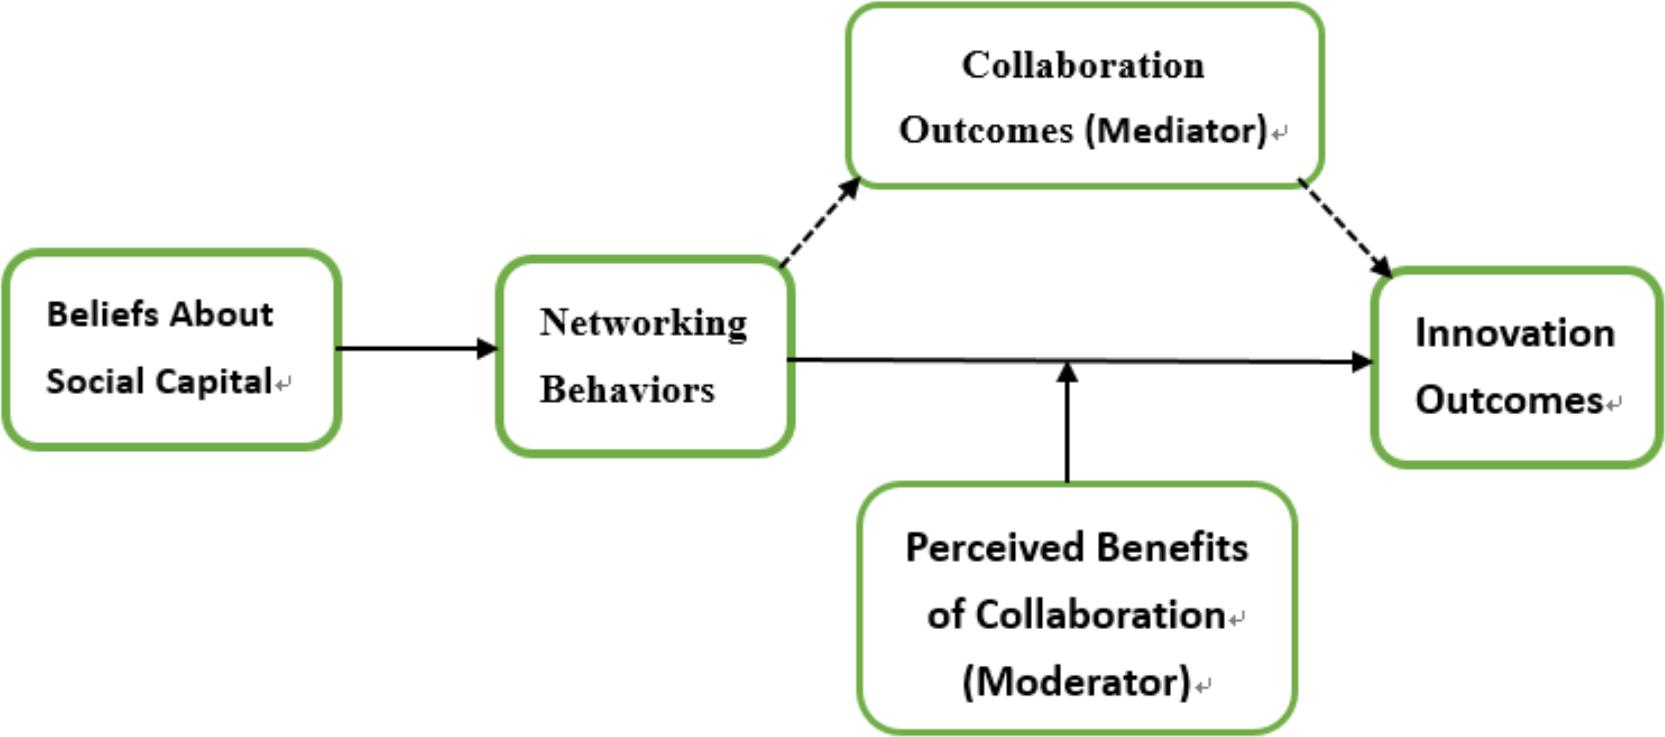
Figure 1.
Reliability and Validity Analysis (Source: Author’s own research)
| Variable | Factor | Cronbach's Alpha | AVE | CR |
|---|---|---|---|---|
| Social Capital (SC) | Fixed Beliefs | 0.885 | 0.555 | 0.833 |
| Malleable Beliefs | 0.888 | 0.556 | 0.835 | |
| Networking Behaviors (NB) | Proactive Networking | 0.856 | 0.582 | 0.839 |
| Sustaining Relationships | 0.830 | 0.635 | 0.878 | |
| Collaboration Outcomes (CO) | Resource Sharing | 0.862 | 0.623 | 0.868 |
| Joint Problem Solving | 0.830 | 0.621 | 0.831 | |
| Innovation Outcomes (IO) | Process Innovation | 0.822 | 0.607 | 0.822 |
| Product Innovation | 0.837 | 0.623 | 0.868 | |
| Benefits of Collaboration (BC) | Perceived Collaboration Benefits | 0.856 | 0.582 | 0.839 |
Demographic Profile of Sample (Source: Author’s own research)
| Category | Subcategory | Frequency | Percent (%) |
|---|---|---|---|
| Age | 18–25 | 35 | 12.50% |
| 26–35 | 58 | 20.50% | |
| 36–45 | 68 | 24.00% | |
| 46–55 | 55 | 19.50% | |
| 56–65 | 39 | 14.00% | |
| 66 and above | 27 | 9.50% | |
| Role | Farmer | 86 | 30.50% |
| Supplier | 71 | 25.00% | |
| Distributor | 44 | 15.50% | |
| Retailer | 30 | 10.50% | |
| Industry expert | 28 | 10.00% | |
| Other | 24 | 8.50% | |
| Years of experience | Less than 5 years | 44 | 15.50% |
| 5–10 years | 62 | 22.00% | |
| 11–15 years | 75 | 26.50% | |
| 16–20 years | 56 | 20.00% | |
| More than 20 years | 45 | 16.00% | |
| Company size | Small (1–49) | 109 | 38.50% |
| Medium (50–249) | 115 | 41.00% | |
| Large (250 or more) | 58 | 20.50% | |
| Geographical location | Northern Taiwan | 83 | 29.50% |
| Central Taiwan | 71 | 25.00% | |
| Southern Taiwan | 85 | 30.00% | |
| Eastern Taiwan | 28 | 10.00% | |
| Other | 15 | 5.50% |
Discriminant Analysis (Source: Author’s own research)
| Variable | SC | NB | CO | IO | BC |
|---|---|---|---|---|---|
| SC (Social Capital) | 0.745 | - | - | - | - |
| NB (Networking Behaviors) | 0.467** | 0.797 | - | - | - |
| CO (Collaboration Outcomes) | 0.426** | 0.372** | 0.779 | - | - |
| IO (Innovation Outcomes) | 0.444** | 0.365** | 0.411** | 0.801 | - |
| BC (Benefits of Collaboration) | 0.458** | 0.389** | 0.428** | 0.391** | 0.779 |
Summary for moderation analysis (Source: Author’s own research)
| Predictor | Dependent variable | β | t | p-value |
|---|---|---|---|---|
| Proactive Networking (NB) | Innovation Outcomes (IO) | 0.324 | 4.587 | <0.001 |
| Perceived Benefits (BC) | Innovation Outcomes (IO) | 0.124 | 2.115 | <0.05 |
Summary for mediation analysis (Source: Author’s own research)
| Relationship | Direct Effect | Indirect Effect | Total Effect | Sobel Test (Z) | p-value |
|---|---|---|---|---|---|
| Proactive Networking → Innovation | 0.210 | 0.160 | 0.370 | 2.998 | 0.002 |
Summary for regression analysis and hypotheses testing (Source: Author’s own research)
| Hypothesis | Relationship | β | t | p-value | Result |
|---|---|---|---|---|---|
| H1: Malleable beliefs about social capital → Proactive networking behaviors | Malleable Beliefs (SC) → Proactive Networking (NB) | 0.451 | 6.745 | <0.001 | Supported |
| H2: Proactive networking behaviors → Collaboration | Proactive Networking (NB) → Collaboration (CO) | 0.372 | 5.823 | <0.001 | Supported |
| H3: Collaboration → Innovation Outcomes | Collaboration (CO) → Innovation Outcomes (IO) | 0.411 | 6.231 | <0.001 | Supported |
| H4: Malleable beliefs about social capital → Innovation Outcomes | Malleable Beliefs (SC) → Innovation Outcomes (IO) | 0.386 | 5.892 | <0.001 | Supported |