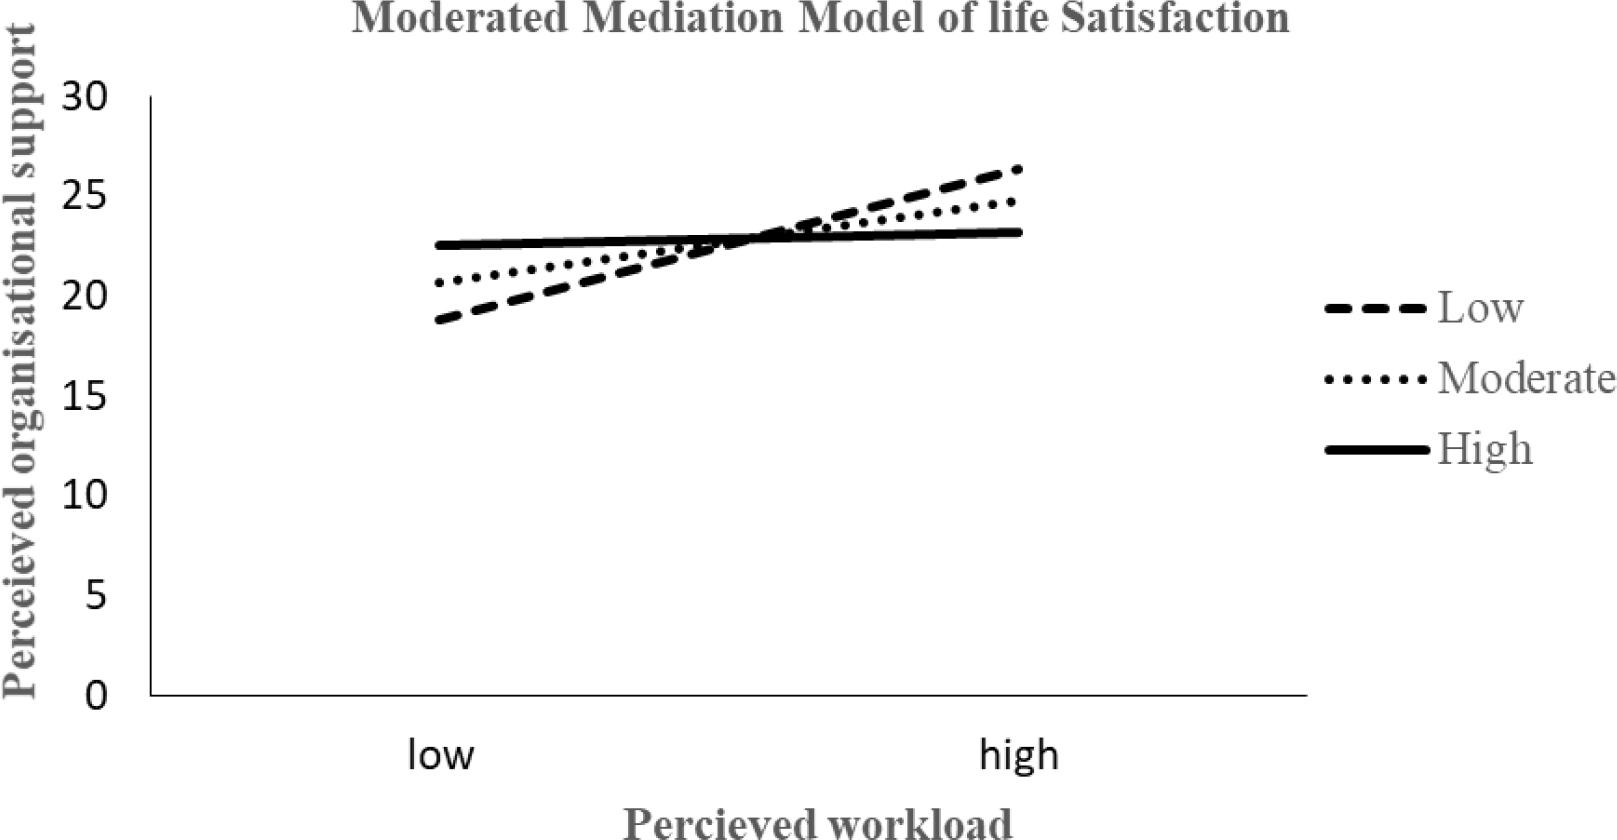
Figure 1.

Multiple regression analysis of life satisfaction by perceived workload dimensions and organizational support (Source: Authors’ own research)
| Predictor variables | Standardised coefficients | t | P-value | 95.0% Confidence interval (CI) | |
|---|---|---|---|---|---|
| β | Lower bound | Upper bound | |||
| Mental demand | -0.50 | -10.35 | 0.01 | 1.07 | 1.58 |
| Physical demand | -0.04 | -0.90 | 0.36 | -0.36 | 0.13 |
| Temporal demand | -0.04 | -0.82 | 0.41 | -0.29 | 0.12 |
| Perceived risk | 0.08 | 1.89 | 0.05 | 0.07 | 0.35 |
| Frustration level | -0.17 | -4.55 | 0.01 | 0.25 | 0.65 |
| Performance | 0.04 | 1.16 | 0.24 | 0.07 | 0.28 |
| Organizational support | 0.25 | 6.41 | 0.01 | 0.14 | 0.27 |
| R = 0.72, R2 = 0.53, F(7,376) = 60.64 | |||||
Participants’ characteristics (Source: Authors’ own research)
| Characteristics | Category | Frequency |
|---|---|---|
| Sex | Male | 195 |
| Marital status | Married | 273 |
| Religious affiliation | Christian | 260 |
| Number of children | One to three | 299 |
| Ethnicity | Hausa | 18 |
| Educational qualification | Primary/secondary | 138 |
Mediating effect of organizational support in the perceived workload and life satisfaction link (Source: Authors’ own research)
| Model pathways | β | SE | P-value | BC 95% CI | - |
|---|---|---|---|---|---|
| - | - | - | - | Lower limit | Upper limit |
| - | - | - | - | - | - |
| PW → OS→ LS | -0.05 | 0.01 | <0.05 | 0.05 | 0.14 |
Reliability coefficient for scales in the validation study (Source: Authors’ own research)
| Scales | Number of Items | Cronbach’s alpha | Correlation between forms | Spearman-Brown coefficient | Guttman split-half coefficient |
|---|---|---|---|---|---|
| Life Satisfaction Scale (SWLS) | 5 | 0.70 | 0.15 | 0.26 | 0.21 |
| Police Perceived Workload scale | 12 | 0.67 | 0.54 | 0.70 | 0.70 |
| Perceived Organizational Support | 8 | 0.53 | 0.22 | 0.36 | 0.36 |
Moderated mediation of life satisfaction among police officers, tested using PROCESS Macro Vs 4_2 for IBM-SPSS version 25 (Source: Authors’ own research)
| Models | β | SE | t | P-value | BC 95% CI | - |
|---|---|---|---|---|---|---|
| MV model | - | - | - | - | Lower limit | Upper limit |
| Constants | -2.28 | 2.76 | -0.86 | 0.389 | -7.82 | 3.05 |
| PW | 0.68 | 0.09 | -7.44 | 0.001 | 0.50 | 0.86 |
| DO | 1.89 | 0.32 | 5.83 | 0.001 | 1.25 | 2.52 |
| PW × DO | -0.05 | 0.00 | -5.74 | 0.001 | -0.06 | -0.03 |
| - | - | F (3, 360) = 36.75 R = 47, R2 = 0.22 | - | - | - | - |
| Dependent model | - | - | - | - | - | - |
| Constant | -3.96 | 1.88 | -2.10 | 0.036 | -7.66 | -0.26 |
| PW | 0.33 | 0.06 | 5.03 | 0.001 | 0.20 | 0.46 |
| OS | 0.16 | 0.03 | 4.76 | 0.001 | 0.09 | 0.23 |
| DO | 0.85 | 0.23 | 3.71 | 0.001 | -0.40 | 1.23 |
| PW × DO | -0.01 | 0.06 | -2.43 | 0.016 | -0.02 | -0.00 |
| - | - | F (4, 379) =36.75 R = 68, R2 = 0.46 | - | - | - | - |
| Moderated mediation effect | β | SE | - | - | Lower limit | Upper limit |
| Low | 0.06 | 0.01 | - | - | 0.03 | 0.26 |
| High | 0.00 | 0.01 | - | - | 0.01 | 0.02 |
| Index of moderated mediation | -0.08 | 0.02 | - | - | 0.01 | -0.00 |
