

Table 1.
Exploratory factor analysis on the measurement of EM
(Source: IBM SPSS version 27)
| Item | Mean | SD | Factor loading | Item total correlation |
|---|---|---|---|---|
| EM Factor 1 | ||||
| Innovativeness | 3.57 | 0.953 | 0.725 | 0.642 |
| Alliance | 3.21 | 0.719 | 0.711 | 0.648 |
| Proactiveness | 4.72 | 0.831 | 0.693 | 0.572 |
| Resources leveraging | 3.10 | 1.041 | 0.661 | 0.458 |
| Value creation | 3.78 | 1.237 | 0.604 | 0.695 |
| Calculated risk-taking | 4.66 | 1.630 | 0.598 | 0.519 |
| Customer intensity | 5.95 | 2.014 | 0.572 | 0.418 |
| Market sensing | 4.18 | 1.212 | 0.551 | 0.506 |
Table 2.
Selected AMOS text output on standardised regression weights
(Source: IBM AMOS version 27)
| Estimate | |||
|---|---|---|---|
| SEs | <--- | Innovativeness | 0.882 |
| SEs | <--- | Proactiveness | 0.924 |
| SEs | <--- | Calculated risk-taking | 0.812 |
| SEs | <--- | Resources leveraging | 0.781 |
| SEs | <--- | Customer intensity | 0.490 |
| SEs | <--- | Value creation | 0.830 |
| SEs | <--- | Alliance | 0.631 |
| SEs | ---> | Market sensing | 0.343 |
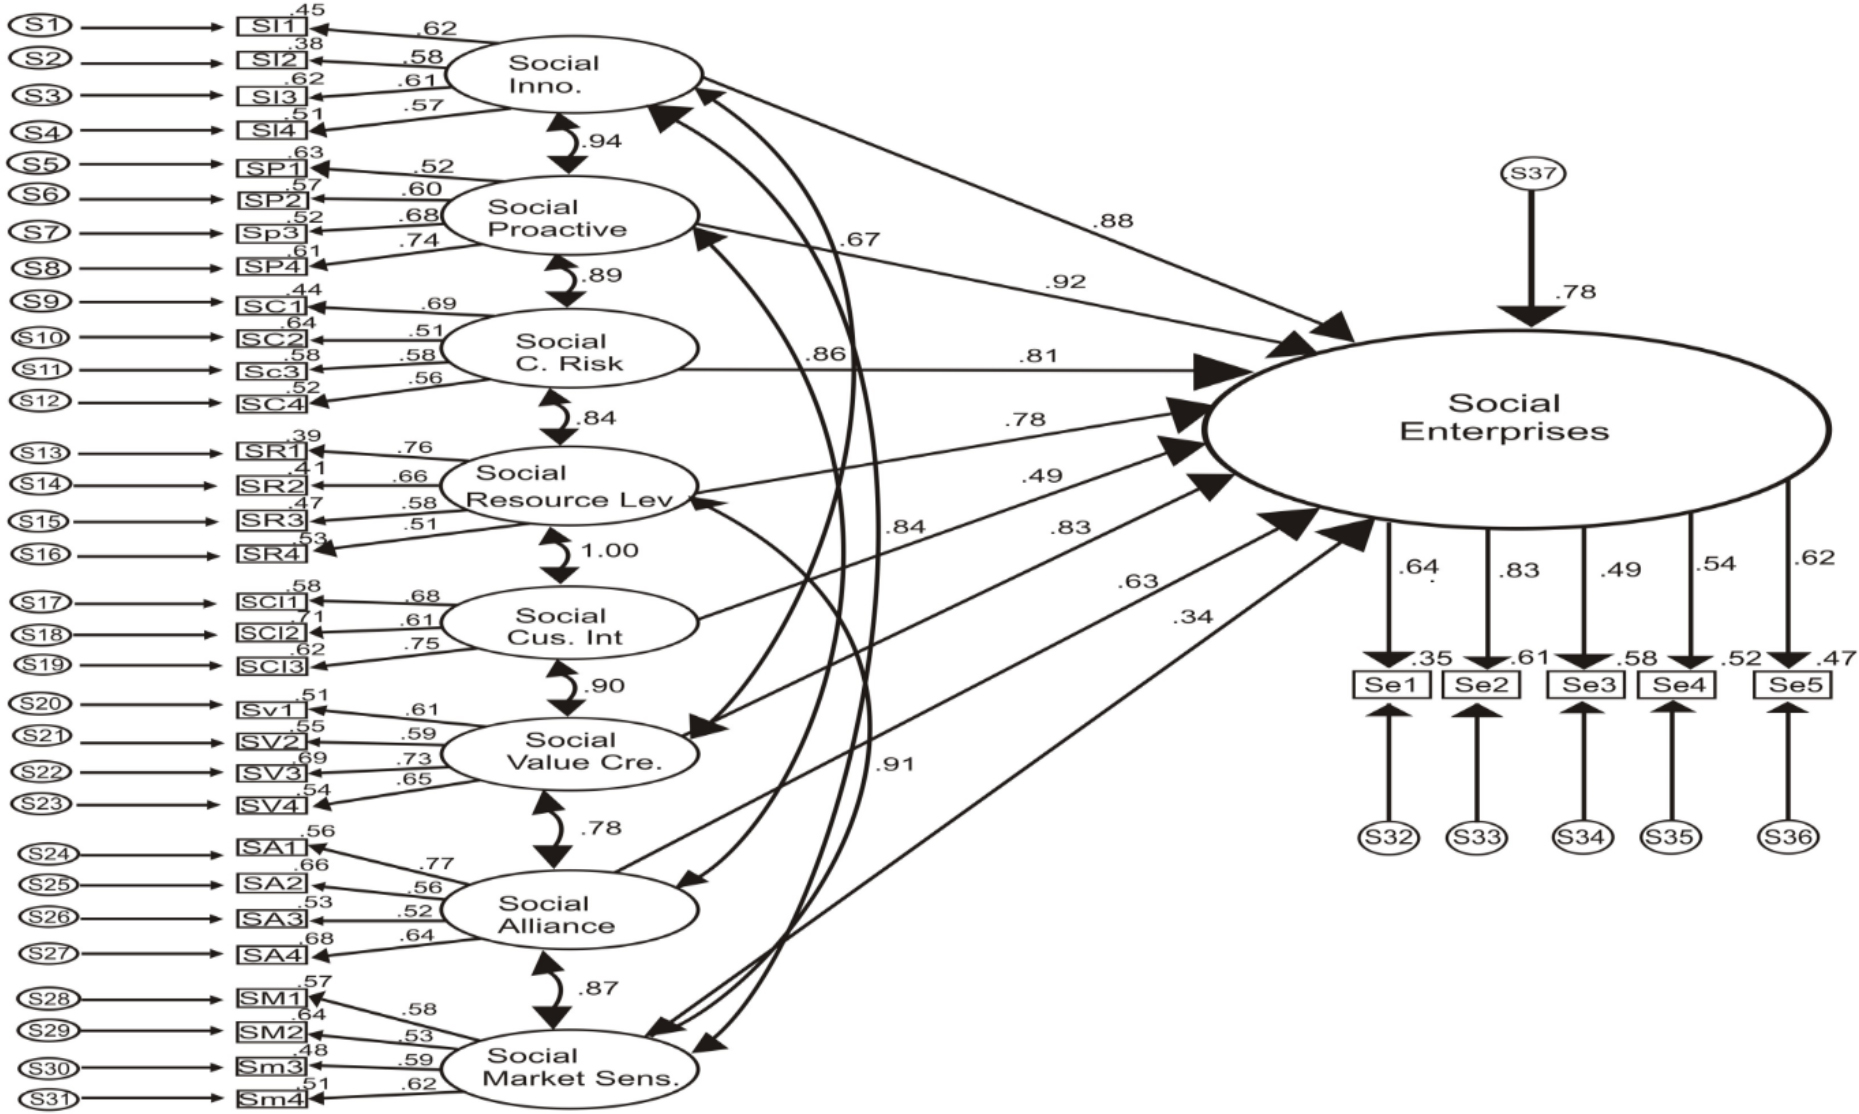
Figure 1.
Structural model illustrating the effects of entrepreneurial marketing (EM) on survival of social enterprises (SEs) in Nigeria
(Source: IBM AMOS version 27)
Note: CMIN/DF = 1.719, GFI = 0.887, AGFI = 0.935, NFI = 0.917, IFI = 0.922, Tucker–Lewis index (TLI)= 0.915, CFI = 0.931, RMSEA = 0.049, chi-square = 538.321, DF = 143, P = 0.000