

Figure 1
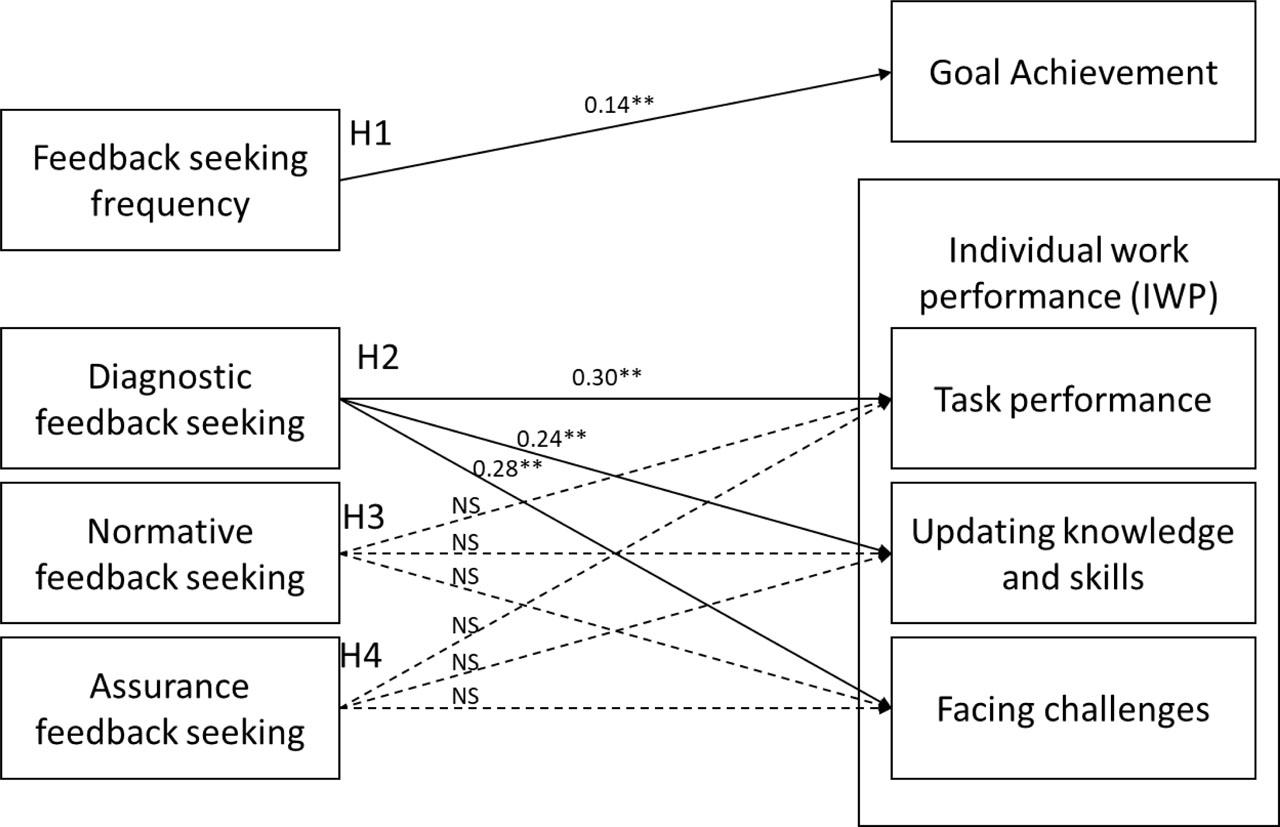
Hierarchical regression models for individual work performance (Source: Authors’ own research)
| Task performance | Updating knowledge and skills | Facing challenges | |||||||||||||
|---|---|---|---|---|---|---|---|---|---|---|---|---|---|---|---|
| M1 | M2 | M3 | M4 | M5 | M1 | M2 | M3 | M4 | M5 | M1 | M2 | M3 | M4 | M5 | |
| Age | −0.06 | −0.06 | −0.06 | −0.06 | −0.06 | 0.05 | 0.05 | 0.04 | 0.04 | 0.04 | −0.16 | −0.17 | −0.16 | −0.16 | −0.17 |
| Gender | 0.02 | 0.03 | 0.02 | 0.02 | 0.02 | 0.12 * | 0.12 * | 0.13 * | 0.13 * | 0.13 * | −0.01 | −0.01 | −0.01 | −0.02 | −0.03 |
| Education-dummy 1 | −0.17 * | −0.16 * | −0.14 * | −0.13 * | −0.13 * | 0.13 | 0.12 | 0.10 | 0.10 | 0.10 | −0.01 | 0.00 | 0.02 | 0.02 | 0.02 |
| Education-dummy 2 | 0.08 | 0.07 | 0.09 | 0.09 | 0.09 | −0.09 | −0.09 | −0.10 | −0.10 | −0.10 | 0.06 | 0.06 | 0.07 | 0.07 | 0.07 |
| Experience | −0.05 | −0.04 | −0.04 | −0.04 | −0.04 | −0.08 | −0.09 | −0.08 | −0.08 | −0.07 | 0.05 | 0.07 | 0.06 | 0.05 | 0.07 |
| Organizational experience | 0.11 | 0.11 | 0.14 | 0.13 | 0.13 | 0.12 | 0.12 | 0.10 | 0.10 | 0.10 | 0.01 | 0.02 | 0.04 | 0.05 | 0.06 |
| Salary | −0.06 | −0.06 | −0.05 | −0.05 | −0.05 | 0.01 | 0.01 | 0.00 | 0.00 | 0.00 | 0.09 | 0.09 | 0.10 | 0.10 | 0.07 |
| Department-research | −0.15 * | −0.15 * | −0.16 * | −0.16 * | −0.16 * | 0.03 | 0.03 | 0.04 | 0.05 | 0.05 | 0.03 | 0.03 | 0.02 | 0.02 | 0.02 |
| Department-staff | −0.04 | −0.04 | −0.03 | −0.03 | −0.03 | 0.10 | 0.10 | 0.09 | 0.09 | 0.09 | −0.09 | −0.09 | −0.08 | −0.08 | −0.07 |
| Feedback seeking frequency | - | 0.07 | 0.03 | 0.03 | 0.03 | - | −0.05 | −0.02 | −0.02 | −0.02 | - | 0.09 | 0.05 | 0.05 | 0.04 |
| Diagnostic | - | - | 0.30 ** | 0.29 ** | 0.29 ** | - | - | −0.24 ** | −0.25 ** | −0.25 ** | - | - | 0.28 ** | 0.31 ** | 0.33 ** |
| Normative | - | - | - | 0.03 | 0.02 | - | - | - | 0.02 | 0.02 | - | - | - | −0.06 | −0.02 |
| Assurance | - | - | - | - | 0.01 | - | - | - | - | −0.01 | - | - | - | - | −0.11 |
| R 2 | 0.10 | 0.11 | 0.19 | 0.19 | 0.19 | 0.06 | 0.07 | 0.12 | 0.12 | 0.12 | 0.03 | 0.04 | 0.11 | 0.12 | 0.13 |
| ΔR 2 | 0.10 ** | 0.00 | 0.09 ** | 0.00 | 0.00 | 0.06 * | 0.00 | 0.06 ** | 0.00 | 0.00 | 0.03 | 0.01 | 0.07 ** | 0.00 | 0.01 |
Items of feedback seeking frequency scale (source: Ashford and Black, 1996)
| To what extent have you sought out feedback on your performance during assignments? |
| To what extent have you sought feedback on your performance after assignments? |
| To what extent have you asked for your boss's opinion of your work? |
| To what extent have you solicited critiques from your boss? |
Items of individual work performance scale (source: Koopmans, et al_, 2014)
| Task performance 1 a | I managed to plan my work so that it was done on time |
| Task performance 2 | My planning was optimal |
| Task performance 3 | I was able to perform my work well with minimal time and effort |
| Task performance 4 | I started new tasks myself, when my old ones were finished |
| Task performance 5 | I was able to separate main issues from side issues at work |
| Updating knowledge and skills 1 | I worked at keeping my job skills up-to-date |
| Updating knowledge and skills 2 | I worked at keeping my job knowledge up-to-date |
| Updating knowledge and skills 3 | I came up with creative solutions to new problems |
| Facing challenges 1 | I took on challenging work tasks, when available |
| Facing challenges 2 | I kept looking for new challenges in my job |
List of abbreviations (source: own study)
| FSB | Feedback seeking behavior |
| IWP | Individual work performance |
| VIF | Variance inflation factor |
| MAP | Minimum average partial |
| df | Degree of freedom |
| GFI | Goodness of fit |
| AGFI | Adjusted goodness of fit |
| CFI | Comparative fit index |
| RMSEA | Root mean square error of approximation |
| SRMR | Standardized root mean square residual |
Correlation among the study variables (Source: Authors’ own research)
| 1 | 2 | 3 | 4 | 5 | 6 | |
|---|---|---|---|---|---|---|
| 1. FSB frequency | - | - | - | - | - | - |
| 2. Diagnostic FSB | 0.16 ** | - | - | - | - | - |
| 3. Normative FSB | 0.09 | 0.51 ** | - | - | - | - |
| 4. Assurance FSB | −0.03 | 0.36 ** | 0.43 ** | - | - | - |
| 5. Task performance | 0.09 | 0.30 ** | 0.22 ** | 0.16 ** | - | - |
| 6. Facing challenges | 0.07 | 0.26 ** | 0.09 | −0.03 | 0.40 ** | - |
| 7. Updating knowledge and skills | −0.07 | −0.26 ** | −0.15 ** | −0.11 | −0.57 ** | −0.52 ** |
Exploratory factor analysis of feedback seeking content (Source: Authors’ own research)
| Which feedback do you seek from your manager? | Factors | ||
|---|---|---|---|
| Item | 1 diagnostic | 2 normative | 3 assurance |
| The feedback that compares me to my job performance criteria | 0.85 | 0.01 | −0.08 |
| The feedback that measures me against the initial goals (first 3 months or first project or …) that we set with my manager | 0.78 | −0.03 | 0.00 |
| Feedback based on the agreement between my manager and me about the necessary actions for progress | 0.78 | −0.01 | −0.05 |
| The feedback that appraises my performance in my tasks | 0.75 | 0.04 | 0.02 |
| Feedback based on my past performance appraisal forms | 0.53 | 0.02 | 0.15 |
| The feedback that compares me to peers in other units | −0.06 | 0.95 | −0.02 |
| The feedback that compares me to other people in my unit | −0.01 | 0.87 | −0.03 |
| The feedback that shows my situation compared to previous successful people in this job | 0.11 | 0.65 | 0.07 |
| The feedback that focuses on my strengths and reveals my weaknesses less, so that I feel better about my performance | 0.01 | −0.02 | 0.86 |
| The feedback that focuses on my strengths rather than my weaknesses | −0.01 | 0.03 | 0.84 |
| Initial eigenvalues | 4.35 | 1.69 | 1.30 |
| Cronbach's α | 0.86 | 0.87 | - |
| Spearman–Brown (for two-item scale) a | - | - | 0.84 |
Hierarchical regression models for goal achievement (Source: Authors’ own research)
| M1 | M2 | M3 | M4 | M5 | |
|---|---|---|---|---|---|
| Age | −0.11 | −0.12 | −0.12 | −0.12 | −0.11 |
| Gender | 0.10 | 0.10 | 0.10 | 0.10 | 0.10 |
| Education-dummy 1 | −0.05 | −0.03 | −0.04 | −0.04 | −0.04 |
| Education-dummy 2 | 0.07 | 0.07 | 0.07 | 0.07 | 0.07 |
| Experience | 0.03 | 0.04 | 0.04 | 0.04 | 0.03 |
| Organizational experience | −0.02 | 0.00 | 0.00 | 0.00 | −0.01 |
| Salary | 0.09 | 0.10 | 0.09 | 0.09 | 0.10 |
| Department-Research | 0.43 ** | 0.43 ** | 0.43 ** | 0.43 ** | 0.43 ** |
| Department-staff | 0.23 ** | 0.22 ** | 0.22 ** | 0.22 ** | 0.22 ** |
| Feedback seeking frequency | - | 0.14 ** | 0.14 ** | 0.14 ** | 0.15 ** |
| Diagnostic | - | - | −0.06 | −0.06 | −0.08 |
| Normative | - | - | - | 0.01 | −0.01 |
| Assurance | - | - | - | - | 0.06 |
| R 2 | 0.28 | 0.29 | 0.30 | 0.30 | 0.30 |
| ΔR 2 | 0.28 ** | 0.02 ** | 0.00 | 0.00 | 0.00 |