

Figure 1
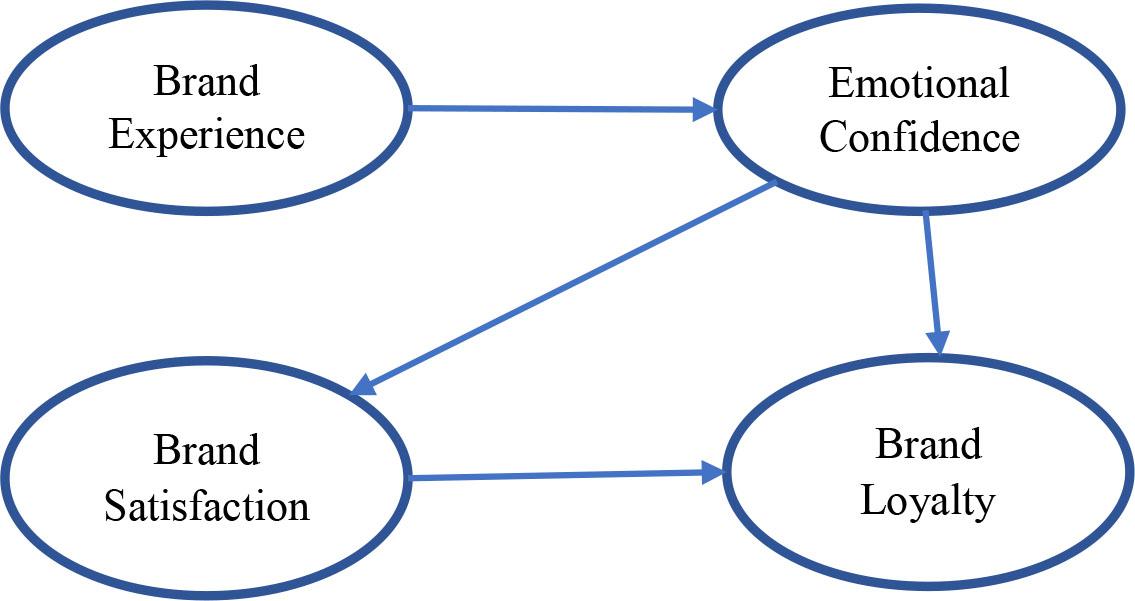
Figure 2
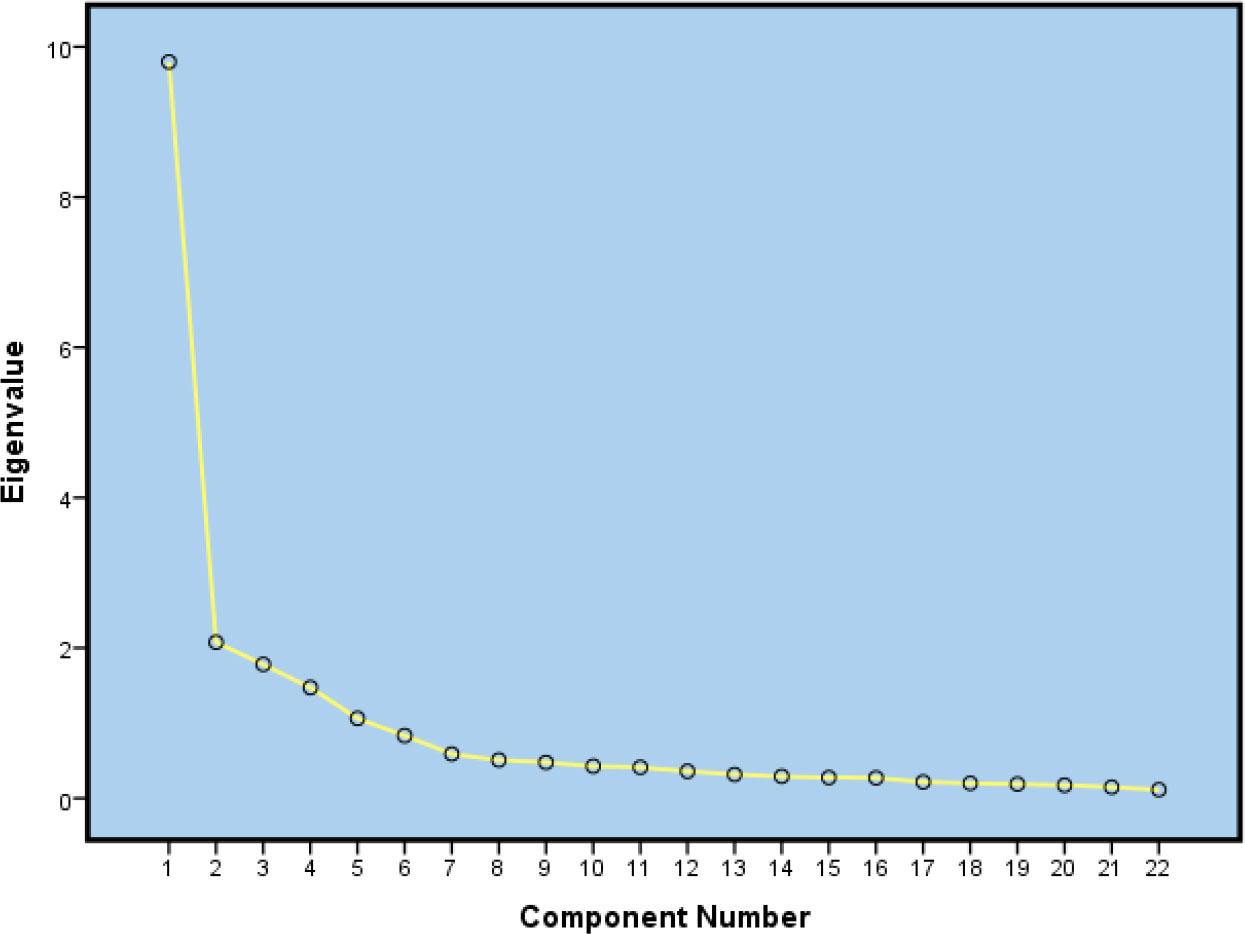
Figure 3
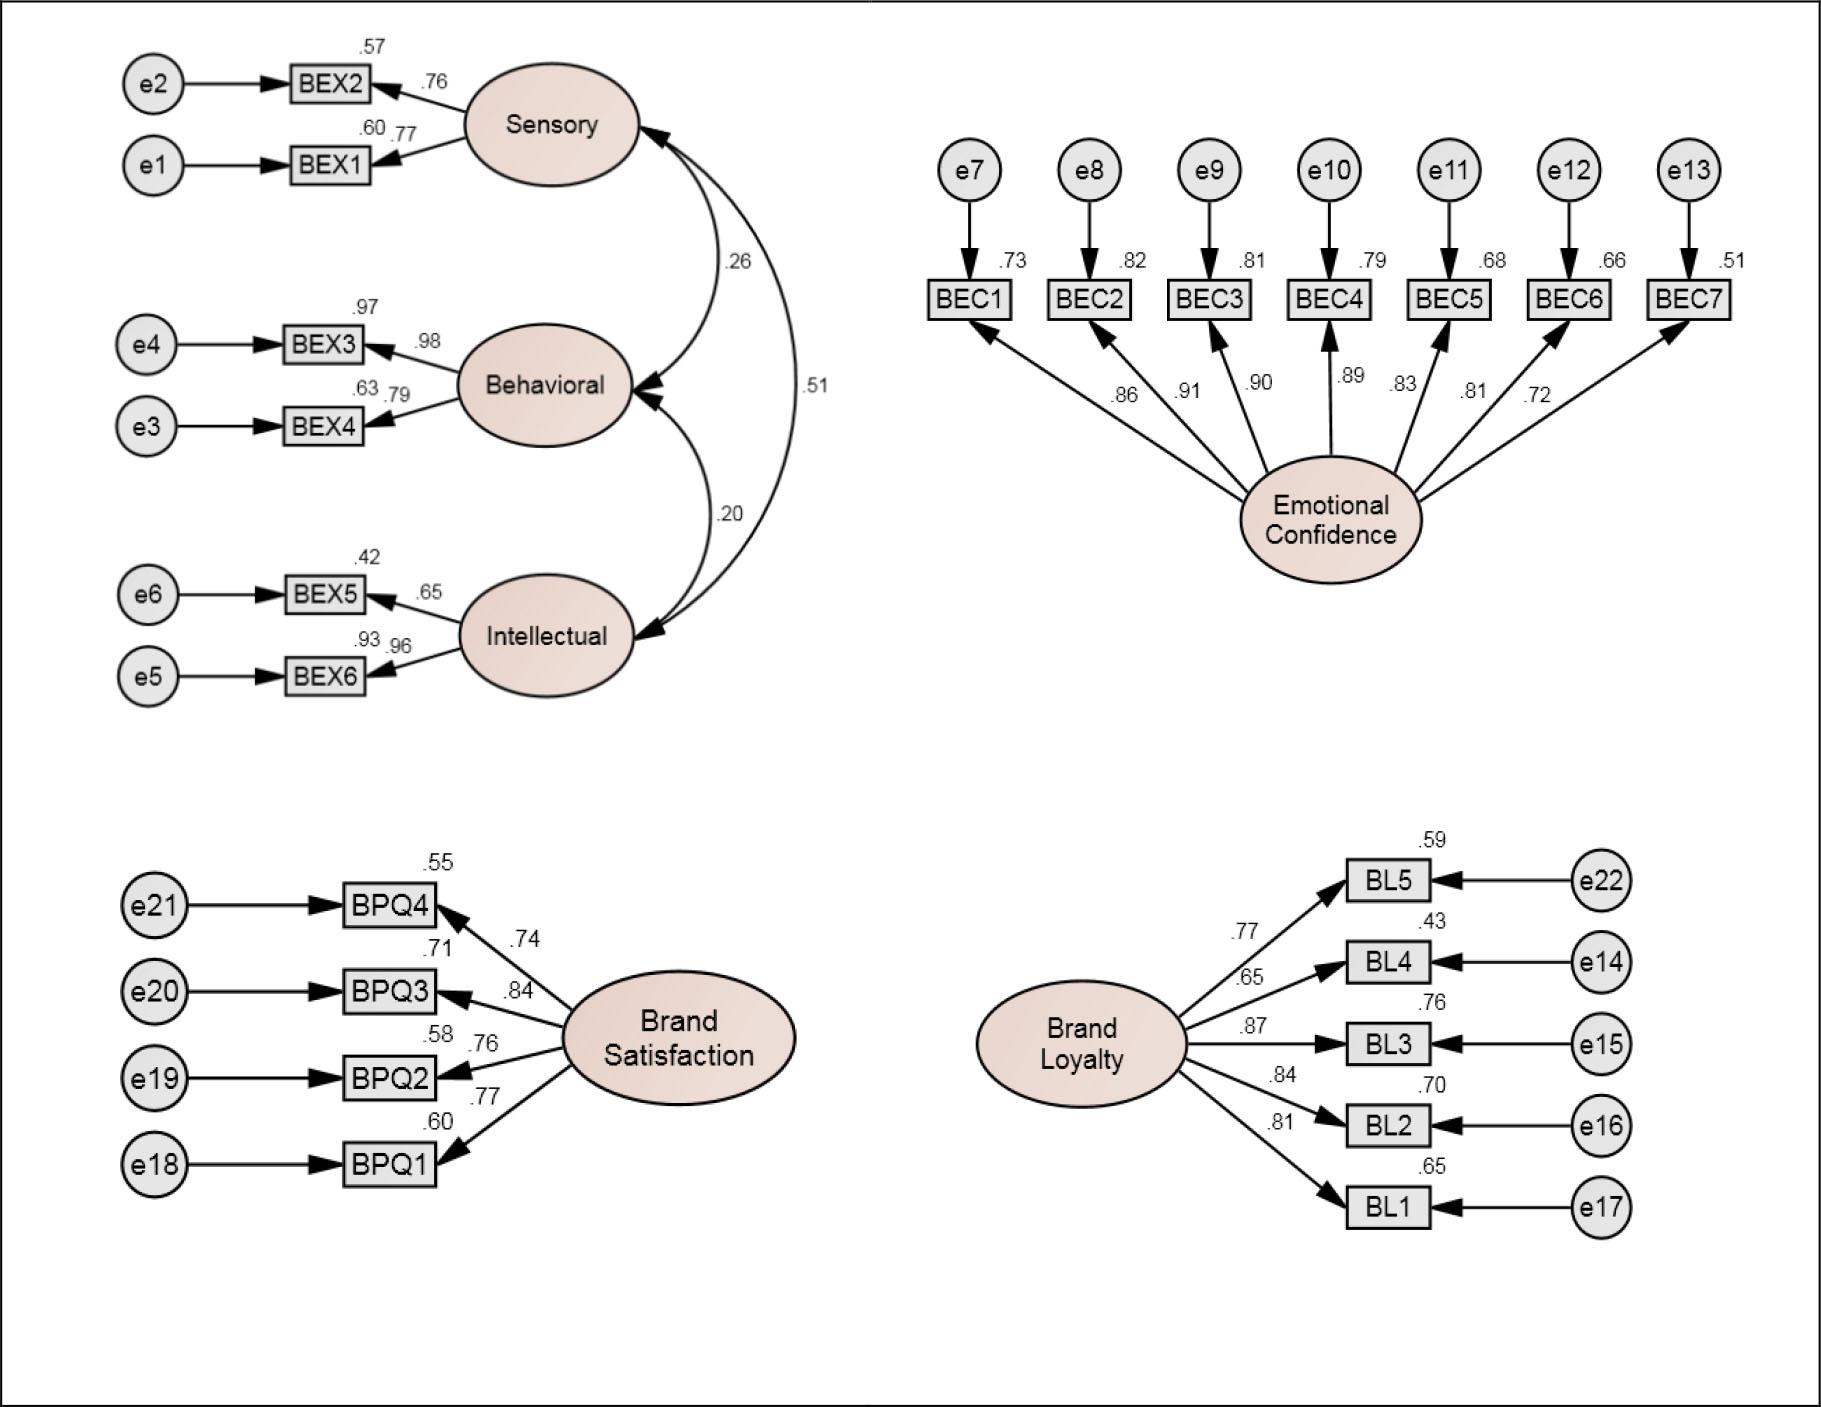
Figure 4
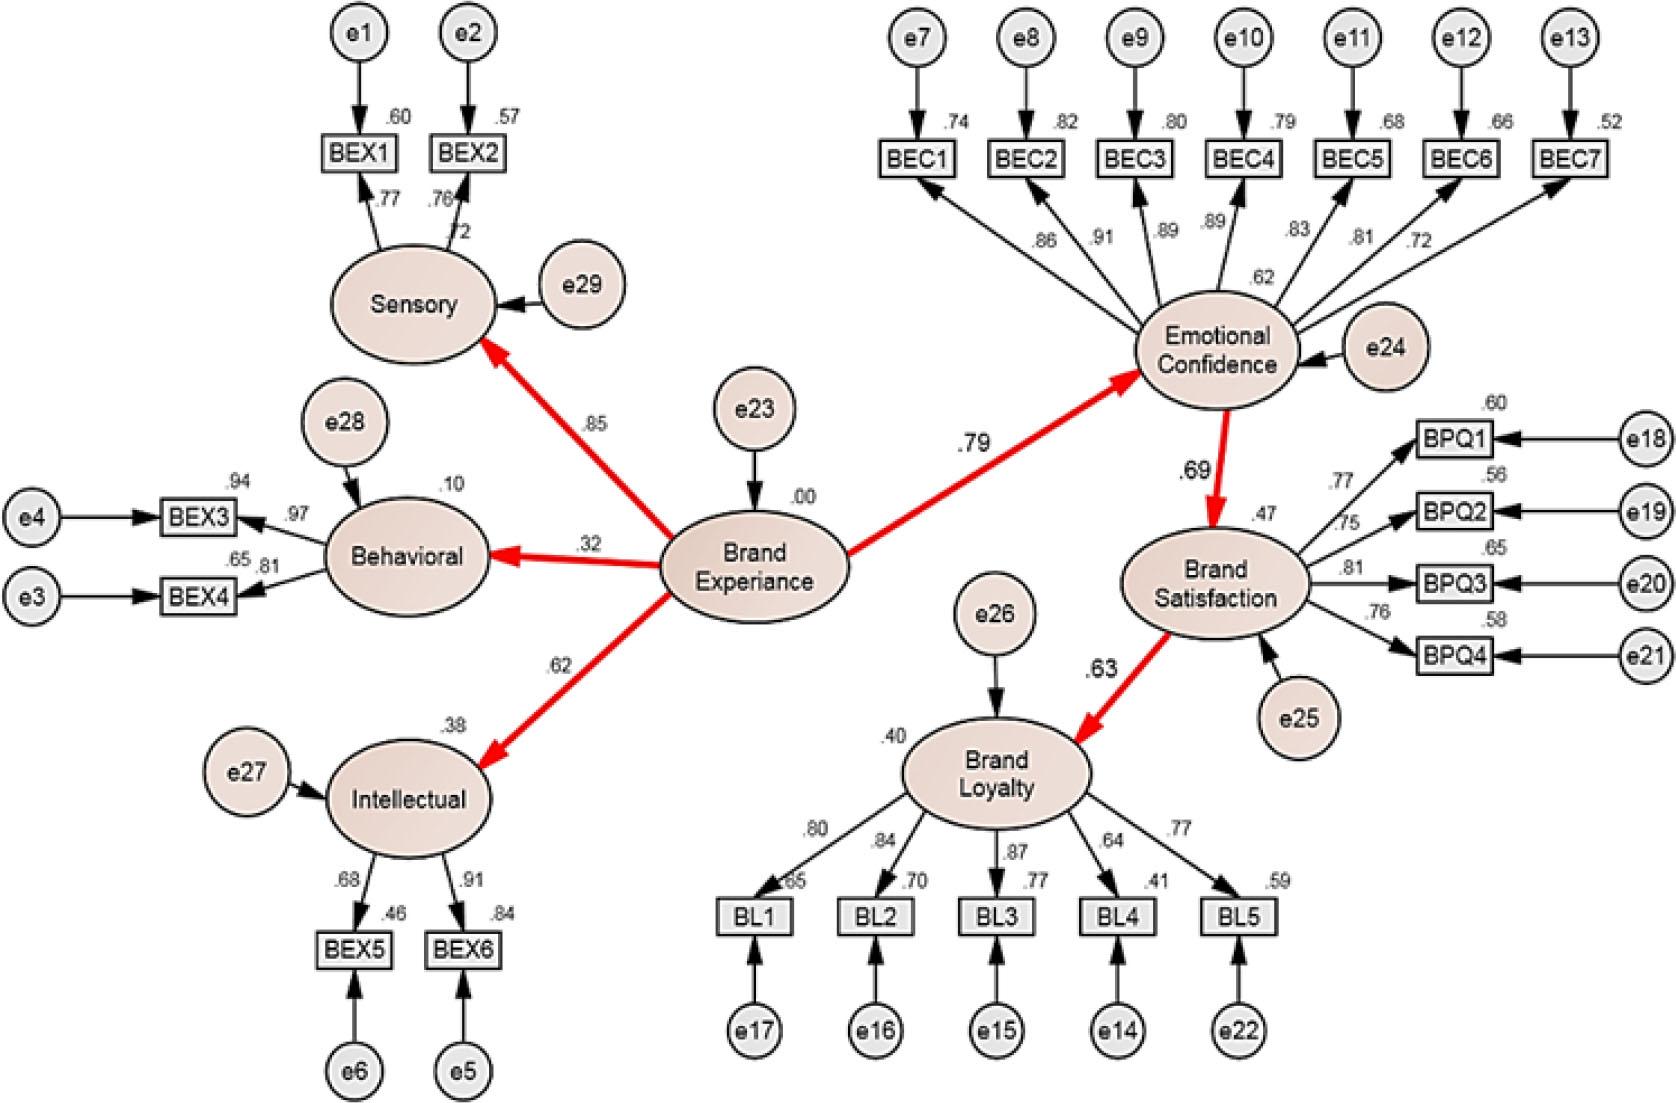
Figure 5
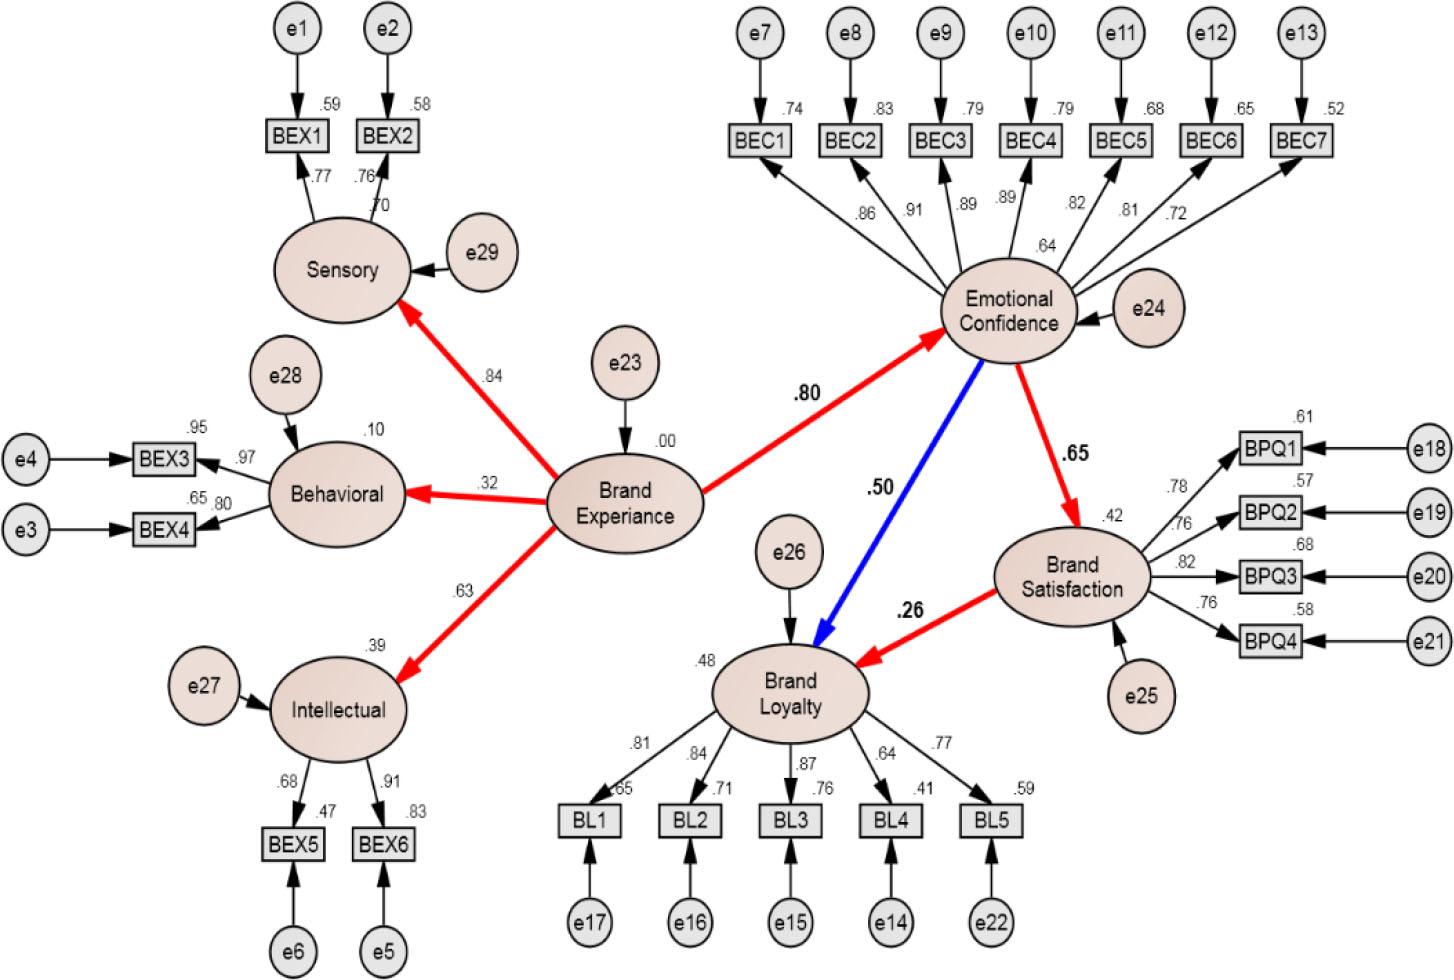
Figure 6
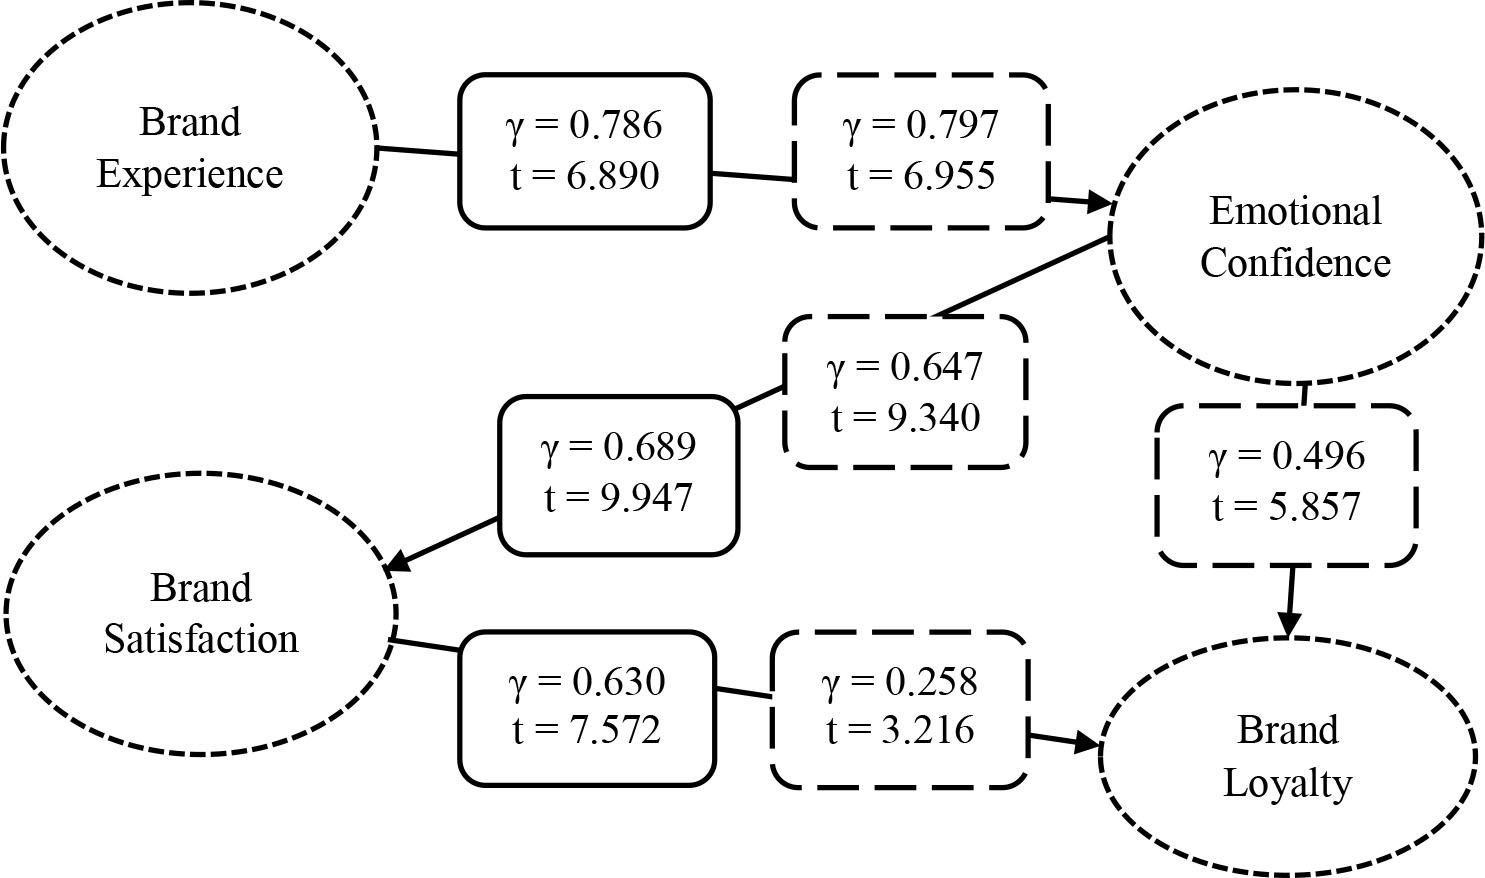
Figure 7
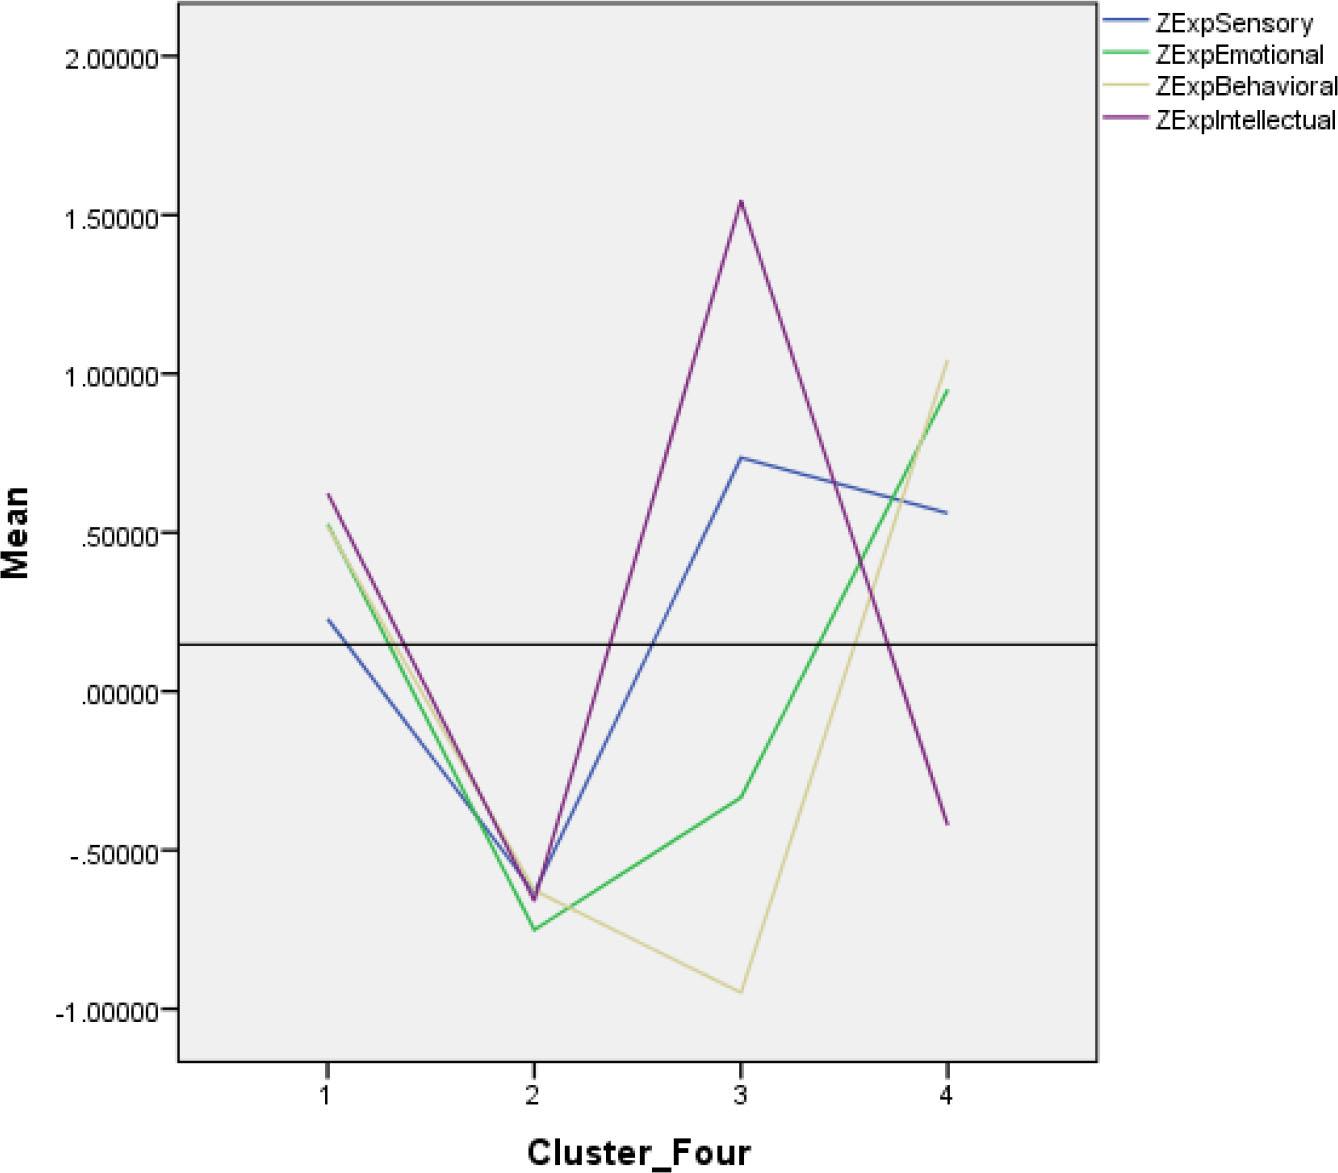
Figure 8
Fit Indices based on Model 2 (Source: Own research)
| χ2 | df | χ2/df | AGFI | RMR | CFI | TLI | NFI | RMSEA |
|---|---|---|---|---|---|---|---|---|
| 560.370 | 202 | 2.77 | 0.786 | 0.186 | 0.907 | 0.894 | 0.863 | 0.084 |
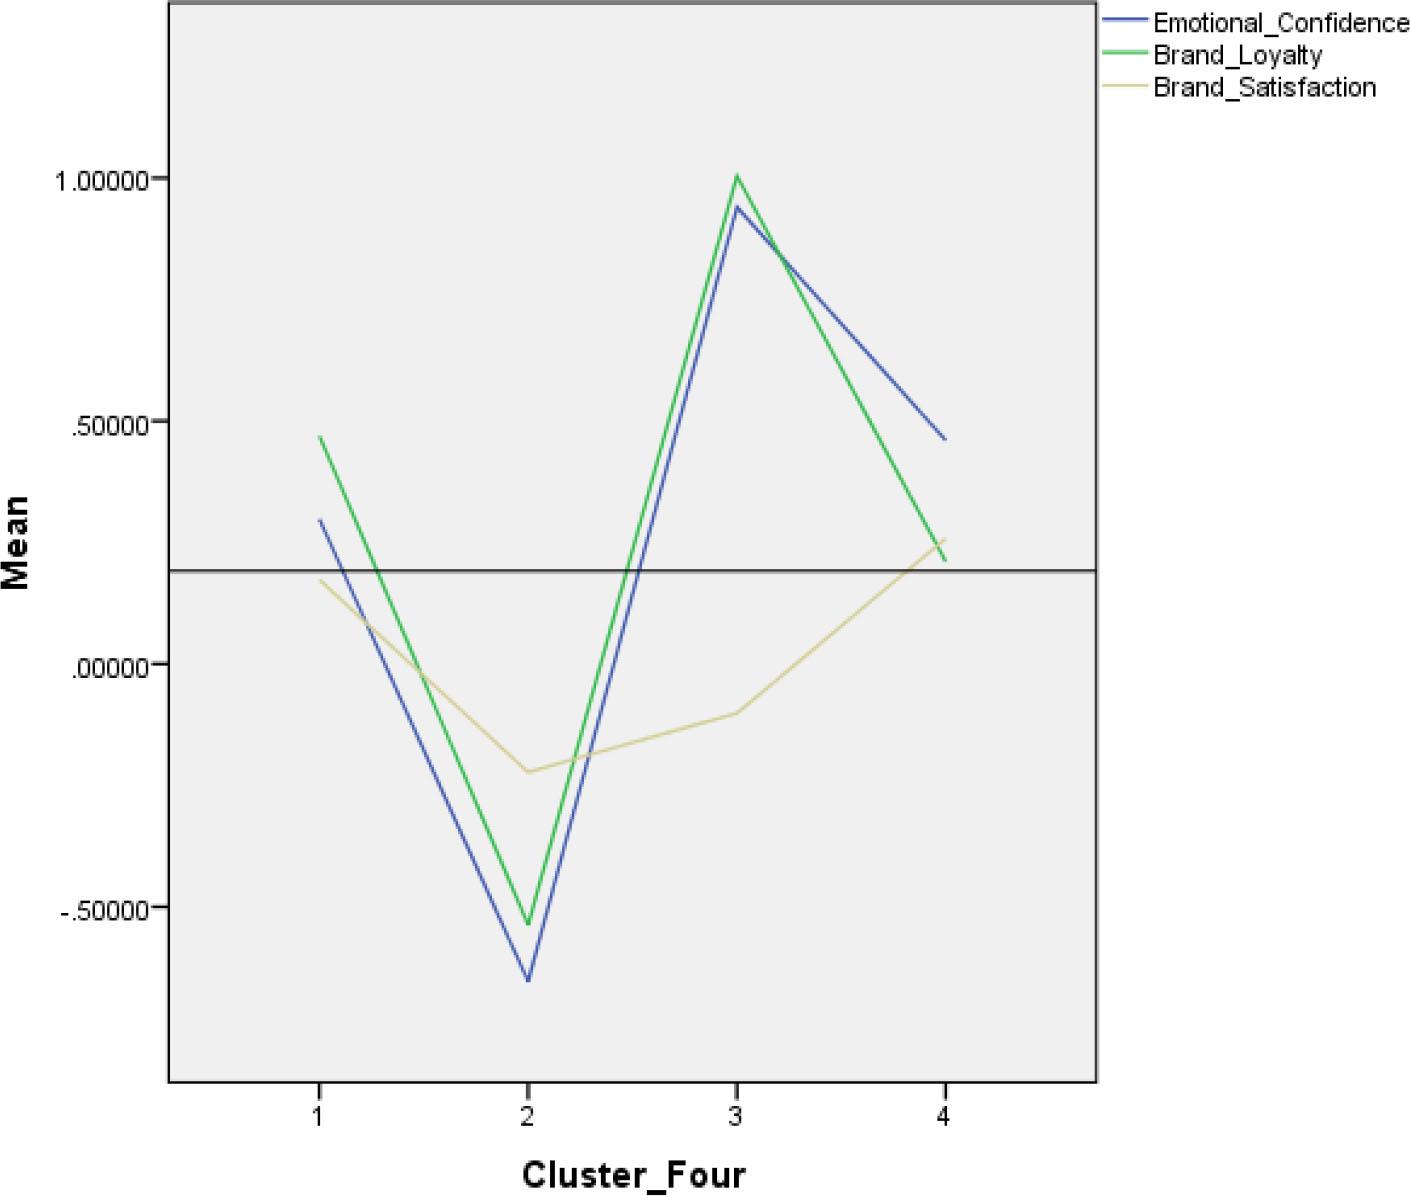
Elicited Clusters based on brand experience dimensions (Source: Own research)
| N | Sensory | Affective | Behavioural | Intellectual | ||
|---|---|---|---|---|---|---|
| 1 | 70 | 10.58 | 9.47 | 9.51 | 10.84 | |
| 2 | 97 | 8.57 | 6.65 | 5.98 | 7.19 | |
| 3 | 26 | 11.76 | 7.57 | 5.00 | 13.46 | |
| 4 | 47 | 11.36 | 10.40 | 11.12 | 7.87 | |
| Total | 240 | 10.05 | 8.31 | 7.91 | 9.07 |
Demographic Profile (Source: Own research)
| Age | Percent | Marital Status | Percent | Family Income (PKR) | Percent | Driving Toyota Experience | Percent |
|---|---|---|---|---|---|---|---|
| Under 16 | 2 (0.8) | Married | (156) 62.4 | Under 25,000 | 18 (7.2) | 0 | 16 (6.4) |
| 17–25 | 66 (26.4) | Single | (94) 37.6 | 25,001 – 50,000 | 22 (8.8) | 1 – 3 | 120 (48.0) |
| 26–35 | 54 (21.6) | 50,001 – 75,000 | 37 (14.8) | 4 – 5 | 74 (29.6) | ||
| 36–50 | 85 (34.0) | 75,001 – 125,000 | 95 (38.0) | 6 + | 40 (16.0) | ||
| 51–60 | 36 (14.4) | 125,001 – 200,000 | 78 (31.2) | ||||
| Over 60 | 7 (2.8) | ||||||
| Frequency | 251 | ||||||
Hypothesis Testing Results based on Model 2 (Source: Own research)
| R | Estimate | R2 | S.E | ᵒt-value | ᵒᵒp-value |
|---|---|---|---|---|---|
| H1: Brand experience has a direct and a positive influence on emotional confidence | |||||
| 0.797 | 1.260 | 0.635 | 0.181 | 6.955 | *** |
| H2: Emotional confidence has a direct and positive influence on consumer brand satisfaction | |||||
| 0.647 | 0.439 | 0.418 | 0.047 | 9.340 | *** |
| H3: Emotional confidence has a direct and positive influence on consumer brand loyalty | |||||
| 0.496 | 0.412 | 0.246 | 0.070 | 5.857 | *** |
| H4: Consumer brand satisfaction as a direct and positive influence on consumer brand loyalty | |||||
| 0.258 | 0.315 | 0.066 | 0.098 | 3.216 | 0.001 |
Fit Indices based on Model 1 (Source: Own research)
| χ2 | df | χ2/df | AGFI | RMR | CFI | TLI | NFI | RMSEA |
|---|---|---|---|---|---|---|---|---|
| 600.738 | 203 | 2.95 | 0.780 | 0.250 | 0.897 | 0.883 | 0.853 | 0.089 |
Hypothesis Testing Results based on Model 1 (Source: Own research)
| R | Estimate | R2 | S.E | ᵒt-value | ᵒᵒp-value |
|---|---|---|---|---|---|
| H1: Brand experience has a direct and a positive influence on emotional confidence | |||||
| 0.786 | 1.228 | 0.617 | 0.178 | 6.890 | *** |
| H2: Emotional confidence has a direct and positive influence on consumer brand satisfaction | |||||
| 0.689 | 0.465 | 0.474 | 0.047 | 9.947 | *** |
| H3: Consumer brand satisfaction as a direct and positive influence on consumer brand loyalty | |||||
| 0.630 | 0.783 | 0.396 | 0.103 | 7.572 | *** |
Reliability, Mean, Std_ Deviation & Factor Extracted with PCA (Source: Own research)
| Scale | Item | Mean | Std. Dev | Extraction |
|---|---|---|---|---|
| EMOTIONAL CONFIDENCE Cronbach Alpha = 0.945 | BEC1: Strong positive feelings play an essential role while buying Toyota Car | 5.15 | 1.593 | 0.815 |
| BEC2: My strong positive feelings towards Toyota car gives me certainty to buy it | 5.28 | 1.497 | 0.838 | |
| BEC3: My Strong positive feelings guide my purchase of Toyota car | 5.20 | 1.402 | 0.817 | |
| BEC4: I rely on my strong positive feelings while buying the Toyota car | 5.19 | 1.459 | 0.808 | |
| BEC5: When I have strong positive feelings about the Toyota then it is easier to decide | 5.23 | 1.335 | 0.772 | |
| BEC6: My overall strong positive feelings towards Toyota makes me certain to buy it | 5.24 | 1.447 | 0.761 | |
| BEC7: My strong positive feelings about Toyota increase the likelihood of buying it again in future | 5.08 | 1.468 | 0.649 | |
| BRAND SATISFACTION Cronbach Alpha = 0.861 | BPQ1: Toyota offers very good quality cars | 5.45 | 1.192 | 0.712 |
| BPQ2: Toyota offers cars of consistent quality | 5.25 | 1.246 | 0.706 | |
| BPQ3: Toyota offers very reliable cars | 5.30 | 1.264 | 0.739 | |
| BPQ4: Toyota offers cars with excellent features | 5.28 | 1.278 | 0.718 | |
| BRAND EXPERIENCE Cronbach Alpha = 0.707 | BEX1: Sensory | 5.07 | 1.339 | 0.717 |
| BEX2: Sensory | 4.86 | 1.413 | 0.683 | |
| BEX3: Behavioural | 3.87 | 1.641 | 0.859 | |
| BEX4: Behavioural | 3.82 | 1.759 | 0.896 | |
| BEX5: Intellectual | 4.24 | 1.849 | 0.539 | |
| BEX6: Intellectual | 4.58 | 1.543 | 0.671 | |
| BRAND LOYALTY Cronbach Alpha = 0.883 | BL1: In the future, I will be loyal to Toyota brand | 4.84 | 1.399 | 0.713 |
| BL2: I will buy Toyota again | 5.02 | 1.385 | 0.715 | |
| BL3: Toyota will be my first choice in the future | 4.74 | 1.523 | 0.782 | |
| BL4: I will not buy other car brands | 4.13 | 1.780 | 0.630 | |
| BL5: I will recommend Toyota to others | 4.89 | 1.387 | 0.651 |
CFA based Reliability & Validity (Source: Own research)
| Variables | Factor Loading | t-value | R2 | α (alpha) | CR | AVE |
|---|---|---|---|---|---|---|
| Emotional Confidence | ||||||
| BEC1 | 0.855 | Fixedᵒ | 0.731 | 0.920 | 0.944 | 0.875 |
| BEC2 | 0.906 | 19.856 | 0.820 | |||
| BEC3 | 0.898 | 19.536 | 0.806 | |||
| BEC4 | 0.888 | 19.099 | 0.788 | |||
| BEC5 | 0.827 | 16.788 | 0.684 | |||
| BEC6 | 0.813 | 16.319 | 0.662 | |||
| BEC7 | 0.718 | 13.400 | 0.515 | |||
| Brand Satisfaction | ||||||
| BPQ1 | 0.772 | Fixedᵒ | 0.596 | 0.925 | 0.963 | 0.682 |
| BPQ2 | 0.761 | 11.818 | 0.580 | |||
| BPQ3 | 0.844 | 12.933 | 0.713 | |||
| BPQ4 | 0.742 | 11.504 | 0.551 | |||
| Brand Experience | ||||||
| BEX1 | 0.775 | Fixedᵒ | 0.600 | 0.882 | 0.815 | 0.572 |
| BEX2 | 0.755 | 6.821 | 0.570 | |||
| BEX3 | 0.985 | 4.999 | 0.970 | |||
| BEX4 | 0.794 | Fixedᵒ | 0.631 | |||
| BEX5 | 0.645 | 5.806 | 0.471 | |||
| BEX6 | 0.964 | Fixedᵒ | 0.928 | |||
| Brand Loyalty | ||||||
| BL1 | 0.805 | 10.754 | 0.649 | 0.838 | 0.802 | 0.851 |
| BL2 | 0.837 | 11.072 | 0.701 | |||
| BL3 | 0.873 | 11.395 | 0.763 | |||
| BL4 | 0.652 | Fixedᵒ | 0.425 | |||
| BL5 | 0.766 | 10.337 | 0.586 | |||
Confirmatory Factor Analysis (Source: Own research)
| Fit Indices | |||||||||
|---|---|---|---|---|---|---|---|---|---|
| χ2 | df | χ2/df | AGFI | RMR | CFI | TLI | NFI | RMSEA | |
| Emotional Confidence | 87.324 | 34 | 2.56 | 0.798 | 0.075 | 0.954 | 0.931 | 0.946 | 0.145 |
| Brand Experience | 16.034 | 06 | 2.67 | 0.925 | 0.080 | 0.981 | 0.952 | 0.970 | 0.082 |
| Brand Satisfaction | 2.568 | 02 | 1.28 | 0.975 | 0.020 | 0.999 | 0.996 | 0.994 | 0.034 |
| Brand Loyalty | 19.016 | 05 | 3.80 | 0.915 | 0.049 | 0.980 | 0.960 | 0.973 | 0.106 |
KMO and Bartlett's Test (Source: Own research)
| Kaiser-Meyer-Olkin Measure of Sampling Adequacy | 0.917 | |
| Bartlett's Test of Sphericity | Approx. Chi-Square | 3959.761 |
| Df | 231 | |
| Sig. | 0.000 | |