
Table 1.
Experimental design of the study.
| No. | Treatment group | Description |
|---|---|---|
| 1. | Control | P. vera trees without any treatment |
| 2. | Th | P. vera trees treated only with T. harzianum Rifai KRL-AG2 |
| 3. | Bc (1%) | P. vera trees treated only with 1% Bc |
| 4. | Bc (3%) | P. vera trees treated only with 3% Bc |
| 5. | ERS | P. vera trees treated only with commercial AMF formulation |
| 6. | Th + Bc (1%) | P. vera trees treated with both T. harzianum Rifai KRL-AG2 and 1% Bc |
| 7. | Th + Bc (3%) | P. vera trees treated with both T. harzianum Rifai KRL-AG2 and 3% Bc |
| 8. | Bc (1%) + ERS | P. vera trees treated with both 1% Bc and commercial AMF formulation |
| 9. | Bc (3%) + ERS | P. vera trees treated with both 3% Bc and commercial AMF formulation |
| 10. | Th + ERS | P. vera trees treated with both T. harzianum Rifai KRL-AG2 and commercial AMF formulation |
Table 2.
Early-stage (May) shoot length (cm), stem diameter (mm), number of branches (number) and number of vegetative buds (number) measurements in P. vera L. under AMF, Trichoderma and Bc applications.
| Treatments | Shoot length (cm) | Stem diameter (mm) | Number of branches (number) | Number of vegetative buds (number) |
|---|---|---|---|---|
| Control | 142.67 ± 2.91 b | 25.74 ± 1.06 d | 10.67 ± 0.88 e | 25.33 ± 1.20 f |
| Th | 173.33 ± 2.91 ab | 29.77 ± 0.97 cd | 15.67 ± 2.60 de | 33.66 ± 2.84 ef |
| Bc (1%) | 143.33 ± 3.53 b | 29.58 ± 1.88 cd | 26.67 ± 1.20 c | 53.66 ± 5.36 cd |
| Bc (3%) | 144.00 ± 14.15 b | 32.96 ± 1.63 abc | 42.67 ± 3.76 b | 57.66 ± 8.41 c |
| ERS | 182.33 ± 8.11 a | 32.75 ± 3.32 abc | 21.67 ± 0.33 cd | 42.66 ± 3.75 cde |
| Th + Bc (1%) | 198.33 ± 17.70 a | 35.93 ± 0.62 a | 57.67 ± 3.18 a | 79.66 ± 9.93 b |
| Th + Bc (3%) | 176.67 ± 8.01 ab | 30.60 ± 1.57 bcd | 24.33 ± 4.06 c | 52.00 ± 3.05 cd |
| Bc (1%) + ERS | 191.33 ± 19.03 a | 26.75 ± 0.93 d | 28.67 ± 3.18 c | 58.00 ± 2.64 c |
| Bc (3%) + ERS | 202.67 ± 14.99 a | 35.65 ± 1.28 ab | 41.67 ± 1.45 b | 96.66 ± 2.72 a |
| Th + ERS | 167.67 ± 8.45 ab | 26.22 ± 1.07 d | 13.67 ± 0.33 e | 37.33 ± 4.91 def |
1 AMF, arbuscular mycorrhizal fungi; Bc, biochar; ERS, commercial AMF (endo roots soluble); SE, standard error; Th, T. harzianum Rifai KRL-AG2. Application averages were grouped at a 5% significance level according to Duncan’s multiple comparison test. There is no statistically significant difference between averages indicated by the same letter (p ≤ 0.05).
Table 3.
Early-stage (May) PEI% and (r) and chlorophyll (SPAD) measurements in P. vera L. under AMF, Trichoderma and Bc applications.
| Treatments | PEI% | Photosynthetic efficiency index (r) | Chlorophyll (SPAD) |
|---|---|---|---|
| Control | 49.33 ± 2.33 e | 9.67 ± 0.88 b | 50.30 ± 7.09 c |
| Th | 71.95 ± 1.80 abc | 13.67 ± 0.33 a | 43.53 ± 0.97 abc |
| Bc (1%) | 69.57 ± 0.32 bc | 12.67 ± 1.45 ab | 34.77 ± 4.44 c |
| Bc (3%) | 71.37 ± 6.21 abc | 11.33 ± 1.20 ab | 42.30 ± 0.36 abc |
| ERS | 64.98 ± 1.34 c | 13.67 ± 0.33 a | 42.03 ± 1.80 abc |
| Th + Bc (1%) | 67.63 ± 2.33 cb | 12.33 ± 1.20 ab | 34.43 ± 0.70 c |
| Th + Bc (3%) | 79.27 ± 2.25 a | 10.33 ± 0.33 ab | 45.57 ± 0.98 ab |
| Bc (1%) + ERS | 69.93 ± 1.26 bc | 11.33 ± 0.67 ab | 39.13 ± 0.49 ab |
| Bc (3%) + ERS | 73.97 ± 0.64 ba | 11.33 ± 0.67 ab | 40.50 ± 1.16 ab |
| Th + ERS | 53.10 ± 0.46 e | 13.67 ± 2.03 a | 48.03 ± 0.44 ab |
1 AMF, arbuscular mycorrhizal fungi; Bc, biochar; ERS, commercial AMF (endo roots soluble); Pn (%), photosynthetic efficiency index rate; Pn (r), relative photosynthetic efficiency index measurement; PEI%, photosynthetic efficiency index (%); SE, standard error; Spad, chlorophyll content measurement (using Spad device); Th, T. harzianum Rifai KRL-AG2. Application averages were grouped at a 5% significance level according to Duncan’s multiple comparison test. There is no statistically significant difference between averages indicated by the same letter (p ≤ 0.05).
Table 4.
AMF, Trichoderma and Bc applications on early-stage (May) leaf colour parameters (L, a, b) in P. vera L.
| Treatments | L | a | B |
|---|---|---|---|
| Control | 42.20 ± 1.44 a | –2.00 ± 0.16 a | 7.58 ± 0.97 b |
| Th | 42.61 ± 0.73 a | –3.90 ± 0.37 abc | 8.05 ± 0.09 ab |
| Bc (1%) | 45.22 ± 2.47 a | –5.10 ± 0.41 c | 13.27 ± 2.06 a |
| Bc (3%) | 43.22 ± 2.68 a | –4.30 ± 1.75 abc | 12.92 ± 2.69 ab |
| ERS | 47.11 ± 3.20 a | –3.50 ± 0.88 abc | 11.52 ± 2.12 ab |
| Th + Bc (1%) | 43.62 ± 0.19 a | –2.80 ± 0.46 abc | 9.90 ± 1.06 ab |
| Th + Bc (3%) | 44.17 ± 4.87 a | –4.70 ± 1.01 bc | 12.44 ± 1.90 ab |
| Bc (1%) + ERS | 46.67 ± 0.17 a | –2.30 ± 0.43 ab | 11.63 ± 0.67 ab |
| Bc (3%) + ERS | 47.60 ± 3.13 a | –2.30 ± 0.30 ab | 8.96 ± 1.41 ab |
| Th + ERS | 44.71 ± 3.07 a | –3.00 ± 0.53 abc | 9.30 ± 1.23 ab |
1 AMF, arbuscular mycorrhizal fungi; Bc, biochar; ERS, commercial AMF (endo roots soluble); SE, standard error; Th, T. harzianum Rifai KRL–AG2. Application averages were grouped at a 5% significance level according to Duncan’s multiple comparison test. There is no statistically significant difference between averages indicated by the same letter (p ≤ 0.05).
Table 5.
Early-stage (May) leaf macro-nutrient elements (nitrogen (N), phosphorus (P), potassium (K), magnesium (Mg) and calcium (Ca)) in P. vera L. under AMF, Trichoderma and Bc applications.
| Treatments | N (%) | P (%) | K (%) | Mg (%) | Ca (%) |
|---|---|---|---|---|---|
| Control | 2.23 ± 0.01 a | 0.30 ± 0.01 a | 0.53 ± 0.02 c | 0.57 ± 0.01 e | 2.70 ± 0.01 b |
| Th | 0.86 ± 0.02 cd | 0.12 ± 0.01 e | 0.58 ± 0.01 b | 1.56 ± 0.02 c | 2.20 ± 0.02 gğ |
| Bc (1%) | 1.07 ± 0.02 b | 0.15 ± 0.01 de | 0.59 ± 0.01 b | 1.61 ± 0.02 b | 2.33 ± 0.01 de |
| Bc (3%) | 0.65 ± 0.04 f | 0.17 ± 0.01 bcd | 0.61 ± 0.01 b | 1.51 ± 0.02 cd | 2.24 ± 0.03 fg |
| ERS | 0.79 ± 0.03 de | 0.20 ± 0.01 b | 0.50 ± 0.02 cd | 1.52 ± 0.01 cd | 2.37 ± 0.01 d |
| Th + Bc (1%) | 0.76 ± 0.02 e | 0.17 ± 0.01 bcd | 0.82 ± 0.01 a | 1.91 ± 0.01 a | 2.94 ± 0.02 a |
| Th + Bc (3%) | 0.79 ± 0.03 de | 0.19 ± 0.01 bc | 0.46 ± 0.02 d | 1.48 ± 0.01 d | 2.12 ± 0.02 h |
| Bc (1%) + ERS | 0.33 ± 0.02 g | 0.15 ± 0.01 de | 0.58 ± 0.01 b | 1.52 ± 0.01 cd | 2.55 ± 0.02 c |
| Bc (3%) + ERS | 0.89 ± 0.05 c | 0.16 ± 0.01 cde | 0.46 ± 0.01 d | 1.50 ± 0.01 cd | 2.29 ± 0.02 ef |
| Th + ERS | 0.60 ± 0.02 f | 0.17 ± 0.01 bcd | 0.47 ± 0.01 d | 1.52 ± 0.02 cd | 2.18 ± 0.01 ğh |
1 AMF, arbuscular mycorrhizal fungi; Bc, biochar; ERS, commercial AMF (endo roots soluble); SE, standard error; Th, T. harzianum Rifai KRL-AG2. Application averages were grouped at a 5% significance level according to Duncan’s multiple comparison test. There is no statistically significant difference between averages indicated by the same letter (p ≤ 0.05).
Table 6.
Early-stage (May) foliar micronutrients (iron (Fe), copper (Cu), manganese (Mn) and zinc (Zn)) in P. vera L. under AMF, Trichoderma and Bc applications.
| Treatments | Fe (mg · kg−1) | Cu (mg · kg−1) | Mn (mg · kg−1) | Zn (mg · kg−1) |
|---|---|---|---|---|
| Control | 1.34 ± 0.02 g | 0.20 ± 0.01 d | 0.39 ± 0.01 e | 0.11 ± 0.01 a |
| Th | 1.60 ± 0.01 e | 0.23 ± 0.01 cd | 0.46 ± 0.02 d | 0.09 ± 0.01 ab |
| Bc (1%) | 1.66 ± 0.02 d | 0.24 ± 0.01 bc | 0.60 ± 0.01 c | 0.08 ± 0.01 b |
| Bc (3%) | 2.01 ± 0.04 a | 0.22 ± 0.01 cd | 0.70 ± 0.01 a | 0.11 ± 0.01 a |
| ERS | 1.83 ± 0.02 c | 0.25 ± 0.01 abc | 0.66 ± 0.02 ab | 0.10 ± 0.01 ab |
| Th + Bc (1%) | 1.91 ± 0.01 b | 0.24 ± 0.01 bc | 0.63 ± 0.01 bc | 0.10 ± 0.01 ab |
| Th + Bc (3%) | 1.53 ± 0.01 f | 0.28 ± 0.01 a | 0.59 ± 0.02 c | 0.08 ± 0.01 b |
| Bc (1%) + ERS | 1.88 ± 0.02 de | 0.28 ± 0.01 ab | 0.63 ± 0.01 bc | 0.10 ± 0.01 ab |
| Bc (3%) + ERS | 1.61 ± 0.01 de | 0.24 ± 0.01 bc | 0.62 ± 0.02 bc | 0.11 ± 0.01 a |
| Th + ERS | 1.59 ± 0.02 e | 0.28 ± 0.01 ab | 0.58 ± 0.01 c | 0.09 ± 0.01 ab |
1 AMF, arbuscular mycorrhizal fungi; Bc, biochar; ERS, commercial AMF (endo roots soluble); SE, standard error; Th, T. harzianum Rifai KRL-AG2. Application averages were grouped at a 5% significance level according to Duncan’s multiple comparison test. There is no statistically significant difference between averages indicated by the same letter (p ≤ 0.05).
Table 7.
Early-stage (May) soil pH, soil EC and AMF soil spore density in P. vera L. under AMF, Trichoderma and Bc applications.
| Treatments | Soil pH (mS · cm−1) | Soil EC (dS · m−1) | AMF soil spore density (number) |
|---|---|---|---|
| Control | 7.25 ± 0.03 bc | 2.55 ± 0.01 a | 3.67 ± 0.05 d |
| Th | 7.32 ± 0.03 b | 1.54 ± 0.01 b | NA |
| Bc (1%) | 7.32 ± 0.03 b | 1.02 ± 0.01 c | NA |
| Bc (3%) | 7.33 ± 0.03 b | 1.03 ± 0.01 c | NA |
| ERS | 7.21 ± 0.03 bc | 1.84 ± 0.01 ab | 8.33 ± 0.05 b |
| Th + Bc (1%) | 7.38 ± 0.03 ab | 1.01 ± 0.01 c | NA |
| Th + Bc (3%) | 7.39 ± 0.03 ab | 1.03 ± 0.01 c | NA |
| Bc (1%) + ERS | 7.39 ± 0.03 ab | 1.92 ± 0.01 ab | 9.00 ± 0.05 ab |
| Bc (3%) + ERS | 7.41 ± 0.03 a | 1.93 ± 0.01 ab | 10.00 ± 0.05 a |
| Th + ERS | 6.92 ± 0.03 c | 1.45 ± 0.01 b | 7.67 ± 0.05 c |
1 AMF, arbuscular mycorrhizal fungi; Bc, biochar; EC, electrical conductivity; ERS, commercial AMF (endo roots soluble); NA, not assessed; SE, standard error; Th, T. harzianum Rifai KRL-AG2. Application averages were grouped at a 5% significance level according to Duncan’s multiple comparison test. There is no statistically significant difference between averages indicated by the same letter (p ≤ 0.05).
Table 8.
Late-stage (September) (May) shoot length (cm), stem diameter (mm), number of branches (number) and number of vegetative buds (number) measurements in P. vera L. under AMF, Trichoderma and Bc applications.
| Treatments | Shoot length (cm) | Stem diameter (mm) | Number of branches (number) | Number of vegetative buds (number) |
|---|---|---|---|---|
| Control | 145.33 ± 3.18 c | 27.55 ± 0.84 c | 12.67 ± 0.88 g | 27.67 ± 2.03 f |
| Th | 178.00 ± 1.73 abc | 31.85 ± 1.14 bc | 18.67 ± 2.60 fg | 38.00 ± 4.04 ef |
| Bc (1%) | 146.67 ± 3.18 c | 30.44 ± 1.75 bc | 30.33 ± 1.76 ce | 57.67 ± 3.71 cd |
| Bc (3%) | 149.00 ± 14.73 c | 34.36 ± 1.63 ab | 48.67 ± 4.91 b | 62.67 ± 7.45 c |
| ERS | 191.00 ± 9.29 ab | 34.02 ± 3.49 ab | 28.33 ± 1.20 e | 47.00 ± 3.46 cde |
| Th + Bc (1%) | 205.00 ± 16.77 ab | 37.38 ± 0.88 a | 60.67 ± 3.76 a | 85.00 ± 10.02 b |
| Th + Bc (3%) | 181.67 ± 7.86 abc | 32.42 ± 1.48 abc | 31.00 ± 3.46 ce | 57.67 ± 4.10 cd |
| Bc (1%) + ERS | 195.67 ± 18.52 ab | 28.47 ± 1.03 c | 37.67 ± 0.88 c | 62.33 ± 2.03 c |
| Bc (3%) + ERS | 212.33 ± 15.34 a | 37.16 ± 1.05 a | 47.33 ± 1.20 b | 100.67 ± 2.73 a |
| Th + ERS | 172.00 ± 7.57 bc | 27.90 ± 0.73 c | 25.67 ± 0.88e f | 42.67 ± 5.24 def |
1 AMF, arbuscular mycorrhizal fungi; Bc, biochar; ERS, commercial AMF (endo roots soluble); SE, standard error; Th, T. harzianum Rifai KRL-AG2. Application averages were grouped at a 5% significance level according to Duncan’s multiple comparison test. There is no statistically significant difference between averages indicated by the same letter (p ≤ 0.05).
Table 9.
Late-stage (September) PEI% and (r) and chlorophyll (SPAD) measurements in P. vera L. under AMF, Trichoderma, and Bc applications.
| Treatments | Photosynt (%) | Photosynt (r) | Chlorophyll (SPAD) |
|---|---|---|---|
| Control | 71.50 ± 0.76 ab | 11.67 ± 0.33 c | 52.47 ± 6.67 a |
| Th | 76.88 ± 0.42 ab | 16.67 ± 0.88 ab | 45.07 ± 0.58 abc |
| Bc (1%) | 72.37 ± 0.69 ab | 16.67 ± 0.33 ab | 37.53 ± 3.67 cd |
| Bc (3%) | 74.48 ± 6.10 ab | 16.00 ± 0.58 ab | 43.43 ± 0.59 bcd |
| ERS | 67.63 ± 1.04 b | 17.67 ± 0.88 a | 43.61 ± 1.71 bcd |
| Th + Bc (1%) | 69.93 ± 2.50 b | 14.67 ± 1.45 b | 36.01 ± 0.37 d |
| Th + Bc (3%) | 80.90 ± 1.76 a | 14.67 ± 0.33 b | 46.90 ± 0.81 ab |
| Bc (1%) + ERS | 71.13 ± 1.27 b | 15.33 ± 0.67 ab | 41.47 ± 0.66 bcd |
| Bc (3%) + ERS | 77.07 ± 0.35 ab | 15.67 ± 0.88 ab | 41.47 ± 1.07 bcd |
| Th + ERS | 67.97 ± 5.66 b | 17.67 ± 0.67 a | 49.33 ± 0.67 ab |
1 AMF, arbuscular mycorrhizal fungi; Bc, biochar; ERS, commercial AMF (endo roots soluble); Pn (%), photosynthetic efficiency index rate; Pn (r), relative photosynthetic efficiency index measurement; PEI%, photosynthetic efficiency index (%); SE, standard error; Spad, chlorophyll content measurement (using Spad device); Th, T. harzianum Rifai KRL-AG2. Application averages were grouped at a 5% significance level according to Duncan’s multiple comparison test. There is no statistically significant difference between averages indicated by the same letter (p ≤ 0.05).
Table 10.
AMF, Trichoderma and Bc applications on late-stage (September) leaf colour parameters (L, a, b) in P. vera L.
| Treatments | L | a | b |
|---|---|---|---|
| Control | 44.14 ± 1.22 a | –2.21 ± 0.12 a | 8.18 ± 1.09 c |
| Th | 44.22 ± 0.65 a | –4.32 ± 0.45 abc | 8.70 ± 0.25 bc |
| Bc (1%) | 47.11 ± 3.02 a | –5.70 ± 0.35 c | 14.22 ± 2.14 a |
| Bc (3%) | 45.00 ± 2.45 a | –4.42 ± 1.72 abc | 14.07 ± 2.18 a |
| ERS | 48.51 ± 3.32 a | –4.15 ± 0.93 abc | 13.05 ± 1.59 ab |
| Th + Bc (1%) | 45.42 ± 0.40 a | –3.19 ± 0.53 abc | 10.78 ± 1.08 abc |
| Th + Bc (3%) | 45.70 ± 4.37 a | –5.04 ± 1.00 bc | 13.24 ± 1.96 ab |
| Bc (1%) + ERS | 48.19 ± 0.51 a | –2.51 ± 0.35 ab | 12.40 ± 0.53 abc |
| Bc (3%) + ERS | 48.38 ± 3.20 a | –2.73 ± 0.34 ab | 9.95 ± 1.27 abc |
| Th + ERS | 45.70 ± 3.02 a | –3.49 ± 0.62 abc | 9.87 ± 1.13 abc |
1 AMF, arbuscular mycorrhizal fungi; Bc, biochar; ERS, commercial AMF (endo roots soluble); SE, standard error; Th, T. harzianum Rifai KRL-AG2. Application averages were grouped at a 5% significance level according to Duncan’s multiple comparison test. There is no statistically significant difference between averages indicated by the same letter (p ≤ 0.05).
Table 11.
Late-stage (September) leaf macro-nutrient elements (nitrogen (N), phosphorus (P), potassium (K), magnesium (Mg) and calcium (Ca)) in P. vera L. under AMF, Trichoderma and Bc applications.
| Treatments | N (%) | P (%) | K (%) | Mg (%) | Ca (%) |
|---|---|---|---|---|---|
| Control | 0.93 ± 0.68 ab | 0.32 ± 0.01 a | 0.58 ± 0.02 c | 0.60 ± 0.01 e | 2.72 ± 0.01 b |
| Th | 0.92 ± 0.01 ab | 0.15 ± 0.01 f | 0.61 ± 0.01 bc | 1.58 ± 0.02 c | 2.23 ± 0.02 g |
| Bc (1%) | 1.11 ± 0.01 a | 0.19 ± 0.01 cde | 0.61 ± 0.01 bc | 1.63 ± 0.02 b | 2.37 ± 0.01 de |
| Bc (3%) | 0.71 ± 0.02 ab | 0.19 ± 0.01 cde | 0.64 ± 0.01 b | 1.55 ± 0.02 cd | 2.31 ± 0.03 f |
| ERS | 0.84 ± 0.02 ab | 0.22 ± 0.01 b | 0.52 ± 0.02 d | 1.55 ± 0.01 cd | 2.40 ± 0.01 d |
| Th + Bc (1%) | 0.81 ± 0.01 ab | 0.20 ± 0.01 cd | 0.85 ± 0.01 a | 1.94 ± 0.01 a | 2.97 ± 0.01 a |
| Th + Bc (3%) | 0.83 ± 0.02 ab | 0.21 ± 0.01 bc | 0.49 ± 0.01 d | 1.52 ± 0.01 d | 2.17 ± 0.01 ğ |
| Bc (1%) + ERS | 0.37 ± 0.02 b | 0.17 ± 0.01 ef | 0.62 ± 0.02 b | 1.57 ± 0.02 cd | 2.61 ± 0.02 c |
| Bc (3%) + ERS | 0.94 ± 0.04 ab | 0.19 ± 0.01 de | 0.48 ± 0.01 d | 1.54 ± 0.02 cd | 2.33 ± 0.02 ef |
| Th + ERS | 0.64 ± 0.02 ab | 0.20 ± 0.01 bcd | 0.50 ± 0.01 d | 1.55 ± 0.02 cd | 2.22 ± 0.01 g |
1 AMF, arbuscular mycorrhizal fungi; Bc, biochar; ERS, commercial AMF (endo roots soluble); SE, standard error; Th, T. harzianum Rifai KRL-AG2. Application averages were grouped at a 5% significance level according to Duncan’s multiple comparison test. There is no statistically significant difference between averages indicated by the same letter (p ≤ 0.05).
Table 12.
Late-stage (September) foliar micronutrients (iron (Fe), copper (Cu), manganese (Mn) and zinc (Zn)) in P. vera L. under AMF, Trichoderma and Bc applications.
| Treatments | Fe (mg · kg−1) | Cu (mg · kg−1) | Mn (mg · kg−1) | Zn (mg · kg−1) |
|---|---|---|---|---|
| Control | 1.37 ± 0.02 g | 0.23 ± 0.01 d | 0.42 ± 0.01 e | 0.14 ± 0.01 a |
| Th | 1.62 ± 0.01 ef | 0.25 ± 0.01 cd | 0.50 ± 0.01 d | 0.11 ± 0.01 ab |
| Bc (1%) | 1.70 ± 0.01 d | 0.27 ± 0.00 c | 0.64 ± 0.01 bc | 0.10 ± 0.01 b |
| Bc (3%) | 2.05 ± 0.03 a | 0.25 ± 0.01 cd | 0.73 ± 0.01 a | 0.12 ± 0.01 ab |
| ERS | 1.87 ± 0.01 c | 0.28 ± 0.01 bc | 0.70 ± 0.01 a | 0.12 ± 0.01 ab |
| Th + Bc (1%) | 1.95 ± 0.01 b | 0.26 ± 0.01 c | 0.66 ± 0.02 b | 0.11 ± 0.01 ab |
| Th + Bc (3%) | 1.58 ± 0.01 f | 0.31 ± 0.00 a | 0.62 ± 0.02 bc | 0.10 ± 0.01 b |
| Bc (1%) + ERS | 1.91 ± 0.01 bc | 0.31 ± 0.01 a | 0.65 ± 0.01 b | 0.10 ± 0.01 b |
| Bc (3%) + ERS | 1.63 ± 0.01 e | 0.26 ± 0.01 c | 0.64 ± 0.01 bc | 0.12 ± 0.01 ab |
| Th + ERS | 1.62 ± 0.01 ef | 0.30 ± 0.01 ab | 0.61 ± 0.01 c | 0.10 ± 0.01 b |
1 AMF, arbuscular mycorrhizal fungi; Bc, biochar; ERS, commercial AMF (endo roots soluble); SE, standard error; Th, T. harzianum Rifai KRL-AG2.Application averages were grouped at a 5% significance level according to Duncan’s multiple comparison test. There is no statistically significant difference between averages indicated by the same letter (p ≤ 0.05).
Table 13.
Late-stage (September) soil pH, soil EC and AMF soil spore density in P. vera L. under AMF, Trichoderma and Bc applications.
| Treatments | Soil pH (mS · cm−1) | Soil EC (dS · m−1) | AMF soil spore density (number) |
|---|---|---|---|
| Control | 7.28 ± 0.03 bc | 2.56 ± 0.01 a | 3.67 ± 0.05 c |
| Th | 7.30 ± 0.03 b | 1.55 ± 0.01 b | NA |
| Bc (1%) | 7.32 ± 0.03 b | 1.03 ± 0.01 c | NA |
| Bc (3%) | 7.33 ± 0.03 b | 1.04 ± 0.01 c | NA |
| ERS | 7.22 ± 0.03 bc | 1.86 ± 0.01 ab | 17.00 ± 0.05 a |
| Th + Bc (1%) | 7.38 ± 0.03 ab | 1.02 ± 0.01 c | NA |
| Th + Bc (3%) | 7.39 ± 0.03 ab | 1.04 ± 0.01 c | NA |
| Bc (1%) + ERS | 7.40 ± 0.03 ab | 1.93 ± 0.01 ab | 16.67 ± 0.05 ab |
| Bc (3%) + ERS | 7.41 ± 0.03 a | 1.94 ± 0.01 ab | 17.00 ± 0.05 a |
| Th + ERS | 6.92 ± 0.03 c | 1.46 ± 0.01 b | 13.67 ± 0.05 b |
1 AMF, arbuscular mycorrhizal fungi; Bc, biochar; EC, electrical conductivity; ERS, commercial AMF (endo roots soluble); NA, not assessed; SE, standard error; Th, T. harzianum Rifai KRL-AG2. Application averages were grouped at a 5% significance level according to Duncan’s multiple comparison test. There is no statistically significant difference between averages indicated by the same letter (p ≤ 0.05).
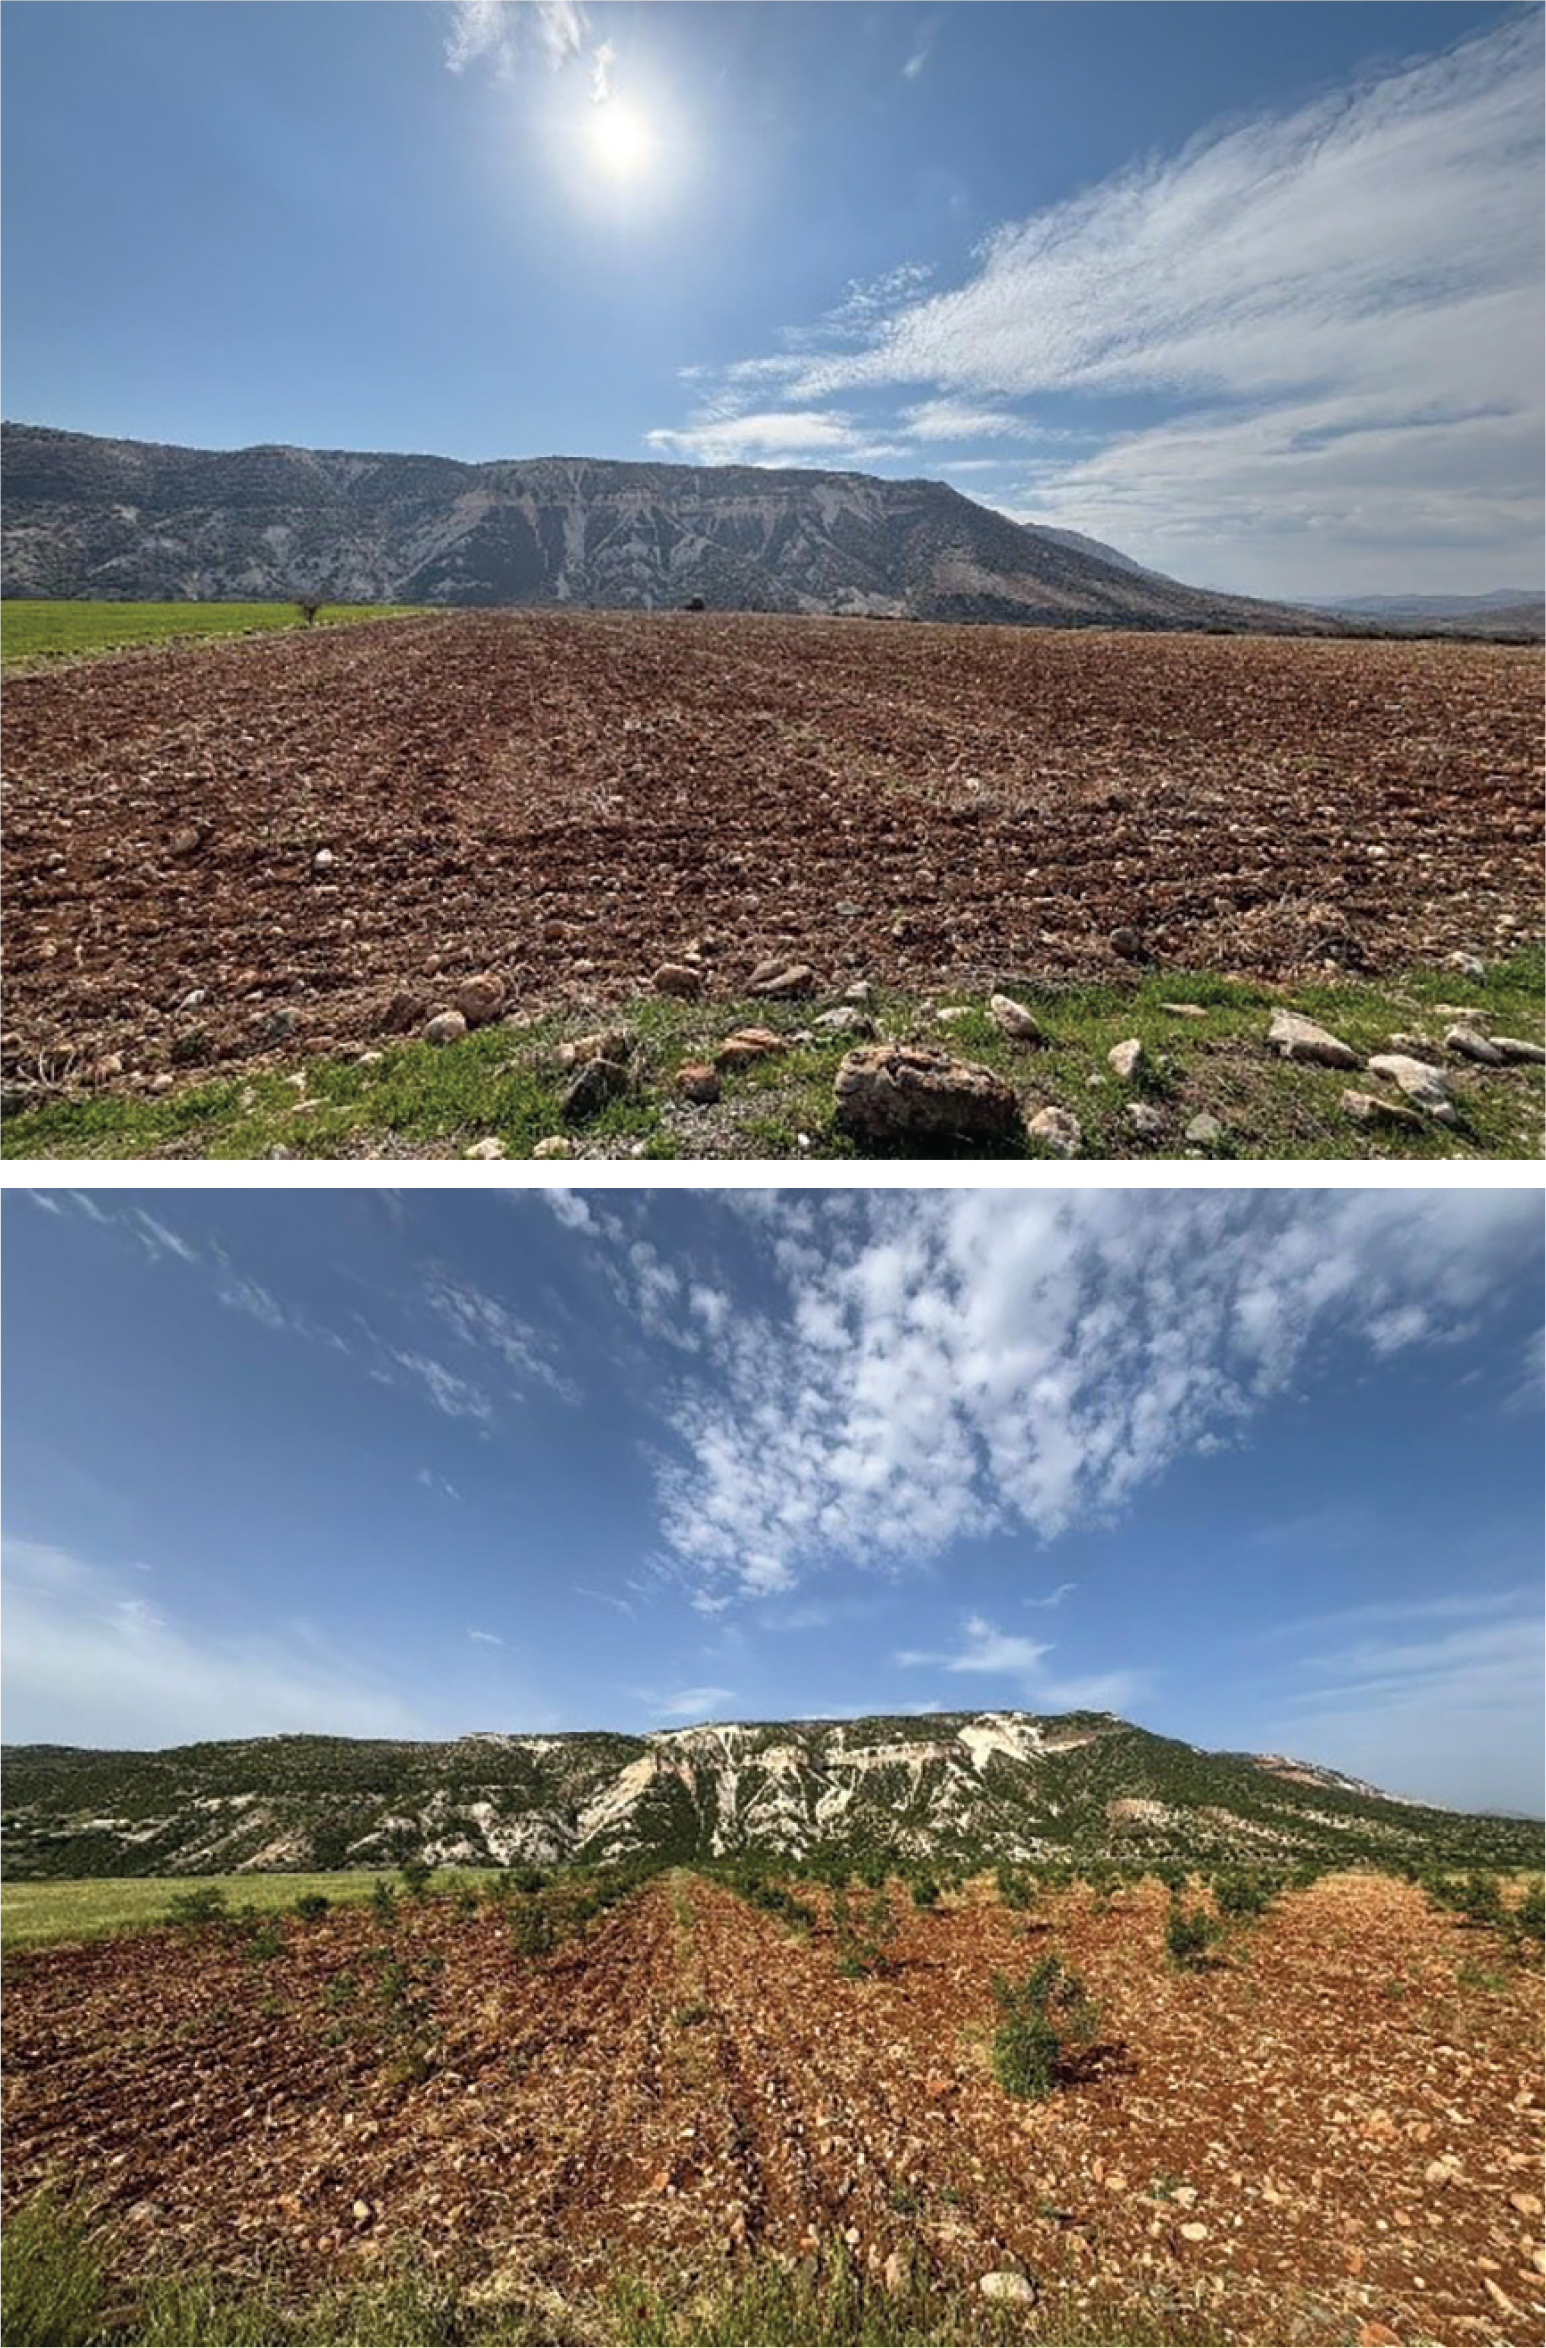
Supplementary Figure 1.
Land images reflecting the general view of the study area.