
Introduction
The Antep pistachio (P. vera L.), a member of the Anacardiaceae family, is a dioecious species with high economic value in global dried nut markets (Nezami and Gallego, 2023). In Türkiye, pistachios are primarily cultivated under rainfed conditions, often in soils deficient in organic matter, nitrogen (N), phosphorus (P) and potassium (K) (Bellitürk et al., 2019). High soil pH, nutrient imbalances and reduced availability of beneficial soil microorganisms can restrict the availability of essential elements (Bayram et al., 2023). Other Pistacia species are deciduous, diploid, drought-tolerant trees that require the coexistence of male and female individuals for fruit set. Under natural conditions, P. vera does not develop a prominent taproot; instead, it forms a highly branched root system rich in fine roots, which enhances the plant’s capacity for water and nutrient acquisition under limiting conditions (Hormaza and Wünsch, 2007). Vegetative propagation through rootstock and scion combinations is essential for pistachio cultivation (Paymaneh et al., 2019). However, the sustainability of pistachio production is increasingly threatened by climate change–induced alterations in soil properties.
Building on these challenges, rising soil temperatures can accelerate the decomposition of organic matter by stimulating microbial activity, thereby reducing soil carbon stocks and water retention capacity. These changes may ultimately compromise long-term soil fertility and agricultural productivity. Therefore, adaptive soil and water management strategies are required to maintain soil quality under changing climatic conditions (Kılıç and Kuzucu, 2024). Soils in Türkiye are generally deficient in organic matter and essential nutrients such as nitrogen, phosphorus, iron, zinc and manganese; moreover, these nutrients are often present in forms unavailable to plants, which limits pistachio productivity (Gürsoy, 2021). Most pistachio-growing regions are located in arid and semi-arid environments characterised by limited water availability and increasing salinity. Therefore, the integration of stress-tolerant genotypes with environmentally sustainable inputs is essential to mitigate the adverse effects of drought and salinity (Fattahi et al., 2021).
To address these production limitations, various biological inputs have been explored. Among these approaches, biostimulants have gained attention due to their role in improving yield, reducing shell ratio and enhancing plant tolerance to abiotic stress. Arbuscular mycorrhizal fungi (AMF) are widely recognised as sustainable bio-inputs that can reduce dependency on inorganic fertilisers (Berruti et al., 2016). AMF establish symbiotic associations with over 80% of terrestrial plant species (Smith and Smith, 2011), facilitating phosphorus uptake, improving photosynthetic efficiency and enhancing tolerance to both abiotic and biotic stresses (Van Der Heijden et al., 2015; Pérez-De-Luque et al., 2017). Similarly, soil improvement through microbial fertilisers and soil conditioners often results in synergistic effects on plant growth (Jiang et al., 2020; Güneş et al., 2024). In this context, Trichoderma spp. are recognised as beneficial saprophytic fungi that promote plant growth by enhancing nutrient availability, suppressing soil-borne pathogens and improving rhizosphere microbial interactions (Chen et al., 2021). Previous studies have demonstrated that Trichoderma applications improve morphological traits and nutrient accumulation in pistachio, including branch number, leaf area, chlorophyll content and mineral elements such as P, Mg, Fe and Ca (Hosseinzeynali et al., 2020). Recently, environmentally friendly plant protection strategies have gained global importance. Biological control using beneficial rhizosphere microorganisms has emerged as a promising alternative to chemical inputs, due to their antagonistic activity against plant pathogens (Mahdizadehnaraghi et al., 2015).
Biochar (Bc), a carbon-rich material produced through the pyrolysis of organic biomass under limited oxygen conditions, has been reported to improve soil biological activity and provide a favourable habitat for beneficial microorganisms, including AMF (Elzobair et al., 2016). Bc enhances plant resistance to both abiotic (e.g., drought and salinity) and biotic stresses (Ali et al., 2017; Güneş et al., 2024). Moreover, it can influence plant–microbe signalling pathways and improve soil physicochemical properties such as water-holding capacity, nutrient retention, pH regulation and adsorption potential (Graber et al., 2014; Güneş, 2026). Despite the well-documented individual effects of AMF and Trichoderma on pistachio growth, studies integrating Bc with these biological inputs remain limited, particularly under pre-bearing conditions.
This study is one of the few that systematically evaluate the combined effects of mycorrhiza, Trichoderma and Bc applications on the growth of young pistachio trees, focusing on morphological, physiological, nutritional and soil biological parameters. In this study, it was hypothesised that the combined application of AMF, T. harzianum and Bc at different application rates (1% and 3%) would produce synergistic effects on plant growth, physiological performance, nutrient dynamics and soil quality compared to individual applications.
Accordingly, the objective of this study is to determine the most effective combination and application rates of AMF, Trichoderma and Bc, and to comparatively demonstrate the effects of these applications on morphological and physiological characteristics, plant nutrient status and AMF soil spore density in non-bearing pistachio (P. vera L.) trees. It is anticipated that the findings will contribute to the reduction of chemical inputs and provide a scientific foundation for the development of sustainable pistachio cultivation strategies.
MATERIALS AND METHODS
Experimental area and climate characteristics
The fieldwork was conducted in the Tut district of Adiyaman Province, Türkiye (37°45'24.3''N, 38°00'34.0''E), as illustrated in Supplementary Figure 1, which shows the general view of the study area. The experimental orchard consisted of three-year-old P. vera L. ('Uzun' variety) trees. The region has a subtropical continental climate characterised by semi-arid conditions with long, hot and dry summers and relatively mild and humid winters. Fieldwork began in the first week of February 2025. Baseline measurements were taken in early May, and follow-up assessments were completed by the end of September. To contextualise in-season environmental variability, seasonal temperature and precipitation data were obtained from nearby official meteorological stations operated by the Turkish State Meteorological Service (MGM) (2021). During the 2025 growing season, regional temperature anomalies and reduced precipitation were evident; this was consistent with broader national climate trends indicating that average temperatures were above climate norms and annual precipitation amounts were below average.
Bc application
Prior to treatment, composite soil samples were collected from a depth of 0–30 cm and analysed for pH, electrical conductivity (EC), calcium carbonate content, texture, organic matter and nutrient availability. The soil’s pH value was 8.20, indicating an alkaline character; its EC was 624 μS · cm−1; its calcium carbonate concentration was 43.14%; it was clay-dominated, and its organic matter content was 1.53%. Bc was supplied by Single Carbon Barbecue Coal Production Inc., Bursa, Türkiye produced from 100% natural oak sawdust under moderate pyrolysis conditions (~450°C) with a controlled heating rate. Detailed physicochemical properties of the batch in question were not available; therefore, the characterisation of the Bc is based on supplier information and production conditions. This Bc, applied at rates of 1% and 3% to the root zone of each young tree, is equivalent to approximately 5.5 t · ha−1 at the field scale; the calculation was based on the actual soil volume within the root zone; meaning a homogeneous mixture throughout the entire 0–15 cm soil layer was not assumed (Qin et al., 2016; Das et al., 2024). This rate is consistent with empirical studies showing that Bc applications of 5–10 t · ha−1 in intensive agricultural systems lead to significant improvements in soil properties and crop yields (Van Long and Van Dung, 2023; Güneş, 2026).
AMF and Trichoderma inoculation
In this study, T. harzianum (Rifai strain KRL-AG2, T22; ATCC 20847) and a commercial water-soluble AMF formulation (Endo Roots Soluble, ERS; Bioglobal Ltd., Antalya, Türkiye) were used. The ERS formulation consists of a standardised arbuscular mycorrhizal fungal consortium including Glomus intraradices, Glomus aggregatum, Glomus mosseae, Glomus clarum, Glomus monosporus, Glomus deserticola, Glomus brasilianum, Glomus etunicatum and Gigaspora margarita. Individual strain identities are proprietary and have not been disclosed to the public; they are not available in NCBI or international culture collections. The spore density is approximately 1.5 × 10⁴ spores · g−1, and viability has been maintained at over 90% to ensure reproducibility. Therefore, AMF applications were conducted and evaluated at the consortium level rather than at the individual strain level.
Applications were carried out in February by diluting 50 g of the product per 100 young trees and applying it to the crown projection area beyond a 1-m radius from the trunk, in accordance with the manufacturer’s instructions. Applications were made once a week for 3 weeks using the drip irrigation method.
Experimental design
The study was designed using a randomised block design with three replications. The experimental design of the study is presented in Table 1 below.
Table 1.
Experimental design of the study.
| No. | Treatment group | Description |
|---|---|---|
| 1. | Control | P. vera trees without any treatment |
| 2. | Th | P. vera trees treated only with T. harzianum Rifai KRL-AG2 |
| 3. | Bc (1%) | P. vera trees treated only with 1% Bc |
| 4. | Bc (3%) | P. vera trees treated only with 3% Bc |
| 5. | ERS | P. vera trees treated only with commercial AMF formulation |
| 6. | Th + Bc (1%) | P. vera trees treated with both T. harzianum Rifai KRL-AG2 and 1% Bc |
| 7. | Th + Bc (3%) | P. vera trees treated with both T. harzianum Rifai KRL-AG2 and 3% Bc |
| 8. | Bc (1%) + ERS | P. vera trees treated with both 1% Bc and commercial AMF formulation |
| 9. | Bc (3%) + ERS | P. vera trees treated with both 3% Bc and commercial AMF formulation |
| 10. | Th + ERS | P. vera trees treated with both T. harzianum Rifai KRL-AG2 and commercial AMF formulation |
Assessment of the parameters
During the study period, all measurements were taken twice: the first at the beginning of May, timed to coincide with the end of the experimental period, and the second at the end of September. To assess the effects of treatment at two different stages of development, the same parameters were examined in May and September. Measurements for each sampling period were recorded and interpreted independently; no direct comparison was made between the two sampling dates. At the end of the experiment, shoot length (cm), stem diameter (cm), number of vegetative buds and number of branches were recorded for each replicate using a ruler.
Soil samples were collected from a depth of 10 cm within the projection area of each tree. Soil pH and EC were measured in a 1:2.5 soil–water suspension using standard pH and EC meters (Richards, 1954; Jackson, 1958).
Photosynthetic performance was assessed using a portable chlorophyll fluorescence device (EARS MiniPPM, EARS Plant Photosynthesis Monitoring B.V., Wageningen, The Netherlands). The system does not directly measure gas exchange or CO2 assimilation; instead, it provides parameters derived from chlorophyll fluorescence, which are used as indicators of photosynthetic efficiency.
Accordingly, all measurements previously referred to as ‘Photosynthesis (%)’ and ‘Photosynthesis (r)’ have been redefined as the photosynthetic efficiency index (%) (PEI%) and the relative photosynthetic efficiency index (rPEI), respectively. These parameters represent dimensionless, fluorescence-based indices calculated internally by the device and should be interpreted as indirect indicators of photosynthetic performance rather than direct measurements of photosynthesis.
Leaf colour parameters (L*, a*, b*) were determined using a WR18/4-8 FRU (Shenzhen Wave Optoelectronics Technology Co., Ltd., Shenzhen, Guangdong, China) colorimeter. In this system, L* indicates lightness (0 = black, 100 = white), while a* and b* correspond to the red-green and yellow-blue axes, respectively.
To determine mineral concentrations, leaf samples collected from each treatment were oven-dried at 70°C for 48 hr and then ground. Macronutrients – phosphorus (P), potassium (K), calcium (Ca) and magnesium (Mg) – and micronutrients – iron (Fe), zinc (Zn) and sodium (Na) – were analysed. While phosphorus (P) was determined using colorimetric methods, potassium (K), calcium (Ca) and magnesium (Mg) were measured by flame photometry or Inductively Coupled Plasma–Optical Emission Spectroscopy (ICP-OES). Micronutrients, including Fe, Cu, Mn and Zn, were analysed using atomic absorption spectroscopy or ICP-OES. Calibration curves were established for elements measured spectrophotometrically via Ultraviolet (UV/Vis), and readings were validated against certified reference standards to ensure accuracy and reliability.
The AMF spore density in the rhizosphere soil of AMF-hosting plants was determined using the wet sieving method developed by Gerdemann and Nicholson (1963). Root colonisation was not assessed, and AMF activity was evaluated based on soil spore density as a non-destructive indicator.
Data analysis
All data were analysed using analysis of variance in IBM SPSS Statistics (IBM Corp., 2021, Armonk, NY, USA). To evaluate the effects of treatments at different developmental stages, separate statistical analyses were conducted for each sampling period (May and September). Although measurements were taken from the same experimental units on both sampling dates, each date represented a different phenological stage and was treated as a separate experimental phase rather than a repeated measurement over time. Accordingly, within-tree temporal variation was not the focus of this study, and repeated measures or mixed-effects modelling were not applied. Mean comparisons were performed using Tukey’s HSD test at the p < 0.05 level, and results are presented as mean ± standard error (SE).
Results
Early-stage (May) shoot and vegetative parameters
Plant biostimulants improved shoot length, stem thickness, branch number and vegetative bud number in early pistachio tree growth (Table 2). Treatment differences were statistically significant (p ≤ 0.05). Shoot length and stem thickness were greater in Th + Bc (1%) and Bc (3%) + ERS treatments than in the control group. Branch number also increased significantly with Th + Bc (1%) compared to the control and single applications (p ≤ 0.05). Vegetative bud number was significantly affected by the biostimulant treatments (p ≤ 0.05), with values increasing markedly compared to the control. The highest vegetative bud number was recorded in the Bc (3%) + ERS combination (96.66), followed by Th + Bc (1%) (79.66), both of which were significantly higher than the control (25.33) and the single-application treatments. Trichoderma or AMF applied alone had limited effects, whereas their combinations produced consistent increases in shoot and branch parameters (Table 2). Overall, combined applications of biochar with either Trichoderma or ERS generally promoted greater shoot development and vegetative bud formation than single applications (Table 2).
Table 2.
Early-stage (May) shoot length (cm), stem diameter (mm), number of branches (number) and number of vegetative buds (number) measurements in P. vera L. under AMF, Trichoderma and Bc applications.
| Treatments | Shoot length (cm) | Stem diameter (mm) | Number of branches (number) | Number of vegetative buds (number) |
|---|---|---|---|---|
| Control | 142.67 ± 2.91 b | 25.74 ± 1.06 d | 10.67 ± 0.88 e | 25.33 ± 1.20 f |
| Th | 173.33 ± 2.91 ab | 29.77 ± 0.97 cd | 15.67 ± 2.60 de | 33.66 ± 2.84 ef |
| Bc (1%) | 143.33 ± 3.53 b | 29.58 ± 1.88 cd | 26.67 ± 1.20 c | 53.66 ± 5.36 cd |
| Bc (3%) | 144.00 ± 14.15 b | 32.96 ± 1.63 abc | 42.67 ± 3.76 b | 57.66 ± 8.41 c |
| ERS | 182.33 ± 8.11 a | 32.75 ± 3.32 abc | 21.67 ± 0.33 cd | 42.66 ± 3.75 cde |
| Th + Bc (1%) | 198.33 ± 17.70 a | 35.93 ± 0.62 a | 57.67 ± 3.18 a | 79.66 ± 9.93 b |
| Th + Bc (3%) | 176.67 ± 8.01 ab | 30.60 ± 1.57 bcd | 24.33 ± 4.06 c | 52.00 ± 3.05 cd |
| Bc (1%) + ERS | 191.33 ± 19.03 a | 26.75 ± 0.93 d | 28.67 ± 3.18 c | 58.00 ± 2.64 c |
| Bc (3%) + ERS | 202.67 ± 14.99 a | 35.65 ± 1.28 ab | 41.67 ± 1.45 b | 96.66 ± 2.72 a |
| Th + ERS | 167.67 ± 8.45 ab | 26.22 ± 1.07 d | 13.67 ± 0.33 e | 37.33 ± 4.91 def |
1 AMF, arbuscular mycorrhizal fungi; Bc, biochar; ERS, commercial AMF (endo roots soluble); SE, standard error; Th, T. harzianum Rifai KRL-AG2. Application averages were grouped at a 5% significance level according to Duncan’s multiple comparison test. There is no statistically significant difference between averages indicated by the same letter (p ≤ 0.05).
Early stage (May) application effect on photosynthetic efficiency index and chlorophyll
Applying Bc, Trichoderma and AMF at different rates also increased photosynthetic efficiency index (PEI) and chlorophyll content in sustainable agriculture (Table 3). The Th + Bc (3%) application produced the highest increase in photosynthetic efficiency index rate, nearly 60% higher than the control. Trichoderma and AMF alone raised PEI, but combinations were superior for chlorophyll content. Bc alone had little effect, especially at low levels, but Th + Bc (3%) and Bc (3%) + ERS produced significant differences (p ≤ 0.05). Combination treatments optimised PEI capacity and improved early PEI efficiency (Table 3).
Table 3.
Early-stage (May) PEI% and (r) and chlorophyll (SPAD) measurements in P. vera L. under AMF, Trichoderma and Bc applications.
| Treatments | PEI% | Photosynthetic efficiency index (r) | Chlorophyll (SPAD) |
|---|---|---|---|
| Control | 49.33 ± 2.33 e | 9.67 ± 0.88 b | 50.30 ± 7.09 c |
| Th | 71.95 ± 1.80 abc | 13.67 ± 0.33 a | 43.53 ± 0.97 abc |
| Bc (1%) | 69.57 ± 0.32 bc | 12.67 ± 1.45 ab | 34.77 ± 4.44 c |
| Bc (3%) | 71.37 ± 6.21 abc | 11.33 ± 1.20 ab | 42.30 ± 0.36 abc |
| ERS | 64.98 ± 1.34 c | 13.67 ± 0.33 a | 42.03 ± 1.80 abc |
| Th + Bc (1%) | 67.63 ± 2.33 cb | 12.33 ± 1.20 ab | 34.43 ± 0.70 c |
| Th + Bc (3%) | 79.27 ± 2.25 a | 10.33 ± 0.33 ab | 45.57 ± 0.98 ab |
| Bc (1%) + ERS | 69.93 ± 1.26 bc | 11.33 ± 0.67 ab | 39.13 ± 0.49 ab |
| Bc (3%) + ERS | 73.97 ± 0.64 ba | 11.33 ± 0.67 ab | 40.50 ± 1.16 ab |
| Th + ERS | 53.10 ± 0.46 e | 13.67 ± 2.03 a | 48.03 ± 0.44 ab |
1 AMF, arbuscular mycorrhizal fungi; Bc, biochar; ERS, commercial AMF (endo roots soluble); Pn (%), photosynthetic efficiency index rate; Pn (r), relative photosynthetic efficiency index measurement; PEI%, photosynthetic efficiency index (%); SE, standard error; Spad, chlorophyll content measurement (using Spad device); Th, T. harzianum Rifai KRL-AG2. Application averages were grouped at a 5% significance level according to Duncan’s multiple comparison test. There is no statistically significant difference between averages indicated by the same letter (p ≤ 0.05).
Early-stage (May) application effect on leaf colour parameters
Table 4 shows the effects of biostimulants on colour parameters (L, a and b). In leaf colour analysis, Bc had the greatest effect on a (red-green) and b (yellow-blue) indices. Bc (1%) and Bc (3%) enhanced photosynthetic efficiency by intensifying leaf colour, with significant differences compared to control and single applications (p ≤ 0.05). Trichoderma and AMF combinations improved colour indices moderately. The Bc + ERS combination gave more balanced and meaningful colour optimisation (Table 4).
Table 4.
AMF, Trichoderma and Bc applications on early-stage (May) leaf colour parameters (L, a, b) in P. vera L.
| Treatments | L | a | B |
|---|---|---|---|
| Control | 42.20 ± 1.44 a | –2.00 ± 0.16 a | 7.58 ± 0.97 b |
| Th | 42.61 ± 0.73 a | –3.90 ± 0.37 abc | 8.05 ± 0.09 ab |
| Bc (1%) | 45.22 ± 2.47 a | –5.10 ± 0.41 c | 13.27 ± 2.06 a |
| Bc (3%) | 43.22 ± 2.68 a | –4.30 ± 1.75 abc | 12.92 ± 2.69 ab |
| ERS | 47.11 ± 3.20 a | –3.50 ± 0.88 abc | 11.52 ± 2.12 ab |
| Th + Bc (1%) | 43.62 ± 0.19 a | –2.80 ± 0.46 abc | 9.90 ± 1.06 ab |
| Th + Bc (3%) | 44.17 ± 4.87 a | –4.70 ± 1.01 bc | 12.44 ± 1.90 ab |
| Bc (1%) + ERS | 46.67 ± 0.17 a | –2.30 ± 0.43 ab | 11.63 ± 0.67 ab |
| Bc (3%) + ERS | 47.60 ± 3.13 a | –2.30 ± 0.30 ab | 8.96 ± 1.41 ab |
| Th + ERS | 44.71 ± 3.07 a | –3.00 ± 0.53 abc | 9.30 ± 1.23 ab |
1 AMF, arbuscular mycorrhizal fungi; Bc, biochar; ERS, commercial AMF (endo roots soluble); SE, standard error; Th, T. harzianum Rifai KRL–AG2. Application averages were grouped at a 5% significance level according to Duncan’s multiple comparison test. There is no statistically significant difference between averages indicated by the same letter (p ≤ 0.05).
Early-stage (May) application effect on leaf nutrient content
Table 5 shows the effect of AMF, Trichoderma and Bc at different rates on the nitrogen (N), phosphorus (P), potassium (K), magnesium (Mg) and calcium (Ca) nutrient elements in the leaves. In terms of the macro nutrient K (0.82%), a statistically significant increase was observed, particularly in the Th + Bc (1%) application (p ≤ 0.05). While Bc or AMF applications alone provided only limited increases, combinations showed consistent improvements across all macro elements. Although nitrate (N) content decreased in some applications, the K and P balance was maintained, particularly in the Th + Bc (1%) and Bc (3%) + ERS combinations (Table 5). A notable point in Table 5 is that the N and P elements were higher in the control group than in other applications, and the effectiveness of 3% Bc was greater than that of 1%. In addition, the positive effect of plant biostimulants on magnesium (Mg) and calcium (Ca) levels in pistachio tree leaves was demonstrated in the early season (May). Accordingly, Mg (1.91%) and Ca (2.94%) values were found to be statistically significantly higher in the Th + Bc (1%) combination compared to all other treatments (p < 0.05) (Table 5).
Table 5.
Early-stage (May) leaf macro-nutrient elements (nitrogen (N), phosphorus (P), potassium (K), magnesium (Mg) and calcium (Ca)) in P. vera L. under AMF, Trichoderma and Bc applications.
| Treatments | N (%) | P (%) | K (%) | Mg (%) | Ca (%) |
|---|---|---|---|---|---|
| Control | 2.23 ± 0.01 a | 0.30 ± 0.01 a | 0.53 ± 0.02 c | 0.57 ± 0.01 e | 2.70 ± 0.01 b |
| Th | 0.86 ± 0.02 cd | 0.12 ± 0.01 e | 0.58 ± 0.01 b | 1.56 ± 0.02 c | 2.20 ± 0.02 gğ |
| Bc (1%) | 1.07 ± 0.02 b | 0.15 ± 0.01 de | 0.59 ± 0.01 b | 1.61 ± 0.02 b | 2.33 ± 0.01 de |
| Bc (3%) | 0.65 ± 0.04 f | 0.17 ± 0.01 bcd | 0.61 ± 0.01 b | 1.51 ± 0.02 cd | 2.24 ± 0.03 fg |
| ERS | 0.79 ± 0.03 de | 0.20 ± 0.01 b | 0.50 ± 0.02 cd | 1.52 ± 0.01 cd | 2.37 ± 0.01 d |
| Th + Bc (1%) | 0.76 ± 0.02 e | 0.17 ± 0.01 bcd | 0.82 ± 0.01 a | 1.91 ± 0.01 a | 2.94 ± 0.02 a |
| Th + Bc (3%) | 0.79 ± 0.03 de | 0.19 ± 0.01 bc | 0.46 ± 0.02 d | 1.48 ± 0.01 d | 2.12 ± 0.02 h |
| Bc (1%) + ERS | 0.33 ± 0.02 g | 0.15 ± 0.01 de | 0.58 ± 0.01 b | 1.52 ± 0.01 cd | 2.55 ± 0.02 c |
| Bc (3%) + ERS | 0.89 ± 0.05 c | 0.16 ± 0.01 cde | 0.46 ± 0.01 d | 1.50 ± 0.01 cd | 2.29 ± 0.02 ef |
| Th + ERS | 0.60 ± 0.02 f | 0.17 ± 0.01 bcd | 0.47 ± 0.01 d | 1.52 ± 0.02 cd | 2.18 ± 0.01 ğh |
1 AMF, arbuscular mycorrhizal fungi; Bc, biochar; ERS, commercial AMF (endo roots soluble); SE, standard error; Th, T. harzianum Rifai KRL-AG2. Application averages were grouped at a 5% significance level according to Duncan’s multiple comparison test. There is no statistically significant difference between averages indicated by the same letter (p ≤ 0.05).
Plant biostimulants had a positive effect on the levels of iron (Fe), copper (Cu), manganese (Mn) and zinc (Zn) in pistachio tree leaves. While Bc (3%) alone resulted in a significant increase in Fe content (2.01 mg · kg−1), combination treatments provided a balanced increase in nutrient elements and created a significant difference compared to the control group (p ≤ 0.05). It was determined that combinations, rather than single applications, were the most effective in supporting the plant’s nutritional status and photosynthetic capacity during early stages (Table 6). In particular, the Th + Bc (3%) application significantly increased Cu (0.28 mg · kg−1) and Mn (0.59 mg · kg−1) content. However, the highest value for the Mn nutrient element was observed in the Bc (3%) application (0.70 mg · kg−1 Mn). Zn showed the highest values, particularly in the control, Bc (%) and Bc (3%) + ERS applications (Table 6).
Table 6.
Early-stage (May) foliar micronutrients (iron (Fe), copper (Cu), manganese (Mn) and zinc (Zn)) in P. vera L. under AMF, Trichoderma and Bc applications.
| Treatments | Fe (mg · kg−1) | Cu (mg · kg−1) | Mn (mg · kg−1) | Zn (mg · kg−1) |
|---|---|---|---|---|
| Control | 1.34 ± 0.02 g | 0.20 ± 0.01 d | 0.39 ± 0.01 e | 0.11 ± 0.01 a |
| Th | 1.60 ± 0.01 e | 0.23 ± 0.01 cd | 0.46 ± 0.02 d | 0.09 ± 0.01 ab |
| Bc (1%) | 1.66 ± 0.02 d | 0.24 ± 0.01 bc | 0.60 ± 0.01 c | 0.08 ± 0.01 b |
| Bc (3%) | 2.01 ± 0.04 a | 0.22 ± 0.01 cd | 0.70 ± 0.01 a | 0.11 ± 0.01 a |
| ERS | 1.83 ± 0.02 c | 0.25 ± 0.01 abc | 0.66 ± 0.02 ab | 0.10 ± 0.01 ab |
| Th + Bc (1%) | 1.91 ± 0.01 b | 0.24 ± 0.01 bc | 0.63 ± 0.01 bc | 0.10 ± 0.01 ab |
| Th + Bc (3%) | 1.53 ± 0.01 f | 0.28 ± 0.01 a | 0.59 ± 0.02 c | 0.08 ± 0.01 b |
| Bc (1%) + ERS | 1.88 ± 0.02 de | 0.28 ± 0.01 ab | 0.63 ± 0.01 bc | 0.10 ± 0.01 ab |
| Bc (3%) + ERS | 1.61 ± 0.01 de | 0.24 ± 0.01 bc | 0.62 ± 0.02 bc | 0.11 ± 0.01 a |
| Th + ERS | 1.59 ± 0.02 e | 0.28 ± 0.01 ab | 0.58 ± 0.01 c | 0.09 ± 0.01 ab |
1 AMF, arbuscular mycorrhizal fungi; Bc, biochar; ERS, commercial AMF (endo roots soluble); SE, standard error; Th, T. harzianum Rifai KRL-AG2. Application averages were grouped at a 5% significance level according to Duncan’s multiple comparison test. There is no statistically significant difference between averages indicated by the same letter (p ≤ 0.05).
Early-stage (May) application effect on soil properties and AMF spore density
Soil pH values varied slightly depending on the application, while EC values decreased significantly, particularly with the Bc (1%) and Bc (3%) combinations. AMF soil spore density reached the highest value in the Bc (3%) + ERS (10.00 units) application compared to the control and other applications and showed a statistically significant difference (p ≤ 0.05). The lowest AMF soil spore density was observed in the control group (3.67 units), and it was determined that the spore count decreased in the combination with Trichoderma (7.67 units) compared to the single application (8.33 units). It was determined that combination applications optimised both plant growth and soil microbial health (Table 7).
Table 7.
Early-stage (May) soil pH, soil EC and AMF soil spore density in P. vera L. under AMF, Trichoderma and Bc applications.
| Treatments | Soil pH (mS · cm−1) | Soil EC (dS · m−1) | AMF soil spore density (number) |
|---|---|---|---|
| Control | 7.25 ± 0.03 bc | 2.55 ± 0.01 a | 3.67 ± 0.05 d |
| Th | 7.32 ± 0.03 b | 1.54 ± 0.01 b | NA |
| Bc (1%) | 7.32 ± 0.03 b | 1.02 ± 0.01 c | NA |
| Bc (3%) | 7.33 ± 0.03 b | 1.03 ± 0.01 c | NA |
| ERS | 7.21 ± 0.03 bc | 1.84 ± 0.01 ab | 8.33 ± 0.05 b |
| Th + Bc (1%) | 7.38 ± 0.03 ab | 1.01 ± 0.01 c | NA |
| Th + Bc (3%) | 7.39 ± 0.03 ab | 1.03 ± 0.01 c | NA |
| Bc (1%) + ERS | 7.39 ± 0.03 ab | 1.92 ± 0.01 ab | 9.00 ± 0.05 ab |
| Bc (3%) + ERS | 7.41 ± 0.03 a | 1.93 ± 0.01 ab | 10.00 ± 0.05 a |
| Th + ERS | 6.92 ± 0.03 c | 1.45 ± 0.01 b | 7.67 ± 0.05 c |
1 AMF, arbuscular mycorrhizal fungi; Bc, biochar; EC, electrical conductivity; ERS, commercial AMF (endo roots soluble); NA, not assessed; SE, standard error; Th, T. harzianum Rifai KRL-AG2. Application averages were grouped at a 5% significance level according to Duncan’s multiple comparison test. There is no statistically significant difference between averages indicated by the same letter (p ≤ 0.05).
Late-stage (September) shoot and vegetative parameters
The late-season (September) growth parameters of P. vera L. showed significant differences among treatments (p ≤ 0.05) (Table 8). The highest shoot length was recorded in the Bc (3%) + ERS treatment (212.33 cm), representing a 46% increase compared to the control group (145.33 cm), while the lowest value was observed in the control group. Stem diameter was highest in the Th + Bc (1%) treatment (37.38 mm), closely followed by the Bc (3%) + ERS treatment (37.16 mm), corresponding to increases of 35.7% and 34.9%, respectively, compared to the control group (27.55 mm); while the lowest values were again observed in the control group. The number of branches was highest in the Th + Bc (1%) treatment (60.67), showing a 379.0% increase compared to the control group (12.67), while the lowest number was recorded in the control treatment. Similarly, the number of vegetative buds showed a significant increase in the Bc (3%) + ERS treatment (100.67) compared to the control (27.67), while the minimum value was found in the control group (Table 8). For all parameters, combined treatments generally exhibited higher values compared to single treatments; Bc (3%) + ERS and Th + Bc (1%) stood out as the treatments showing the highest measurements, while the control consistently yielded the lowest values (Table 8).
Table 8.
Late-stage (September) (May) shoot length (cm), stem diameter (mm), number of branches (number) and number of vegetative buds (number) measurements in P. vera L. under AMF, Trichoderma and Bc applications.
| Treatments | Shoot length (cm) | Stem diameter (mm) | Number of branches (number) | Number of vegetative buds (number) |
|---|---|---|---|---|
| Control | 145.33 ± 3.18 c | 27.55 ± 0.84 c | 12.67 ± 0.88 g | 27.67 ± 2.03 f |
| Th | 178.00 ± 1.73 abc | 31.85 ± 1.14 bc | 18.67 ± 2.60 fg | 38.00 ± 4.04 ef |
| Bc (1%) | 146.67 ± 3.18 c | 30.44 ± 1.75 bc | 30.33 ± 1.76 ce | 57.67 ± 3.71 cd |
| Bc (3%) | 149.00 ± 14.73 c | 34.36 ± 1.63 ab | 48.67 ± 4.91 b | 62.67 ± 7.45 c |
| ERS | 191.00 ± 9.29 ab | 34.02 ± 3.49 ab | 28.33 ± 1.20 e | 47.00 ± 3.46 cde |
| Th + Bc (1%) | 205.00 ± 16.77 ab | 37.38 ± 0.88 a | 60.67 ± 3.76 a | 85.00 ± 10.02 b |
| Th + Bc (3%) | 181.67 ± 7.86 abc | 32.42 ± 1.48 abc | 31.00 ± 3.46 ce | 57.67 ± 4.10 cd |
| Bc (1%) + ERS | 195.67 ± 18.52 ab | 28.47 ± 1.03 c | 37.67 ± 0.88 c | 62.33 ± 2.03 c |
| Bc (3%) + ERS | 212.33 ± 15.34 a | 37.16 ± 1.05 a | 47.33 ± 1.20 b | 100.67 ± 2.73 a |
| Th + ERS | 172.00 ± 7.57 bc | 27.90 ± 0.73 c | 25.67 ± 0.88e f | 42.67 ± 5.24 def |
1 AMF, arbuscular mycorrhizal fungi; Bc, biochar; ERS, commercial AMF (endo roots soluble); SE, standard error; Th, T. harzianum Rifai KRL-AG2. Application averages were grouped at a 5% significance level according to Duncan’s multiple comparison test. There is no statistically significant difference between averages indicated by the same letter (p ≤ 0.05).
Late-stage (September) application effect on PEI and chlorophyll
The late-season (September) physiological parameters are presented in Table 9; the differences between treatments were statistically significant (p ≤ 0.05). The highest photosynthetic efficiency index rate (%) was determined in the Th + Bc (3%) treatment (80.90%), representing a 13.1% increase compared to the control (71.50%). The lowest photosynthetic efficiency index rate (%) values were observed in the ERS (67.63%) and Th + ERS (67.97%) treatments, with decreases of 5.4% and 4.9%, respectively. For the second PEI parameter (r), the highest values were observed in the ERS and Th + ERS treatments (17.67%), representing a 51.4% increase compared to the control (11.67%), while the lowest value was recorded in the control group.
Table 9.
Late-stage (September) PEI% and (r) and chlorophyll (SPAD) measurements in P. vera L. under AMF, Trichoderma, and Bc applications.
| Treatments | Photosynt (%) | Photosynt (r) | Chlorophyll (SPAD) |
|---|---|---|---|
| Control | 71.50 ± 0.76 ab | 11.67 ± 0.33 c | 52.47 ± 6.67 a |
| Th | 76.88 ± 0.42 ab | 16.67 ± 0.88 ab | 45.07 ± 0.58 abc |
| Bc (1%) | 72.37 ± 0.69 ab | 16.67 ± 0.33 ab | 37.53 ± 3.67 cd |
| Bc (3%) | 74.48 ± 6.10 ab | 16.00 ± 0.58 ab | 43.43 ± 0.59 bcd |
| ERS | 67.63 ± 1.04 b | 17.67 ± 0.88 a | 43.61 ± 1.71 bcd |
| Th + Bc (1%) | 69.93 ± 2.50 b | 14.67 ± 1.45 b | 36.01 ± 0.37 d |
| Th + Bc (3%) | 80.90 ± 1.76 a | 14.67 ± 0.33 b | 46.90 ± 0.81 ab |
| Bc (1%) + ERS | 71.13 ± 1.27 b | 15.33 ± 0.67 ab | 41.47 ± 0.66 bcd |
| Bc (3%) + ERS | 77.07 ± 0.35 ab | 15.67 ± 0.88 ab | 41.47 ± 1.07 bcd |
| Th + ERS | 67.97 ± 5.66 b | 17.67 ± 0.67 a | 49.33 ± 0.67 ab |
1 AMF, arbuscular mycorrhizal fungi; Bc, biochar; ERS, commercial AMF (endo roots soluble); Pn (%), photosynthetic efficiency index rate; Pn (r), relative photosynthetic efficiency index measurement; PEI%, photosynthetic efficiency index (%); SE, standard error; Spad, chlorophyll content measurement (using Spad device); Th, T. harzianum Rifai KRL-AG2. Application averages were grouped at a 5% significance level according to Duncan’s multiple comparison test. There is no statistically significant difference between averages indicated by the same letter (p ≤ 0.05).
Chlorophyll content (SPAD) reached its highest value (52.47) in the control treatment, while the lowest value was recorded in the Th + Bc (1%) treatment (36.01), representing a 31.4% decrease compared to the control. Among the combined treatments, the Th + Bc (3%) and Th + ERS treatments showed relatively higher chlorophyll values (46.90 and 49.33, respectively), but neither exceeded the control. Overall, the highest values for PEI% and PEI (r) were obtained from the Th + Bc (3%) and ERS-based treatments, respectively, while the lowest values for most parameters were associated with the ERS, Th + ERS, or Th + Bc (1%) treatments, depending on the variable under examination (Table 9).
Late-stage (September) application effect on leaf colour parameters
Although numerical differences were observed in late-season (September) leaf colour parameters (L, a, b), L values did not show statistically significant variation among treatments (all were grouped in the same significance class, p > 0.05) (Table 10). The highest L value was recorded in the ERS treatment (48.51), representing a 9.9% increase compared to the control (44.14), while the lowest value was observed in the control group. For the parameter, the most negative (lowest) value was obtained in Bc (1%) (–5.70), indicating a significant decrease compared to the control (–2.21), while the highest (least negative) value was recorded in the control. Regarding the b parameter, the highest value was found in Bc (1%) at 14.22, corresponding to a 73.8% increase compared to the control (8.18), while the lowest value was again observed in the control treatment. Among the combined treatments, those containing Th + Bc (3%) and ERS generally showed intermediate values for all colour parameters. Overall, Bc (1%) exhibited the most pronounced changes in both a and b values, while the control consistently showed the lowest b and highest a values, and no statistically significant differences were found in L values among the treatments (p > 0.05).
Table 10.
AMF, Trichoderma and Bc applications on late-stage (September) leaf colour parameters (L, a, b) in P. vera L.
| Treatments | L | a | b |
|---|---|---|---|
| Control | 44.14 ± 1.22 a | –2.21 ± 0.12 a | 8.18 ± 1.09 c |
| Th | 44.22 ± 0.65 a | –4.32 ± 0.45 abc | 8.70 ± 0.25 bc |
| Bc (1%) | 47.11 ± 3.02 a | –5.70 ± 0.35 c | 14.22 ± 2.14 a |
| Bc (3%) | 45.00 ± 2.45 a | –4.42 ± 1.72 abc | 14.07 ± 2.18 a |
| ERS | 48.51 ± 3.32 a | –4.15 ± 0.93 abc | 13.05 ± 1.59 ab |
| Th + Bc (1%) | 45.42 ± 0.40 a | –3.19 ± 0.53 abc | 10.78 ± 1.08 abc |
| Th + Bc (3%) | 45.70 ± 4.37 a | –5.04 ± 1.00 bc | 13.24 ± 1.96 ab |
| Bc (1%) + ERS | 48.19 ± 0.51 a | –2.51 ± 0.35 ab | 12.40 ± 0.53 abc |
| Bc (3%) + ERS | 48.38 ± 3.20 a | –2.73 ± 0.34 ab | 9.95 ± 1.27 abc |
| Th + ERS | 45.70 ± 3.02 a | –3.49 ± 0.62 abc | 9.87 ± 1.13 abc |
1 AMF, arbuscular mycorrhizal fungi; Bc, biochar; ERS, commercial AMF (endo roots soluble); SE, standard error; Th, T. harzianum Rifai KRL-AG2. Application averages were grouped at a 5% significance level according to Duncan’s multiple comparison test. There is no statistically significant difference between averages indicated by the same letter (p ≤ 0.05).
Late-stage (September) application effect on leaf nutrient content
At the end of the season (September), statistically significant differences were observed among the treatments in leaf macronutrient content (N, P, K, Ca and Mg) (p ≤ 0.05) (Table 11). The highest nitrogen (N) content was recorded in the Bc (1%) treatment (1.11%), a 19.4% increase compared to the control group (0.93%), while the lowest value was observed in the Bc (1%) + ERS treatment (0.37%), a 60.2% decrease compared to the control group. For phosphorus (P), the control treatment had the highest value (0.32%), whereas Th had the lowest (0.15%), representing a 53.1% decrease compared to the control group. Potassium (K) content was highest in the Th + Bc (1%) treatment (0.85%), corresponding to a 46.6% increase compared to the control group (0.58%), while the lowest value was recorded in the Bc (3%) + ERS treatment (0.48%). Overall, the highest N, P and K values were obtained from the Bc (1%), control and Th + Bc (1%) treatments, respectively, while the lowest values were associated with the Bc (1%) + ERS (N), Th (P) and Bc (3%) + ERS (K) treatments (Table 11). The highest magnesium (Mg) content was determined in the Th + Bc (1%) treatment (1.94%), showing a significant increase compared to the control (0.60%). Additionally, the lowest Mg value was recorded in the control treatment. The calcium (Ca) content was highest in the Th + Bc (1%) treatment (2.97%), corresponding to a 9.2% increase compared to the control (2.72%), while the lowest value was observed in the Th + Bc (3%) treatment (2.17%), showing a 20.2% decrease compared to the control (Table 11).
Table 11.
Late-stage (September) leaf macro-nutrient elements (nitrogen (N), phosphorus (P), potassium (K), magnesium (Mg) and calcium (Ca)) in P. vera L. under AMF, Trichoderma and Bc applications.
| Treatments | N (%) | P (%) | K (%) | Mg (%) | Ca (%) |
|---|---|---|---|---|---|
| Control | 0.93 ± 0.68 ab | 0.32 ± 0.01 a | 0.58 ± 0.02 c | 0.60 ± 0.01 e | 2.72 ± 0.01 b |
| Th | 0.92 ± 0.01 ab | 0.15 ± 0.01 f | 0.61 ± 0.01 bc | 1.58 ± 0.02 c | 2.23 ± 0.02 g |
| Bc (1%) | 1.11 ± 0.01 a | 0.19 ± 0.01 cde | 0.61 ± 0.01 bc | 1.63 ± 0.02 b | 2.37 ± 0.01 de |
| Bc (3%) | 0.71 ± 0.02 ab | 0.19 ± 0.01 cde | 0.64 ± 0.01 b | 1.55 ± 0.02 cd | 2.31 ± 0.03 f |
| ERS | 0.84 ± 0.02 ab | 0.22 ± 0.01 b | 0.52 ± 0.02 d | 1.55 ± 0.01 cd | 2.40 ± 0.01 d |
| Th + Bc (1%) | 0.81 ± 0.01 ab | 0.20 ± 0.01 cd | 0.85 ± 0.01 a | 1.94 ± 0.01 a | 2.97 ± 0.01 a |
| Th + Bc (3%) | 0.83 ± 0.02 ab | 0.21 ± 0.01 bc | 0.49 ± 0.01 d | 1.52 ± 0.01 d | 2.17 ± 0.01 ğ |
| Bc (1%) + ERS | 0.37 ± 0.02 b | 0.17 ± 0.01 ef | 0.62 ± 0.02 b | 1.57 ± 0.02 cd | 2.61 ± 0.02 c |
| Bc (3%) + ERS | 0.94 ± 0.04 ab | 0.19 ± 0.01 de | 0.48 ± 0.01 d | 1.54 ± 0.02 cd | 2.33 ± 0.02 ef |
| Th + ERS | 0.64 ± 0.02 ab | 0.20 ± 0.01 bcd | 0.50 ± 0.01 d | 1.55 ± 0.02 cd | 2.22 ± 0.01 g |
1 AMF, arbuscular mycorrhizal fungi; Bc, biochar; ERS, commercial AMF (endo roots soluble); SE, standard error; Th, T. harzianum Rifai KRL-AG2. Application averages were grouped at a 5% significance level according to Duncan’s multiple comparison test. There is no statistically significant difference between averages indicated by the same letter (p ≤ 0.05).
In the late season (September), the micronutrient content of the leaves (Fe, Cu, Mn and Zn) showed statistically significant differences between treatments (p ≤ 0.05), as shown in Table 12. For iron (Fe), the highest value was determined in the Bc (3%) treatment (2.05 mg/kg), a 49.6% increase compared to the control (1.37 mg · kg−1), while the lowest value was detected in the control treatment. The highest copper (Cu) content was observed in the Th + Bc (3%) and Bc (1%) + ERS treatments (0.31 mg · kg−1), a 34.8% increase compared to the control (0.23 mg · kg−1), while the lowest value was observed in the control group. For manganese (Mn), the highest values were determined in the Bc (3%) and ERS treatments (0.73 mg · kg−1 and 0.70 mg · kg−1, respectively), corresponding to increases of 73.8% and 66.7% compared to the control (0.42 mg · kg−1), while the lowest value was recorded in the control group. Zinc (Zn) content reached its highest value in the control treatment (0.14 mg · kg−1), while the lowest values were observed in Bc (1%), Th + Bc (3%), Bc (1%) + ERS and Th + ERS (0.10 mg/kg), representing a 28.6% decrease compared to the control. Among the combined treatments, Th + Bc (3%) and Bc (1%) + ERS showed the highest Cu values, while Bc (3%) had the highest Mn content. Overall, the control consistently exhibited the lowest Cu and Mn values among all treatments, but the highest Zn content (Table 12).
Table 12.
Late-stage (September) foliar micronutrients (iron (Fe), copper (Cu), manganese (Mn) and zinc (Zn)) in P. vera L. under AMF, Trichoderma and Bc applications.
| Treatments | Fe (mg · kg−1) | Cu (mg · kg−1) | Mn (mg · kg−1) | Zn (mg · kg−1) |
|---|---|---|---|---|
| Control | 1.37 ± 0.02 g | 0.23 ± 0.01 d | 0.42 ± 0.01 e | 0.14 ± 0.01 a |
| Th | 1.62 ± 0.01 ef | 0.25 ± 0.01 cd | 0.50 ± 0.01 d | 0.11 ± 0.01 ab |
| Bc (1%) | 1.70 ± 0.01 d | 0.27 ± 0.00 c | 0.64 ± 0.01 bc | 0.10 ± 0.01 b |
| Bc (3%) | 2.05 ± 0.03 a | 0.25 ± 0.01 cd | 0.73 ± 0.01 a | 0.12 ± 0.01 ab |
| ERS | 1.87 ± 0.01 c | 0.28 ± 0.01 bc | 0.70 ± 0.01 a | 0.12 ± 0.01 ab |
| Th + Bc (1%) | 1.95 ± 0.01 b | 0.26 ± 0.01 c | 0.66 ± 0.02 b | 0.11 ± 0.01 ab |
| Th + Bc (3%) | 1.58 ± 0.01 f | 0.31 ± 0.00 a | 0.62 ± 0.02 bc | 0.10 ± 0.01 b |
| Bc (1%) + ERS | 1.91 ± 0.01 bc | 0.31 ± 0.01 a | 0.65 ± 0.01 b | 0.10 ± 0.01 b |
| Bc (3%) + ERS | 1.63 ± 0.01 e | 0.26 ± 0.01 c | 0.64 ± 0.01 bc | 0.12 ± 0.01 ab |
| Th + ERS | 1.62 ± 0.01 ef | 0.30 ± 0.01 ab | 0.61 ± 0.01 c | 0.10 ± 0.01 b |
1 AMF, arbuscular mycorrhizal fungi; Bc, biochar; ERS, commercial AMF (endo roots soluble); SE, standard error; Th, T. harzianum Rifai KRL-AG2.Application averages were grouped at a 5% significance level according to Duncan’s multiple comparison test. There is no statistically significant difference between averages indicated by the same letter (p ≤ 0.05).
Late-stage (September) application effect on soil properties and AMF spore density
In the late-season (September) soil properties and AMF spore density parameters, the differences between treatments were statistically significant (p ≤ 0.05). The highest soil pH value was recorded in the Bc (3%) + ERS treatment (7.41), representing a 1.8% increase compared to the control (7.28). The lowest soil pH value was observed in the Th + ERS combination (6.92), representing a 4.9% decrease compared to the control. Soil EC reached its highest value in the control treatment (2.56 dS · m−1), while the lowest value was observed in the Th + Bc (1%) treatment (1.02 dS · m−1), representing a 60.2% decrease compared to the control. AMF soil spore density was highest in the ERS and Bc (3%) + ERS treatments (17.00), representing increase compared to the control (3.67), while the lowest value was recorded in the control treatment. Among the combined treatments, Bc (3%) + ERS exhibited the highest pH and spore density values, while Th + Bc (1%) had the lowest EC value. Overall, the control group consistently showed the highest EC and the lowest spore density, while treatments containing ERS had the highest AMF spore densities (Table 13).
Table 13.
Late-stage (September) soil pH, soil EC and AMF soil spore density in P. vera L. under AMF, Trichoderma and Bc applications.
| Treatments | Soil pH (mS · cm−1) | Soil EC (dS · m−1) | AMF soil spore density (number) |
|---|---|---|---|
| Control | 7.28 ± 0.03 bc | 2.56 ± 0.01 a | 3.67 ± 0.05 c |
| Th | 7.30 ± 0.03 b | 1.55 ± 0.01 b | NA |
| Bc (1%) | 7.32 ± 0.03 b | 1.03 ± 0.01 c | NA |
| Bc (3%) | 7.33 ± 0.03 b | 1.04 ± 0.01 c | NA |
| ERS | 7.22 ± 0.03 bc | 1.86 ± 0.01 ab | 17.00 ± 0.05 a |
| Th + Bc (1%) | 7.38 ± 0.03 ab | 1.02 ± 0.01 c | NA |
| Th + Bc (3%) | 7.39 ± 0.03 ab | 1.04 ± 0.01 c | NA |
| Bc (1%) + ERS | 7.40 ± 0.03 ab | 1.93 ± 0.01 ab | 16.67 ± 0.05 ab |
| Bc (3%) + ERS | 7.41 ± 0.03 a | 1.94 ± 0.01 ab | 17.00 ± 0.05 a |
| Th + ERS | 6.92 ± 0.03 c | 1.46 ± 0.01 b | 13.67 ± 0.05 b |
1 AMF, arbuscular mycorrhizal fungi; Bc, biochar; EC, electrical conductivity; ERS, commercial AMF (endo roots soluble); NA, not assessed; SE, standard error; Th, T. harzianum Rifai KRL-AG2. Application averages were grouped at a 5% significance level according to Duncan’s multiple comparison test. There is no statistically significant difference between averages indicated by the same letter (p ≤ 0.05).
Discussion
Growth increases in young pistachio trees can be attributed to complementary interactions between Bc, T. harzianum and AMF. Specifically, the responses observed in the Th + Bc (1%) and Bc (3%) + ERS treatments indicate that these combinations synergistically enhance plant growth. Combined use of T. harzianum and Bc has been shown to activate plant growth by increasing soil microbial activity (Ahmad et al., 2024), underscoring this interaction. These findings are consistent with the literature reporting that interactions between organic matter and beneficial microorganisms optimise plant development (Carillo et al., 2025). Pu et al. (2025) demonstrated that Bc-AMF combinations improve soil properties, promote root proliferation and encourage branching, partly through AMF-mediated hormone synthesis and delayed root senescence caused by Bc. The improvements in shoot development observed under combined applications are consistent with previous studies showing that Bc-microbe interactions enhance nutrient uptake and root function (Begum et al., 2019; Lehmann et al., 2021). The persistence of these effects into later growth stages suggests that early rhizosphere changes can translate into lasting growth advantages (Tang, 2025). Although Bc alone has limited effects at low doses, its interaction with Trichoderma or AMF may optimise photosynthetic performance through improved nutrient availability and root functionality, supported by significantly increased microbial activity and favourable rhizosphere conditions (Begum et al., 2019). Conversely, the reduction in spore density observed in Trichoderma-containing applications stems from potential microbial competition that influences colonisation dynamics in the rhizosphere (Kredics et al., 2024).
Physiological responses further underscore the importance of integrated applications. The increased photosynthetic performance observed in Bc-Trichoderma applications aligns with findings indicating that Bc enhances microbial activity and carbon assimilation efficiency (Güneş, 2026). Although chlorophyll content does not directly correlate with photosynthetic rate (Wang et al., 2025), this suggests that physiological efficiency may be regulated by factors beyond pigment concentration. Although overall L values remained constant, leaf colour parameters in the late growth stages were influenced by Bc applications; this indicates that Bc affects pigment composition without significantly altering leaf brightness (Ren et al., 2021).
Bc improves both nutrient availability and microbial activity by balancing the rhizosphere environment. The stability of soil pH throughout the experiment indicates that plant responses were primarily driven by biological and nutrient-related mechanisms. The variations in Bc effects may partly reflect the inherent variability in feedstock type and pyrolysis conditions frequently reported in the literature. Improvements in the utilisation of cations (K, Mg, Ca) and the contribution of microbial inoculants confirm the beneficial interactions between Bc and AMF reported in the literature (Egamberdieva et al., 2018; Javeed et al., 2022). Similarly, the positive trends observed in micronutrients, particularly iron and manganese, along with increased AMF spore density, indicate that Bc provides favourable conditions for microbial proliferation and nutrient availability (Pu et al., 2025). The observed decrease in EC reflects reduced salinity stress and improved soil physicochemical conditions (Zong et al., 2023), highlighting the role of biological processes in plant responses.
The observed decline in leaf nitrogen and phosphorus concentrations is best explained by a biomass dilution effect associated with increased vegetative growth rather than a reduction in nutrient uptake capacity (Sardans et al., 2017). In treatments where growth increased, the rise in structural biomass can lead to a relative decrease in nutrient concentrations, even if overall nutrient uptake remains constant or potentially increases. Additionally, changes in rhizosphere processes triggered by Bc and microbial inoculants—including nutrient immobilisation and redistribution—may contribute to these trends (Tang, 2025).
Overall, the results suggest that the combined use of Bc and microbial inoculants may contribute to the formation of a more stable rhizosphere environment, which is associated with the increased nutrient cycle efficiency and plant growth responses observed in this study. Under the conditions of this study, particularly in situations where the availability of nutrients and microbial activity play a key role, the use of Bc in combination with AMF and Trichoderma appears to be a potentially beneficial approach for improving soil–plant interactions.
CONCLUSIONS
In this study, combining Bc with beneficial microorganisms (AMF and Trichoderma) offers a sustainable strategy for improving soil health and accelerating the early establishment of pistachio trees. This approach also provides economic benefits and reduces dependence on synthetic fertilisers. The observed synergistic effects lay a foundation for optimising biostimulant applications and fostering resilient, productive orchards in different environments. It supports long-term soil functionality, advances ecologically sound management and offers a model for sustainable intensification in perennial cropping systems. This also guides future research towards scalable, high-impact interventions.
Notes
[14] Contributed by AUTHOR CONTRIBUTIONS
H.G. conceived the study and formulated the hypothesis. H.G., M.Y. and A.P. conducted the experiments. H.G. performed the statistical analyses. H.G., M.Y. and A.P. analysed and interpreted the data. All authors contributed to the writing and approved the final manuscript.
[15] Conflicts of interest CONFLICT OF INTEREST
The authors declare that they have no conflict of interest.
[16] AI DECLARATION
The author declares that generative artificial intelligence tools were used during the preparation of this manuscript for text drafting, language editing and refinement. All scientific interpretations, analyses and conclusions were critically reviewed and verified by the author. The author assumes full responsibility for the accuracy, integrity and scientific validity of all content produced with the assistance of these tools.
SUPPLEMENTARY MATERIALS
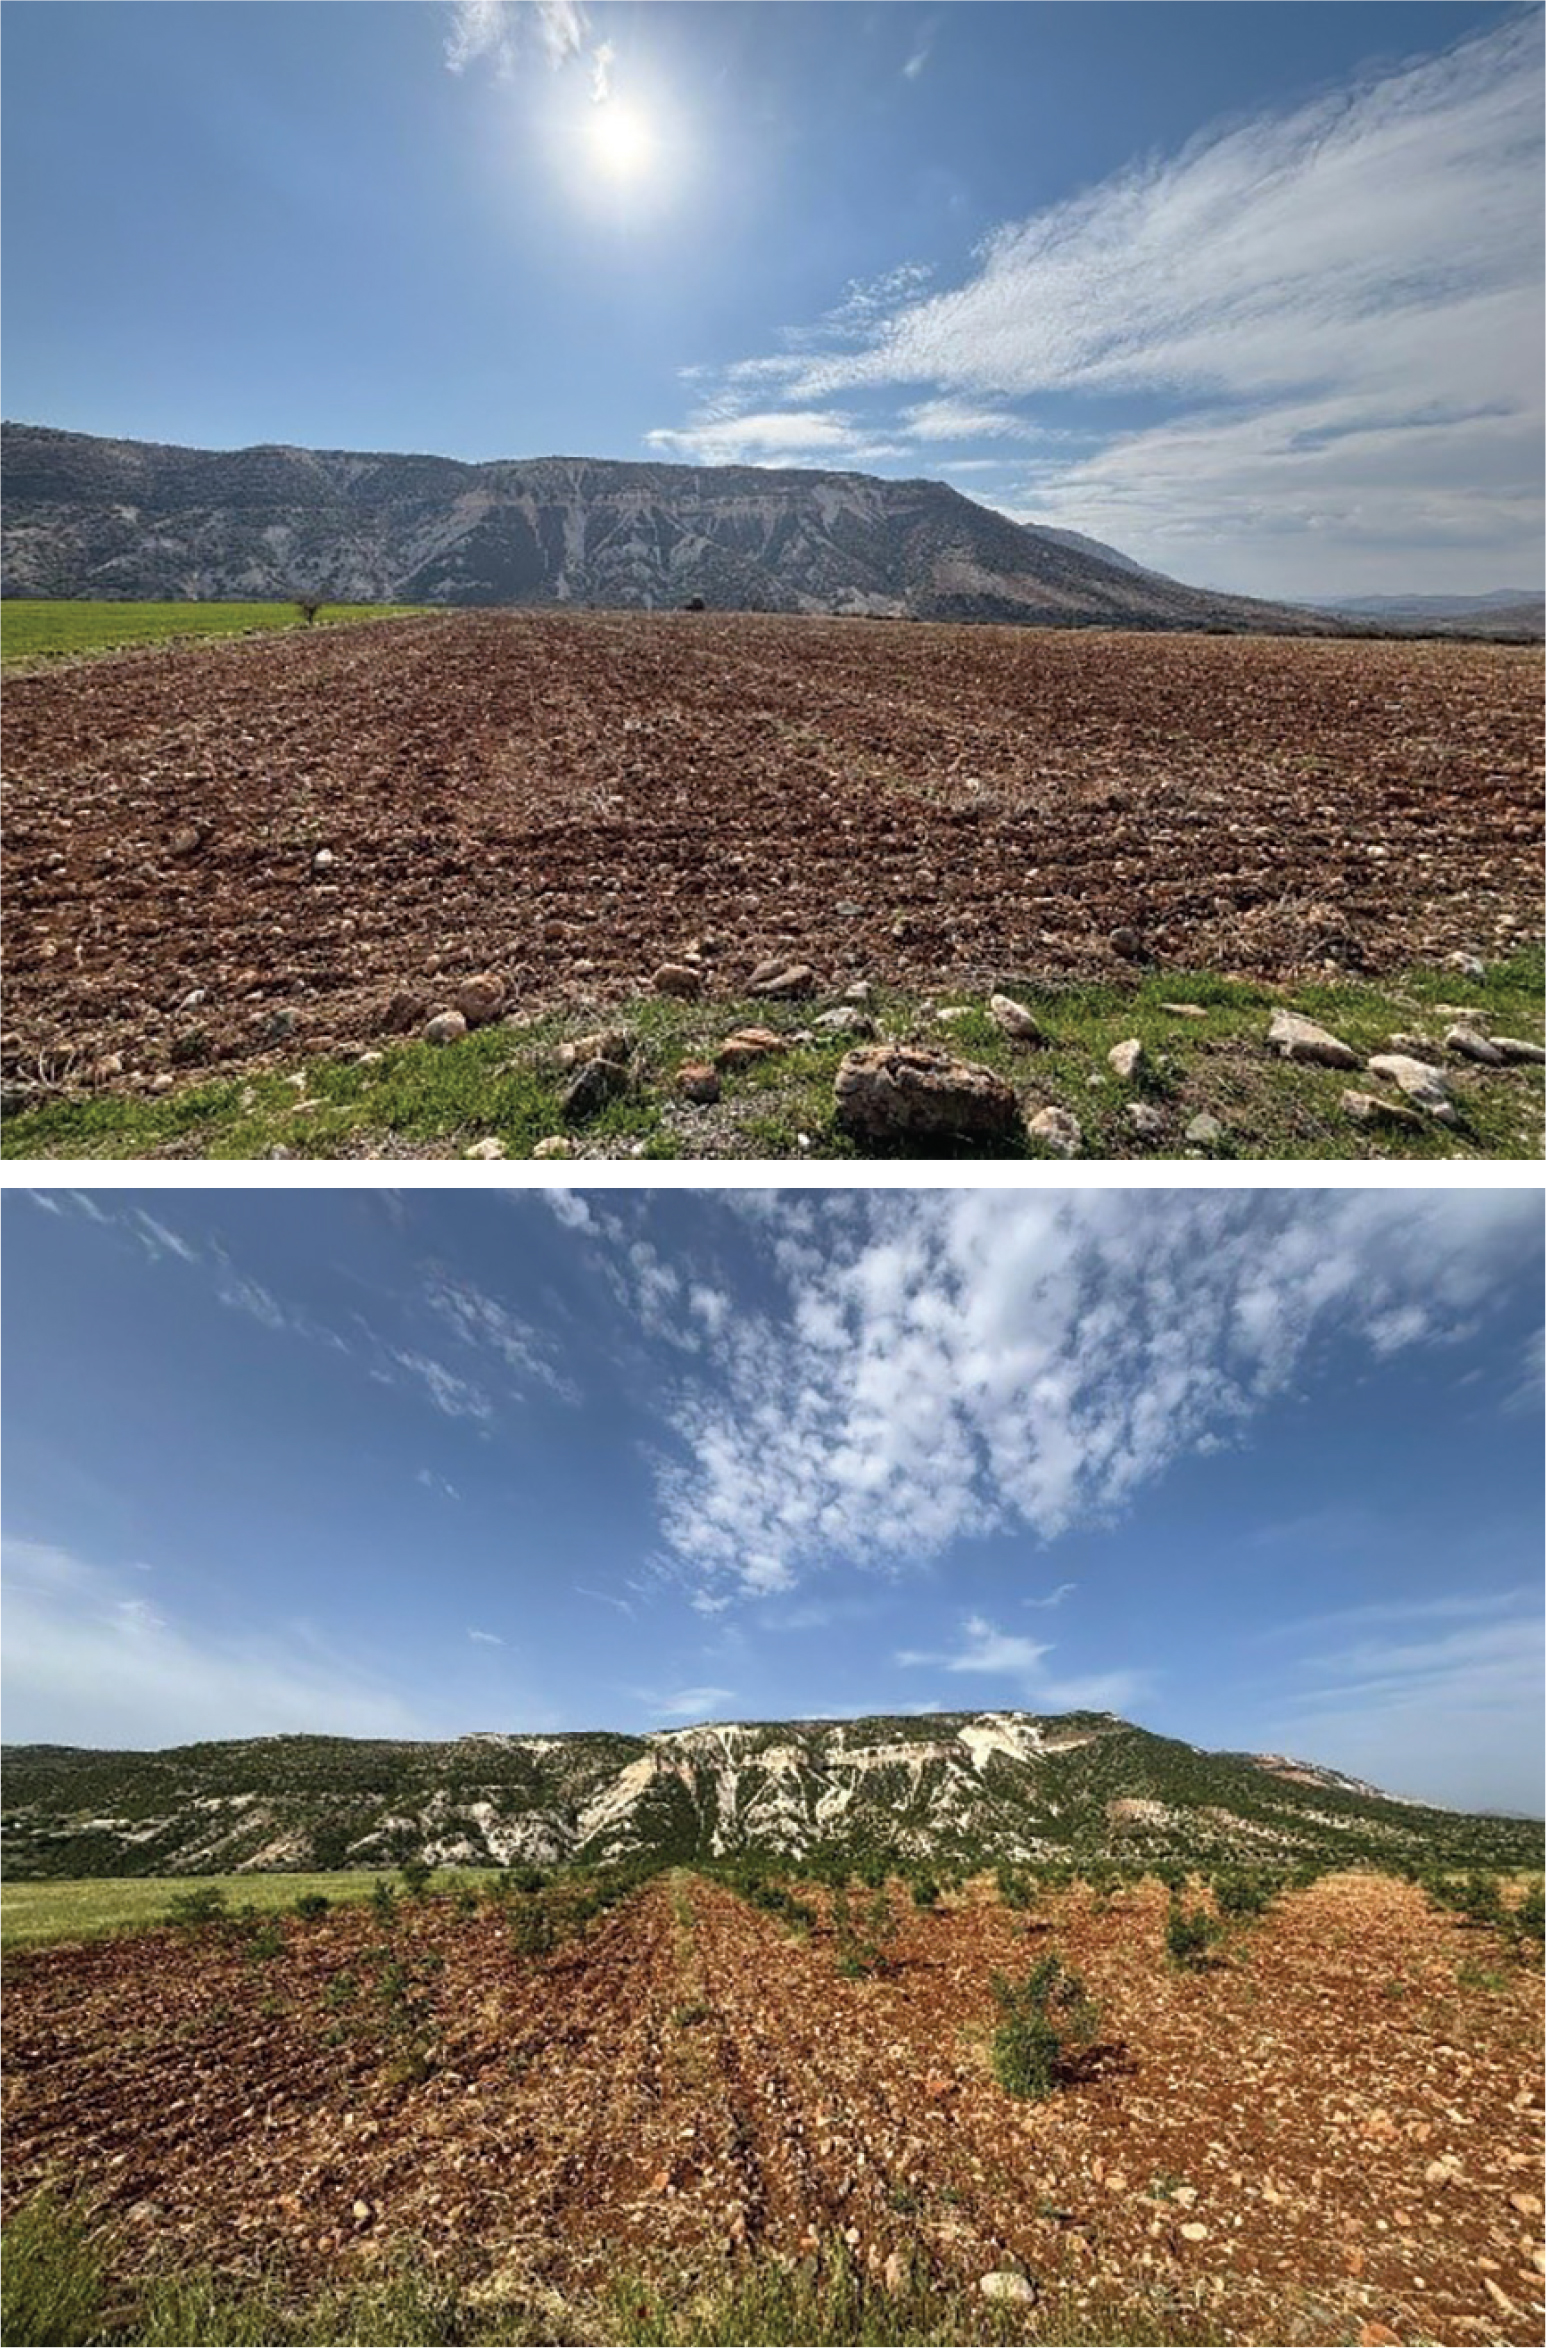
Supplementary Figure 1.
Land images reflecting the general view of the study area.