
INTRODUCTION
Microgreens, as they are known today, were popularised in San Francisco in the 1980s, initially by chefs in select restaurants. They are young plants harvested between the 1st and 3rd weeks of growth, typically reaching heights of 3–10 cm, with fully developed cotyledons or the first leaves (Paraschivu et al., 2021).
A wide range of species and cultivars can be grown as microgreens, including vegetables, ornamental plants and weeds. The choice of species depends on factors such as health safety, seed cost, availability, growth rate, sensory qualities and potential nutritional value. Brassicaceae species, particularly broccoli, mustard, radish, kale, and cress, are most commonly chosen, with other families like Amaranthaceae, Apiaceae, Cucurbitaceae and Lamiaceae also frequently used (Xiao et al., 2015; Caracciolo et al., 2020).
Microgreens are rich in elements, phytonutrients, primary and secondary metabolites, including chlorophyll, beta-carotene, vitamins and phenolic compounds. Many microgreens contain higher concentrations of these compounds than conventionally grown vegetables. This has been confirmed by multiple studies (Xiao et al., 2016; Lenzi et al., 2019; Kowitcharoen et al., 2021; Gupta et al., 2023; Viltres-Portales et al., 2024).
The short cultivation period of microgreens also means they require minimal space, substrates and water. Fertilisation is often unnecessary in standard production. Microgreens can be cultivated in densely populated areas, with options for soilless vertical farming, which optimises space and reduces costs (Paraschivu et al., 2021; Tilahun et al., 2023).
Over a quarter of the population suffers from nutrient deficiencies, including essential vitamins (e.g. vitamin A) and elements (e.g. zinc, iron, magnesium and iodine) (Shoeb and Hefferon, 2022). Biofortification offers a potential solution by enhancing nutrients in plants without compromising yield or quality (Dhaliwal et al., 2022). Biofortification methods include breeding, genetic manipulation, nanotechnology, green technologies and agronomic biofortification. Agronomic biofortification optimises fertilisation to increase nutrient accumulation in plant tissues (Yadav et al., 2022).
Soilless cultivation systems using nutrient solutions with precise compositions minimise environmental risks, such as nutrient leaching or soil contamination (D’Imperio et al., 2020; Renna et al., 2022), while also improving crop quality and offering a sustainable solution for microgreens cultivation. Studies on biofortification have focused mainly on vitamins C, iron, zinc, selenium and iodine (Puccinelli et al., 2019; Pannico et al., 2020; Sheikhi et al., 2024; Tavan et al., 2024).
Magnesium plays a crucial role in a wide range of biochemical processes in plants. It is a fundamental structural component of chlorophyll, acts as a cofactor for numerous enzymatic activities and is essential for protein synthesis. Additionally, Mg serves as a cofactor for enzymatic activities involving adenosine triphosphate, the primary energy source in cells (Chen et al., 2018; Wang et al., 2020a). High doses of fertilisers containing K+ and NH4+ exhibit strong antagonistic effects on Mg2+ uptake in plants, making them one of the primary causes of Mg deficiency in crops (Guo et al., 2015; Wang et al., 2020a).
Agronomic biofortification of microgreens with magnesium has not yet been a major focus of research. However, the effect of Mg application (50–300 mg · L1) on Mg content and other ions (Ca and P) in broccoli, radish, alfalfa and mung bean sprouts has been investigated. In that study, the sprouts were cultivated on filter paper and irrigated with an MgSO4 solution. All examined species were successfully enriched with Mg without adverse effects on K, Ca or P levels (Przybysz et al., 2015).
Germination rate, seedling growth and antioxidant activity were not affected in soybean sprouts treated with MgSO4 solutions at concentrations of 25–500 mg Mg · L−1. In this case, seeds were soaked in the respective solution for 2 hr, followed by 72 hr of germination in distilled water. This method could serve as an alternative to daily solution applications. However, the increase in Mg content in plants was only 20% and was observed solely at the two highest Mg concentrations (100 and 500 mg · L−1), with no significant difference between them (Chmielowska-Bąk et al., 2018).
An increase in Mg content may also be a secondary effect during the biofortification of microgreens with other ions. The application of 10 mg Se · L−1 increased Mg content in scallions by 61%, whereas the same concentration had no impact on Mg levels in coriander or basil (Newman et al., 2021).
Foliar application of Mg fertilisers is recommended for deficiency correction due to its immediate but non-residual effect; however, the required application rate of magnesium is contingent upon the specific demands of the crop and the prevailing nutrient status of the growth medium. (Adnan, 2020). The application of 150 mg Mg · L−1 nearly doubled the Mg content in onion compared with the control. However, it also negatively affected crop yield as well as Ca and K uptake. Consequently, the authors suggest using a concentration of 100 mg Mg · L−1, which enhances Mg accumulation in plants by 1.4-fold while simultaneously increasing yield by 38% (Kleiber et al., 2012).
In cauliflower, foliar Mg application improved the total yield and increased the vitamin C content in both leaves and heads (Ahmed et al., 2011). The beneficial effects of foliar Mg fertilisation on crop yield and quality have been further confirmed by additional studies (Zlámalová et al., 2015; Altarugio et al., 2017). Nevertheless, precise management of Mg biofortification is required, considering its interaction with Ca, as high Ca concentrations can inhibit Mg uptake by plants (Buturi et al., 2021). Magnesium fertilisation has been shown to significantly enhance the yield of fruits (by 13%), vegetables (by 9%) and cereals (by 8%) (Wang et al., 2020b).
The plant response to Mg application depends not only on the applied concentration but also on the chemical form of Mg. The efficiency of agronomic biofortification using magnesium chloride and magnesium sulphate (50–200 ppm) was assessed in green beans regarding bioactive compound content and antioxidant activity. The results indicated that plants treated with MgSO4 exhibited higher total flavonoid and anthocyanin contents, as well as greater antioxidant activity, compared with those treated with MgCl2. Based on these findings, the authors recommend 100 ppm MgSO4 as the most promising treatment (Ciscomani-Larios et al., 2021). Additionally, the application of 30 mM Mg in cucumber reduced the number of days to first flowering and fruit initiation, while increasing fruit length and total yield compared with the control. By contrast, a higher concentration of 50 mM Mg negatively affected these parameters (Siddique, 2017).
Magnesium, the fourth most abundant element in the human body, is essential for activating over 300 enzymes, supporting muscle and nerve function, maintaining healthy bone and tooth structure, and boosting the immune system. The recommended daily intake (RDI) is 420 mg for men and 320 mg for women (National Academies Press, 1997). Magnesium deficiency is common in developed countries (DiNicolantonio et al., 2018; Fiorentini et al., 2021). The depletion of magnesium in soils, due to poor agronomic practices, and food processing, which reduces magnesium content, is a primary cause of dietary deficiency. For example, processing grains into flour can decrease magnesium content by 82%–97% (Chaudhary et al., 2009; Louzada et al., 2015).
This study is among the first to focus on the agronomic biofortification of microgreens with magnesium. An experiment was conducted with six species (broccoli, mustard, cress, basil, sunflower and cucumber) using magnesium sulphate. The aim was to assess whether MgSO4 application effectively increases magnesium content in these species, making them potentially suitable dietary sources of this element. The impact of MgSO4 on some bioactive constituents and yield was also evaluated.
MATERIALS AND METHODS
Experimental design
Six plant species were used in the experiment. Three commonly used species in microgreens production from the Brassicaceae family were selected: cress (Lepidium sativum L. cv. ‘Dánská’), mustard (Sinapis alba L.) and broccoli (Brassica oleracea L. var. italica cv. ‘Limba’). Additionally, representatives from three other families were chosen: basil, Ocimum basilicum L. (Lamiaceae), sunflower, Helianthus annuus L. (Asteraceae) and cucumber, Cucumis sativus L. cv. ‘Othello’ F1 (Cucurbitaceae). Mustard, sunflower and basil were included in the study with no specific cultivars indicated. All seeds were purchased from MORAVOSEED CZ a.s. (Mikulov, CZ).
The plants were cultivated in a climate chamber at the Faculty of Horticulture, Mendel University in Brno. The phytotron FYTOSCOPE FS-SI-4600 was equipped with white light-emitting diode (LED), providing a photosynthetic photon flux density of 130 μmol · m−2 · s−1 and a measured light intensity of 7800 lux at plant height. The light period was set to 16/8 hr (day/night), with a temperature of 24/20°C and relative humidity ranging from 60 to 70%. The plants were grown in polypropylene trays measuring 15 × 11 × 5 cm. Laboratory filter paper (135 g · m−2) (Papírna Perštejn Ltd., Perštejn, Czech Republic) was used as the substrate in two layers. Sowing density was species-specific (Table 1).
Table 1.
Characteristics of the microgreens cultivation process depending on the species.
| Common name | Scientific name | Determined TSW (g) | Sowing rate per tray (g) | Number of seeds per cm2 | Number of days in darkness | Number of days in the light | Entire cultivation period in days |
|---|---|---|---|---|---|---|---|
| Cress | L. sativum L. | 2.4 | 3 | 7.6 | 2 | 5 | 7 |
| Mustard | S. alba L. | 5.8 | 7 | 7.3 | 3 | 3 | 6 |
| Broccoli | B. oleracea L. var. italica | 3.1 | 7 | 13.7 | 3 | 7 | 10 |
| Basil | O. basilicum L. | 1.5 | 3 | 12.1 | 3 | 3 | 6 |
| Sunflower | H. annuus L. | 60.9 | 18 | 1.8 | 4 | 5 | 9 |
| Cucumber | C. sativus L. | 22.8 | 6 | 1.6 | 3 | 8 | 11 |
The thousand seed weight (TSW) for each species was determined based on the weight of a sample of 100 seeds measured in three replicates. For each species, the sowing rate per tray was subsequently optimised to ensure uniform seed coverage of the substrate. Based on the seeding quantity, the density of seeds was then calculated.
For the first few days, the plants were covered with an opaque lid. The duration of coverage depended on the species, and the plants were uncovered once germination was complete and the cotyledons began to develop. Subsequently, they were covered with transparent trays until the end of cultivation (Table 1).
Six treatments of MgSO4 solution (10, 20, 30, 40 and 50 mg Mg · L−1) along with a control using distilled water were used for biofortification (Table 2). They were successively labelled as Mg1, Mg2, Mg3, Mg4, Mg5 and C (control). Each treatment was replicated five times (one tray per repetition), resulting in a total of 180 units (6 species × 6 treatments × 5 repetitions). Three of the most representative repetitions were then selected for further analysis.
Plant material and sample preparation
Based on previous experience with the tested seed material and under controlled cultivation conditions, including appropriate temperature and moisture management and avoidance of waterlogging, the seeds were not subjected to any chemical disinfection prior to sowing. Before sowing, 20 mL of the treatment solution was pipetted into each growing tray to pre-wet the filter paper. After sowing, seeds were irrigated with mechanical sprayers, and the dose applied was based on the specific needs of each species. Plants were irrigated once daily, approximately in the middle of the light period. The irrigation regime was adjusted for each species to prevent substrate desiccation before the next irrigation. Special attention was given to ensuring the maximum consistency of irrigation volume across treatments within each species. The total solution dose was then converted to the total magnesium supply to the plants (Table 3). For sunflower, seed coats were removed from the leaves 2 days before harvest. At harvest, all species had fully developed cotyledons and the first true leaves.
Table 3.
Total amount of magnesium applied per tray (mg) calculated based on the cultivation duration, irrigation requirements of each species and MgSO4 treatment.
| Cultivated species | Cultivation days | Treatment | ||||
|---|---|---|---|---|---|---|
| Mg1 | Mg2 | Mg3 | Mg4 | Mg5 | ||
| Cress | 7 | 1.01 | 2.03 | 3.04 | 4.05 | 5.07 |
| Mustard | 6 | 0.74 | 1.48 | 2.22 | 2.95 | 3.69 |
| Broccoli | 10 | 1.20 | 2.40 | 3.61 | 4.80 | 6.01 |
| Basil | 6 | 0.50 | 1.00 | 1.50 | 2.00 | 2.50 |
| Sunflower | 9 | 1.11 | 2.23 | 3.35 | 4.45 | 5.57 |
| Cucumber | 11 | 1.97 | 3.93 | 5.90 | 7.86 | 9.82 |
Fresh biomass and dry matter
The above-ground plant parts were separated from the substrate at a height of a few millimetres using sharp blades. For cress, mustard and basil, the entire plants, including the roots, were harvested due to their delicate root systems. Harvested plants were weighed to determine fresh yield per square metre (g · m−2) and per gram of seed (g · g−1 seed). Samples from each repetition were used for gravimetric dry matter determination following Zbíral (2005). These samples were dried for 4 hr at 105°C in a hot air steriliser (STERIMAT 574.2, BMT Medical Technology Ltd., Brno, Czech Republic). All determinations were performed in triplicate, and dry matter content was expressed as a percentage (% FW).
Ascorbic acid
Ascorbic acid was determined by high-performance liquid chromatography (HPLC) following sample preparation (Arya et al., 2000). A reversed-phase (RP) mode was used, with detection in the ultraviolet region. A fresh sample (5–10 g) was blended with 20–40 mL of oxalic acid solution, filtered, and transferred to a 100 mL volumetric flask. The sample was brought to volume with oxalic acid solution. From this, 20 mL was centrifuged at 4000 rpm for 10 min, then filtered through a 0.45 μm polyvinylidene fluoride microfilter. The analysis was performed with RP-HPLC (ECOM, Chráš’any u Prahy, Czech Republic) using an ultraviolet-visible (UV-VIS) detector. All samples were analysed in triplicate and expressed in mg · kg−1 FW.
Total phenols and flavonoids
A methanol extract was prepared for measuring flavonoids, and total phenols (Zloch et al., 2004). Fresh plant material (5 g) was mixed with 20 mL of 75% methanol and extracted for 24 hr. The sample was filtered, transferred to a volumetric flask and diluted with 75% methanol. For phenol determination, 10 mL distilled water, 1 mL extract and 1 mL Folin-Ciocalteu reagent were added. After 5 min, 10 mL sodium carbonate solution was added, and the flask was filled to volume with distilled water. Absorbance was measured at 765 nm after 90 min. Total phenolic content was expressed as mg · kg−1 FW of gallic acid equivalents. For flavonoid determination, 0.5 mL extract, 1.5 mL water, 0.2 mL sodium nitrite and 0.2 mL aluminium chloride were added, followed by 1.5 mL sodium hydroxide and 1 mL water. After 15 min, absorbance was measured at 510 nm. Total flavonoid content was expressed as mg · kg−1 FW of catechin equivalents.
Antioxidant activity
Antioxidant activity was evaluated using the 2,2-diphenyl-1-picrylhydrazyl (DPPH) free radical scavenging assay. The same methanol extract as for total phenols and flavonoids was used for analysis. Absorbance was measured at 515 nm after 30 min using a UV-VIS spectrophotometer. Antioxidant activity was expressed as mg · kg−1 FW of Trolox equivalents.
Magnesium and calcium content
Water-soluble magnesium and calcium were determined by isotachophoretic analysis (Blatný et al., 1997); 1 g of dried plant material was shaken with 50 mL deionized water for 60 min, then filtered and brought to volume. The Mg and Ca content was measured using an IONOSEP 2003 analyser (Recman Ltd., Ostrava, Czech Republic).
Statistical analysis
Data processing was performed in Microsoft 365 Excel. Statistical analysis was carried out using TIBCO STATISTICA 14.0.0 (2020). Homogeneity was tested using Cochran’s test. Normality was verified using the Shapiro-Wilk test. One-way analysis of variance was used, and significant differences were tested with Tukey’s honestly significant difference (HSD) test (p < 0.05). Pearson’s correlation analysis and linear regression were used to evaluate parameter relationships. Data are presented as means ± standard error (SE).
RESULTS
Water-soluble magnesium content
Significant differences in magnesium content were observed in all six species treated with higher Mg concentrations compared with the control (p < 0.05) (Figure 1, Supplementary materials, Table S1). The increase in Mg content at the highest concentration (Mg5) compared with the control ranged from 67% (mustard) to 262% (basil) (Table 4). Broccoli showed a 137% increase in Mg content.
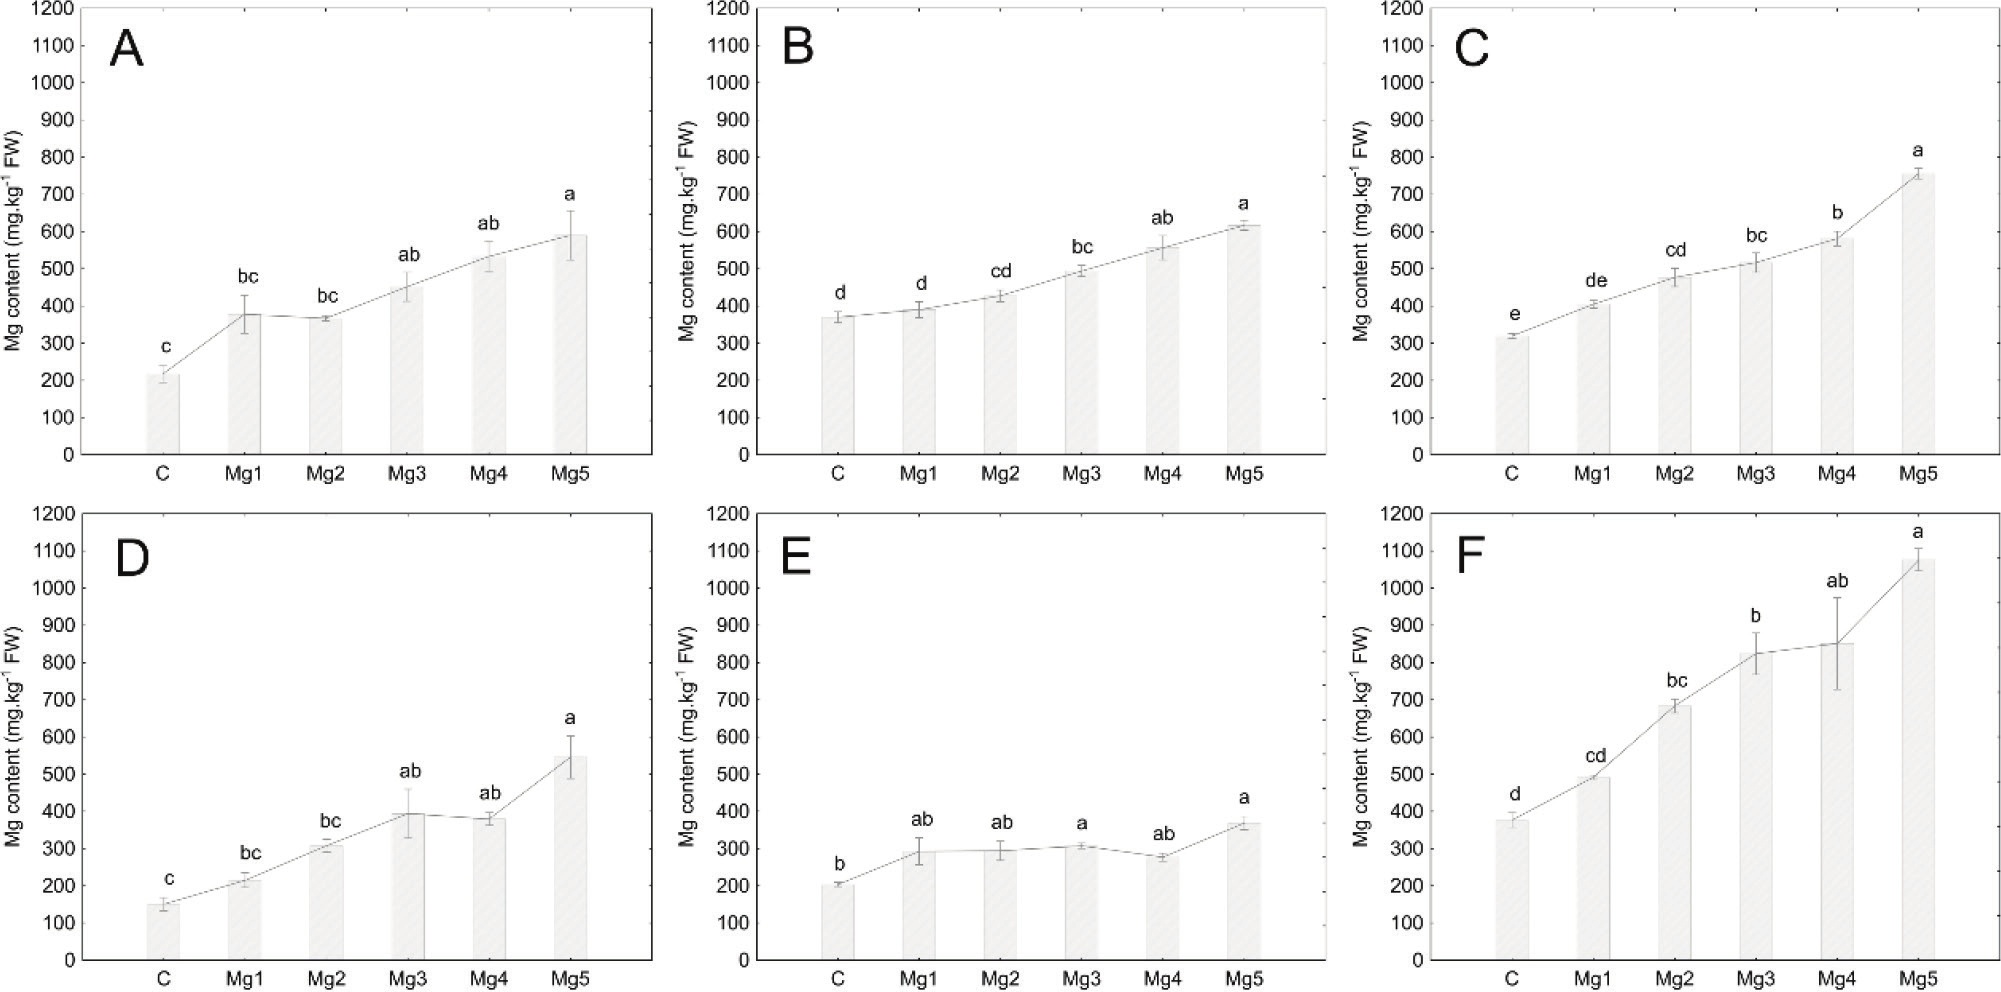
Figure 1.
Water-soluble magnesium content in the studied species. Bars marked with different letters indicate statistically significant differences between treatments (p < 0.05): (A) cress; (B) mustard; (C) broccoli; (D) basil; (E) sunflower; (F) cucumber.
Table 4.
Percentage increase in magnesium content depending on the concentration of the biofortification solution and tested microgreen species.
| Treatment | Cress (%) | Mustard (%) | Broccoli (%) | Basil (%) | Sunflower (%) | Cucumber (%) |
|---|---|---|---|---|---|---|
| C | 0 | 0 | 0 | 0 | 0 | 0 |
| Mg1 | 74.23 | 5.40 | 26.75 | 42.61 | 43.62 | 30.42 |
| Mg2 | 69.01 | 15.57 | 49.29 | 104.21 | 44.34 | 81.37 |
| Mg3 | 108.36 | 33.56 | 61.83 | 161.28 | 50.97 | 118.62 |
| Mg4 | 145.82 | 61.49 | 81.14 | 151.85 | 35.97 | 125.85 |
| Mg5 | 171.96 | 66.78 | 136.93 | 262.18 | 80.92 | 185.59 |
Minor, non-linear variations in Mg uptake were observed in some treatments, although overall enrichment trends remained significant (Figure 1, Table S1). In the control treatments, the highest Mg content was found in cucumber, followed by mustard, broccoli, cress, sunflower and basil (Table S1).
Water-soluble calcium content
Calcium content was also assessed to examine possible interactions with magnesium uptake. Among the species observed, cucumber and cress appear to have the highest water-soluble calcium content, while sunflower exhibited the lowest concentration of this element (Table 5). No significant effect of MgSO4 application on calcium content was recorded for basil and sunflower. By contrast, an increase (p < 0.05) in calcium content was evident for mustard, broccoli and cucumber with increasing concentrations of magnesium. In cress, the water-soluble calcium content increased significantly across all treatments, except for Mg2, which showed the lowest calcium content among the evaluated treatments. Compared with the control treatment, the Mg5 treatment resulted in an increase in calcium content of 47% (cress), 42% (mustard), 35% (broccoli) and 20% (cucumber) (Table 5).
Table 5.
Water-soluble calcium content in the studied species (mg · kg−1 FW).
| Treatment | Cress | Mustard | Broccoli | Basil | Sunflower | Cucumber |
|---|---|---|---|---|---|---|
| C | 195.3 ± 0.6 ab | 166.8 ± 5.8 c | 122.8 ± 4.5 b | 149.1 ± 17.2 a | 118.2 ± 2.7 a | 210.5 ± 14.4 ab |
| Mg1 | 218.3 ± 22.5 ab | 161.7 ± 5.2 c | 132.6 ± 5.1 b | 148.2 ± 9.6 a | 135.9 ± 16.7 a | 182.0 ± 6.6 b |
| Mg2 | 177.3 ± 7.5 b | 160.4 ± 5.7 c | 132.4 ± 8.9 b | 158.2 ± 10.8 a | 116.3 ± 10.5 a | 225.9 ± 3.2 ab |
| Mg3 | 233.0 ± 21.8 ab | 204.2 ± 4.1 b | 130.8 ± 4.0 b | 166.3 ± 21.6 a | 125.0 ± 2.7 a | 241.6 ± 12.8 a |
| Mg4 | 282.9 ± 18.3 a | 218.1 ± 11.1 ab | 144.8 ± 5.5 ab | 129.4 ± 8.7 a | 105.1 ± 4.7 a | 232.9 ± 20.1 ab |
| Mg5 | 286.6 ± 19.9 a | 237.6 ± 4.5 a | 165.7 ± 4.2 a | 166.7 ± 16.3 a | 122.0 ± 7.4 a | 252.8 ± 10.4 a |
Relationship between Mg and Ca content
Based on the results (Table 5), each species of microgreens appeared to respond differently to increasing levels of magnesium in plants. Some species showed a slight increase in calcium content, whereas others exhibited negligible changes or no significant effect. Regression analysis revealed species-specific relationships between magnesium and calcium content (Figure 2). A moderate to strong positive linear relationship was observed in cress, mustard, broccoli and cucumber, while only a very weak relationship was detected in basil and sunflower. Overall, increasing magnesium levels did not suppress calcium accumulation in any of the tested species.
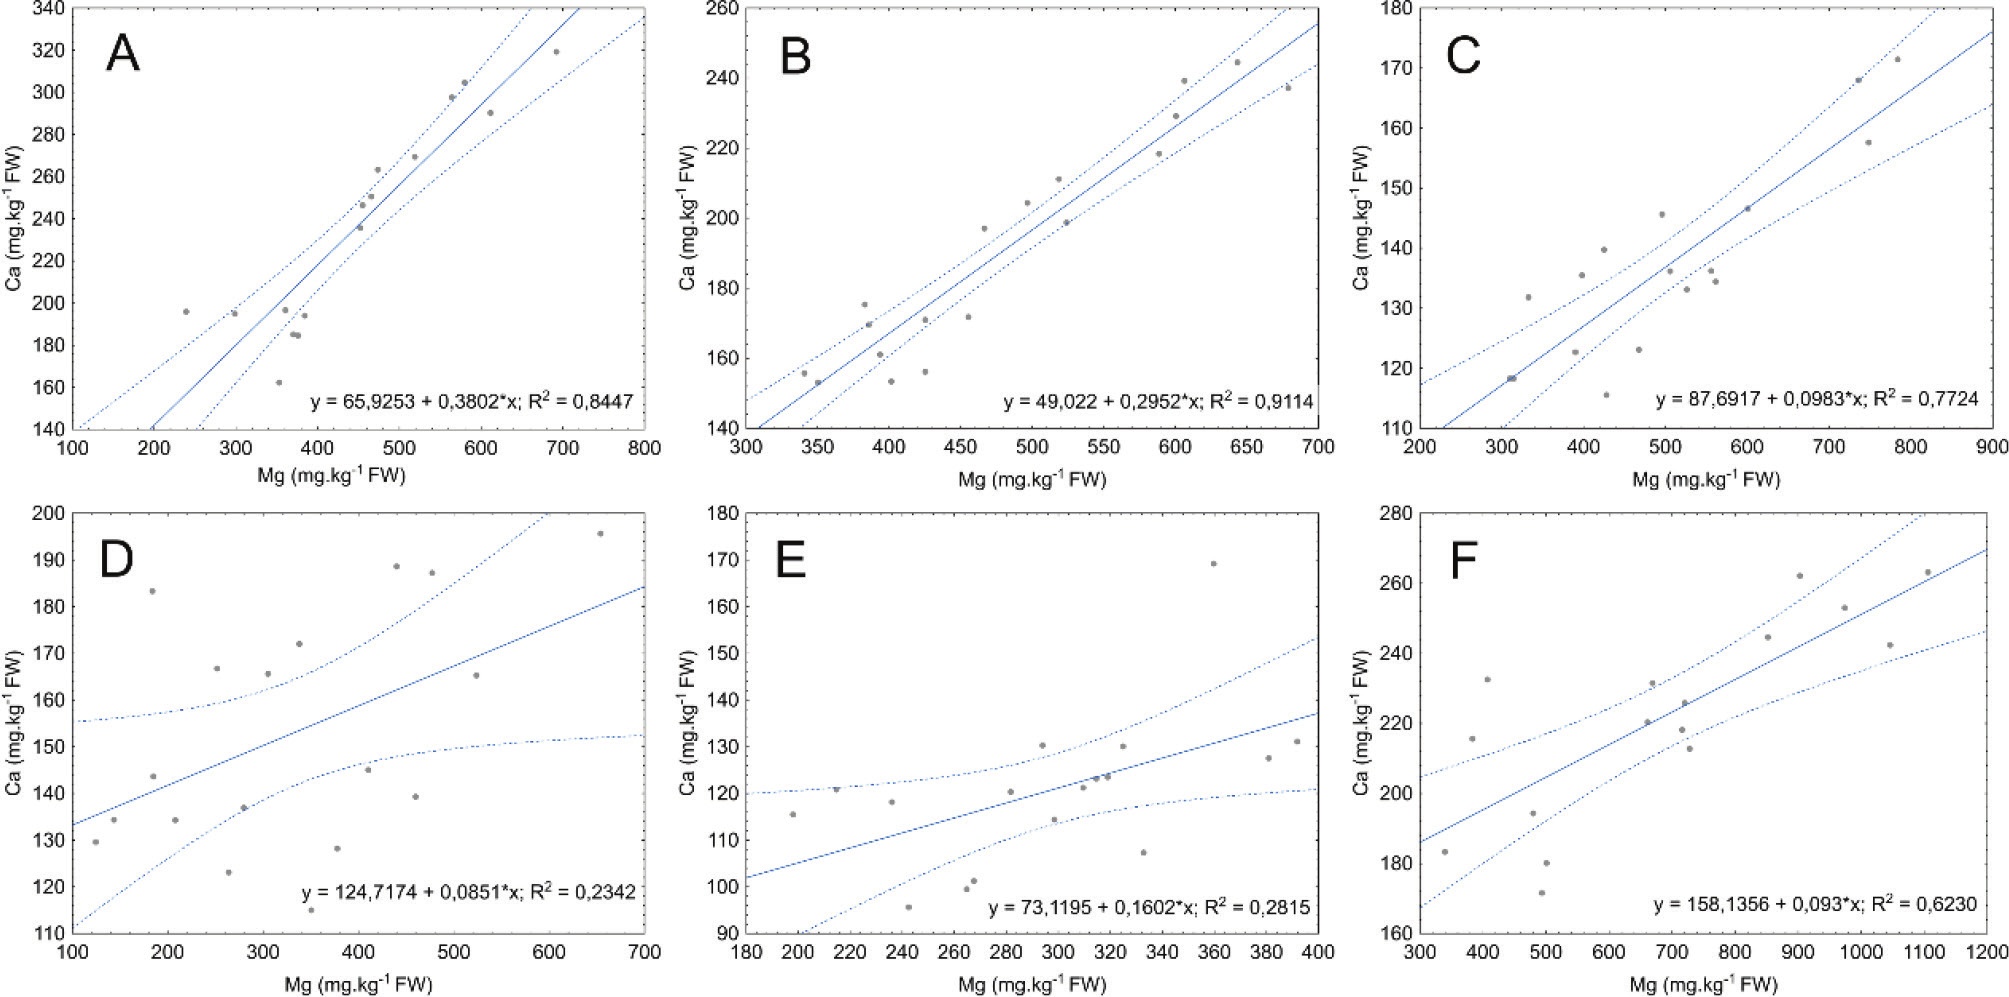
Figure 2.
Results of analysis of linear correlation between Ca and Mg content in microgreens of tested species: (A) cress; (B) mustard; (C) broccoli; (D) basil; (E) sunflower; (F) cucumber. Dashed lines represent the 95% confidence intervals of the regression lines.
Dry matter
Regardless of the treatment, basil had the highest average dry matter content, while cress had the lowest. The remaining species (cucumber, broccoli, sunflower and mustard) had similar dry matter content (Table 8). When the effect of magnesium concentration was considered, the Mg3, Mg4 and Mg5 treatments resulted in significantly higher dry matter content in mustard (p < 0.05) compared with the lower concentrations and control (Table 6). No statistically significant effect of magnesium treatment on dry matter content was observed in the remaining species.
Table 6.
Dry matter content in the studied species (% FW).
| Treatment | Cress | Mustard | Broccoli | Basil | Sunflower | Cucumber |
|---|---|---|---|---|---|---|
| C | 7.8 ± 0.2 a | 8.7 ± 0.4 b | 8.8 ± 0.3 a | 11.1 ± 1.2 a | 9.8 ± 0.3 a | 9.9 ± 0.5 a |
| Mg1 | 8.4 ± 0.7 a | 8.7 ± 0.4 b | 9.3 ± 0.3 a | 11.0 ± 0.7 a | 10.4 ± 1.2 a | 8.2 ± 0.1 a |
| Mg2 | 6.9 ± 0.2 a | 8.9 ± 0.2 b | 9.0 ± 0.4 a | 12.3 ± 0.6 a | 9.2 ± 0.8 a | 9.2 ± 0.1 a |
| Mg3 | 7.3 ± 0.5 a | 9.8 ± 0.1 ab | 9.1 ± 0.5 a | 12.7 ± 1.6 a | 9.9 ± 0.4 a | 9.0 ± 0.4 a |
| Mg4 | 8.2 ± 0.5 a | 10.8 ± 0.6 a | 9.6 ± 0.5 a | 10.7 ± 0.7 a | 8.0 ± 0.3 b | 8.9 ± 0.6 a |
| Mg5 | 8.8 ± 0.7 a | 10.5 ± 0.1 a | 9.8 ± 0.2 a | 13.7 ± 1.3 a | 10.4 ± 0.6 a | 9.7 ± 0.4 a |
Yield
In this study, magnesium concentrations did not significantly affect the yield of any species (p > 0.05) (Table S3, Figure 3). For broccoli, cucumber and sunflower, the shoots and roots were harvested and weighed separately. Yields of edible parts are provided separately (Table 7), while the total yield values refer to the entire biomass. The average fresh weight yield (including roots), expressed as g · g−1 seed, was highest in cucumber and lowest in sunflower, with cucumber producing approximately 151% higher yield than sunflower (Table 7). When yield per area was considered, sunflower had the highest mean value and basil the lowest, with sunflower exceeding basil by approximately 269% (Table 7). Between-species differences primarily reflect inherent physiological traits, as well as differences in sowing density and cultivation duration. These factors also account for the observed discrepancy between seed-normalised and area-normalised yields.
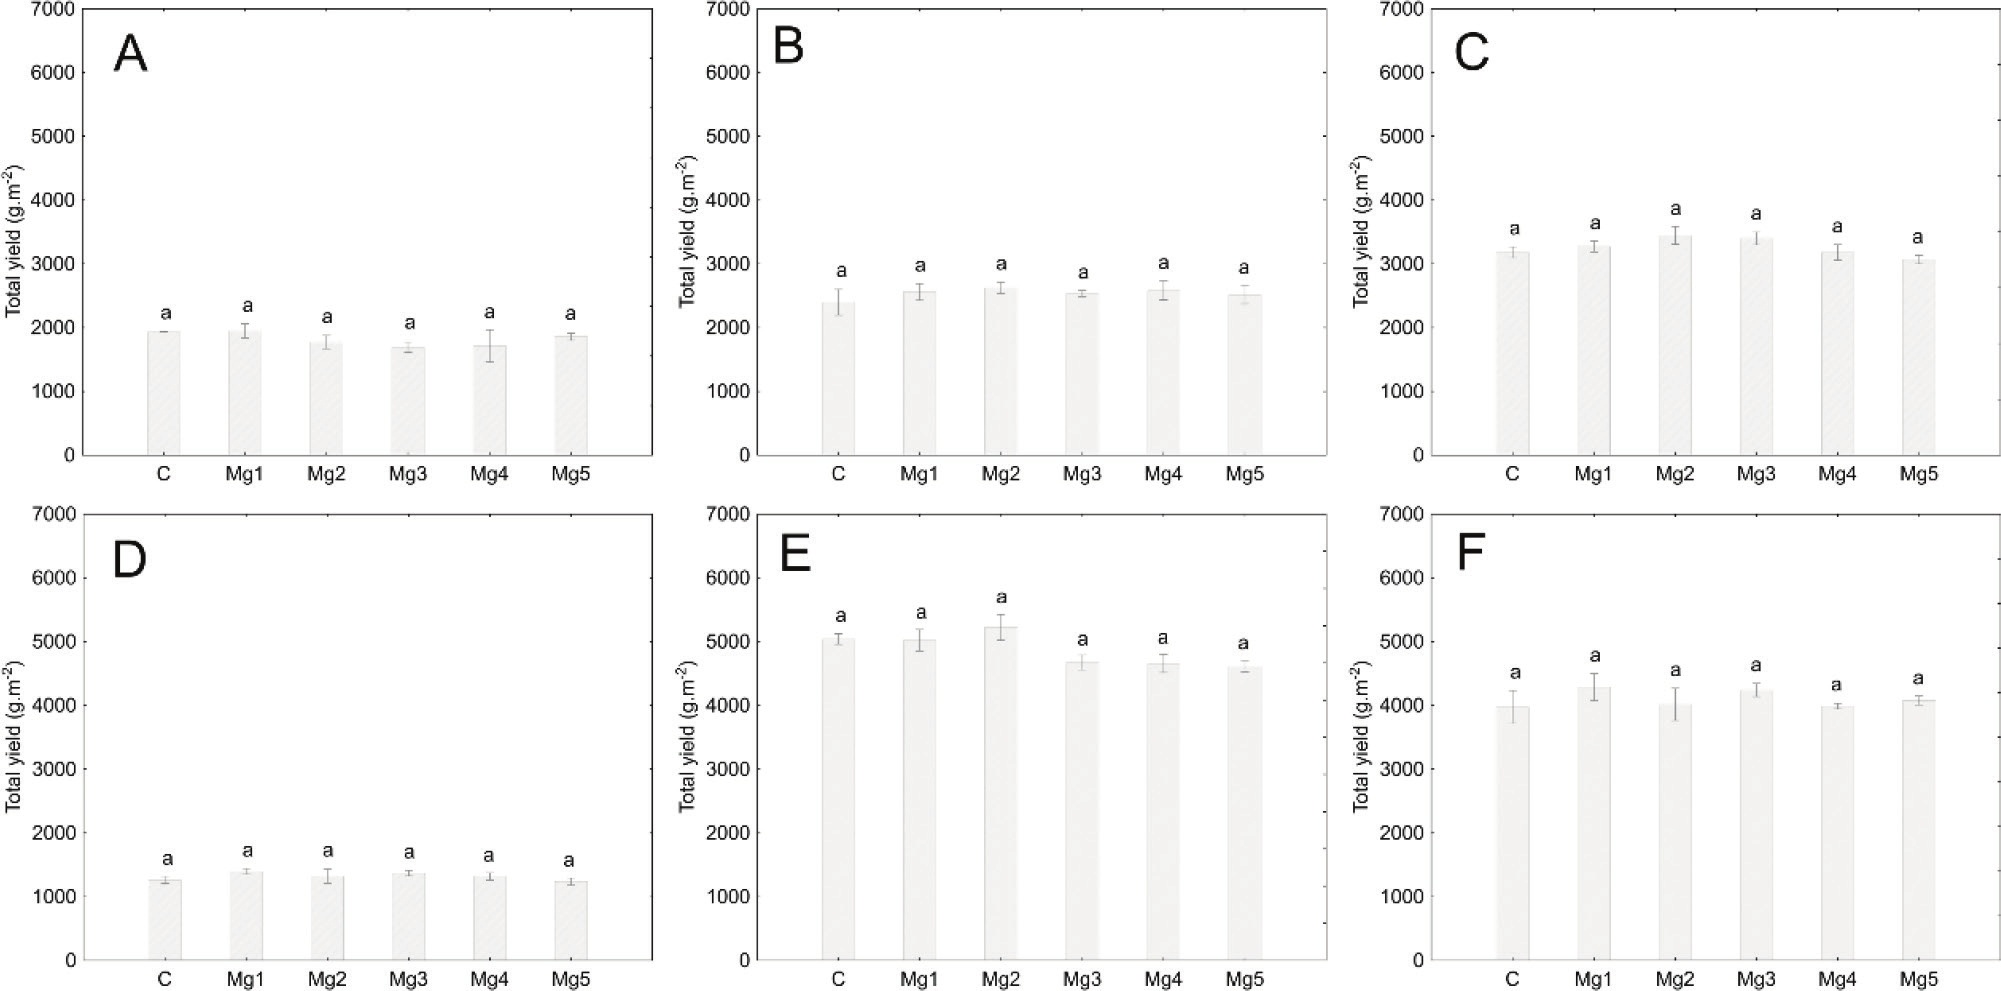
Figure 3.
Total fresh yield (g · m−2) of microgreens at different magnesium concentrations: (A) cress; (B) mustard; (C) broccoli; (D) basil; (E) sunflower; (F) cucumber. Bars marked with different letters indicate statistically significant differences between treatments at p < 0.05.
Table 7.
Comparison of microgreen yields of the tested species.
| Species | Total yield | Yield of edible parts | ||
|---|---|---|---|---|
| g · g−1 seed* | Yield (g · m−2) | g · g−1 seed | Yield (g · m−2) | |
| Cress | 9.9 ± 0.3 b | 1805 ± 53 e | 9.9 ± 0.3 b** | 1805 ± 53 e** |
| Mustard | 6.0 ± 0.1 d | 2547 ± 49 d | 6.0 ± 0.1 d** | 2547 ± 49 d** |
| Broccoli | 7.7 ± 0.1 c | 3259 ± 46 c | 4.5 ± 0.1 b | 1925 ± 22 b |
| Basil | 7.3 ± 0.2 c | 1318 ± 27 f | 7.3 ± 0.2 c** | 1318 ± 27 f** |
| Sunflower | 4.5 ± 0.1 e | 4861 ± 77 a | 2.1 ± 0.1 c | 2302 ± 78 a |
| Cucumber | 11.3 ± 0.2 a | 4114 ± 73 b | 5.7 ± 0.1 a | 2070 ± 50 b |
Ascorbic acid
The vitamin C content differed significantly among species. Treatment-related differences were found only in broccoli, where Mg5 resulted in a significantly higher content compared with the other treatments (Table S2, Figure 4A). Regardless of the concentration used, basil consistently showed the lowest ascorbic acid levels, whereas broccoli had the highest (excluding Mg5) (Table 8). The mean vitamin C content in broccoli under all treatments except Mg5 (Table 8) served as the baseline, while Mg5 increased this value by approximately 18% (Table S2).
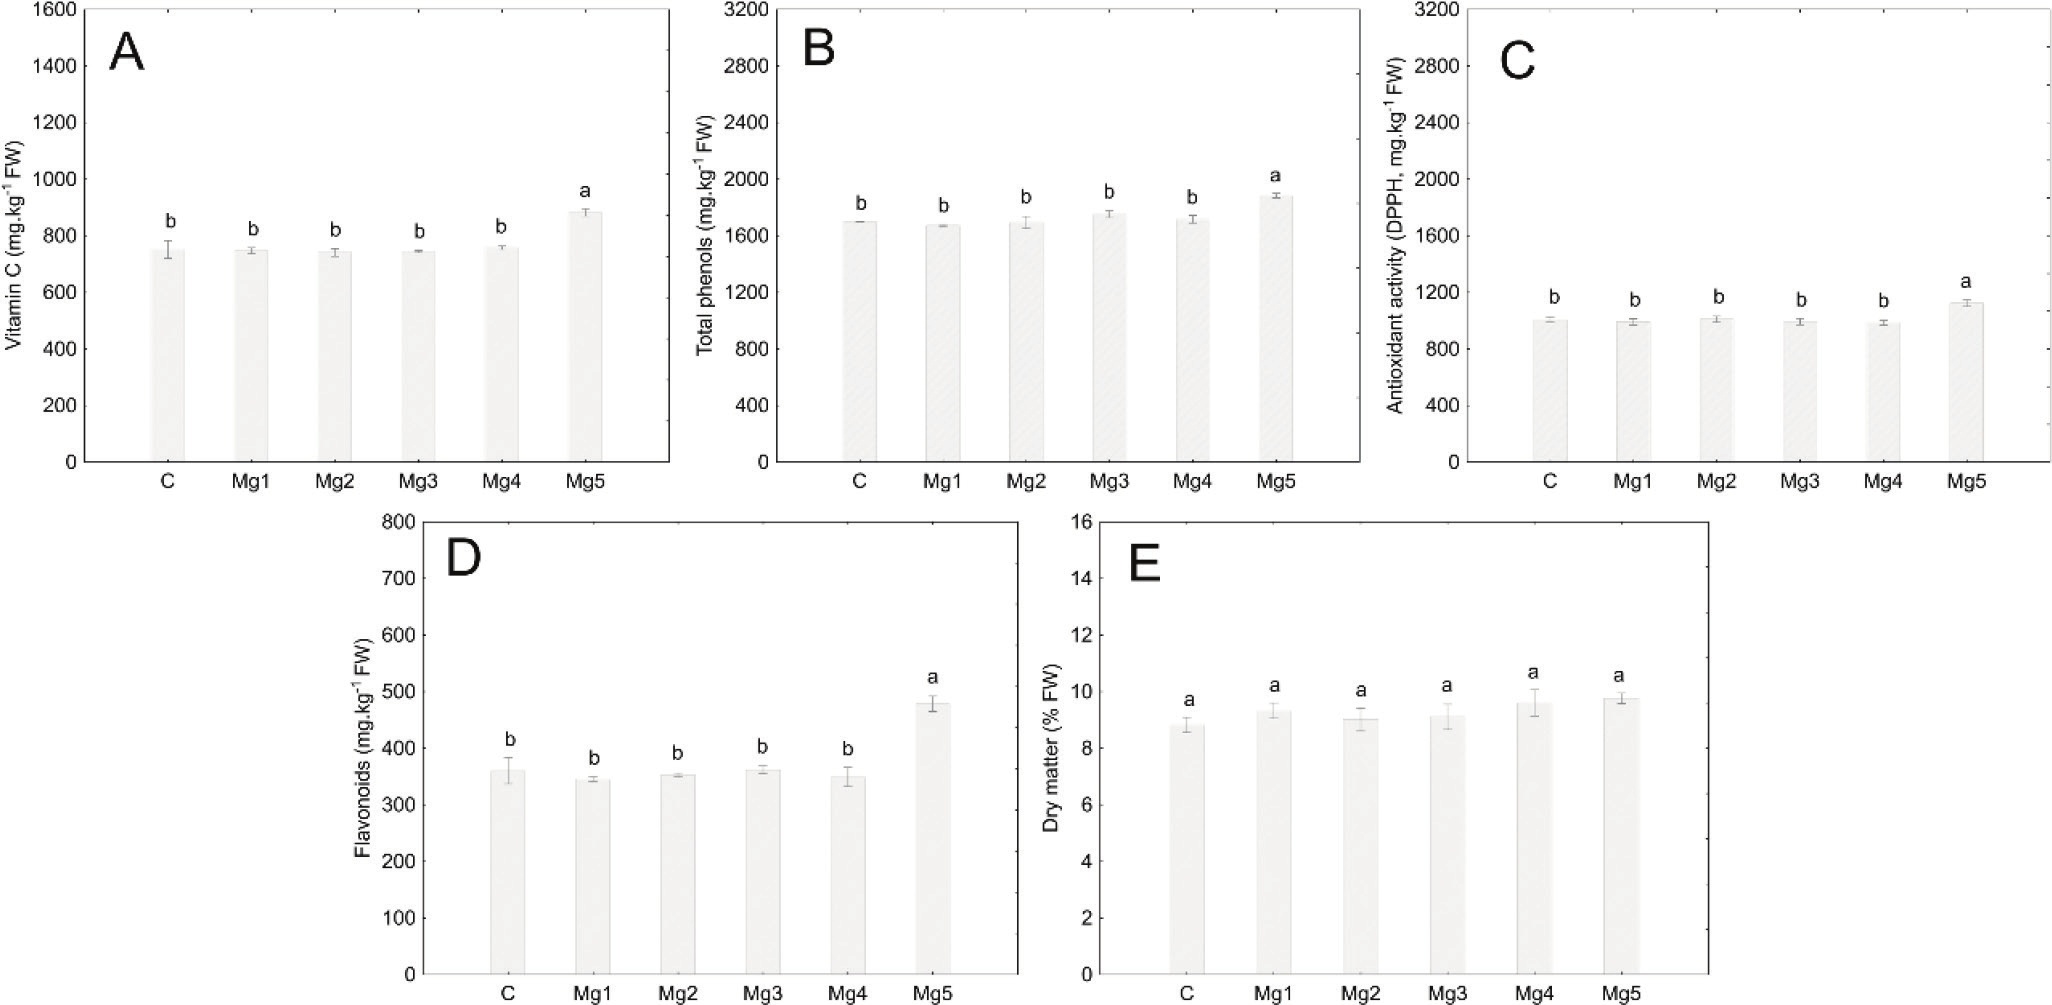
Figure 4.
Dependence of the content of analysed components in broccoli microgreens on the applied concentration of magnesium sulphate solution. Bars marked with different letters indicate statistically significant differences between treatments (p < 0.05): (A) vitamin C, (B) total phenols, (C) antioxidant activity, (D) flavonoids, (E) dry matter.
Table 8.
Comparison of analytical parameters within species regardless of treatment.
| Species | Vitamin C (mg · kg−1 FW) | Antioxidant activity (DPPH) (mg · kg−1 FW) | Flavonoids (mg · kg−1 FW) | Total phenols (mg · kg−1 FW) | Dry matter (% FW) |
|---|---|---|---|---|---|
| Cress | 167.7 ± 7.4 c | 886.9 ± 24.6 b | 305.2 ± 7.1 c | 1909.7 ± 68.5 b | 7.9 ± 0.2 c |
| Mustard | 312.2 ± 7.8 b | 906.8 ± 23.2 ab | 341.0 ± 9.9 c | 3445.5 ± 102.1 a | 9.6 ± 0.2 b |
| Broccoli* | 748.4 ± 6.5 a | 997.9 ± 8.2 a | 353.9 ± 5.4 c | 1707.9 ± 12.6 b | 9.2 ± 0.2 b |
| Basil | 43.3 ± 1.8 e | 563.4 ± 23.1 c | 528.9 ± 30.0 a | 1017.7 ± 40.9 c | 11.9 ± 0.5 a |
| Sunflower | 51.8 ± 2.1 e | 410.2 ± 35.6 d | 423.9 ± 22.4 b | 1004.4 ± 56.3 c | 9.6 ± 0.3 b |
| Cucumber | 74.7 ± 2.5 d | 150.4 ± 6.1 e | 145.7 ± 4.3 d | 661.8 ± 14.8 d | 9.1 ± 0.2 b |
Total phenolic content
No significant differences in total phenolic content were observed among the treatments, except in broccoli, where the Mg5 treatment led to significantly higher total phenol content (Table S2, Figure 4B). Regardless of treatment, cucumber had the lowest average total phenolic content, while mustard had the highest (Table 8).
Antioxidant activity
While antioxidant activity was not significantly influenced by the treatments overall, significant differences were observed in broccoli, where the Mg5 treatment had significantly higher antioxidant activity compared with the other treatments (Table S2, Figure 4C). Broccoli exhibited the highest average antioxidant activity, even when excluding the Mg5 treatment, while cucumber had the lowest values (Table 8). In fact, antioxidant activity in broccoli was 553% higher compared with cucumber.
Flavonoids
Flavonoid content showed significant variability between species (Table 8). Similar to ascorbic acid, broccoli in the Mg5 treatment exhibited significantly higher flavonoid content compared with the control and lower concentration treatments (Table S2, Figure 4D). Relative to the mean of the control and all non-Mg5 treatments (Table 8), Mg5 increased flavonoid content by approximately 35% (Table S2). The other species did not exhibit significant changes in flavonoids across Mg concentrations. To further assess the relationship between magnesium accumulation resulting from MgSO4 application and flavonoid content, a linear regression analysis was performed in broccoli microgreens. A positive, moderately strong relationship was observed between Mg content and flavonoid concentration (Figure 5A), indicating that magnesium accumulation explained a substantial proportion of the variability in flavonoid content. In addition, a positive relationship between Mg content and vitamin C was also observed (Figure 5B), although this relationship was slightly weaker than that observed for flavonoids.
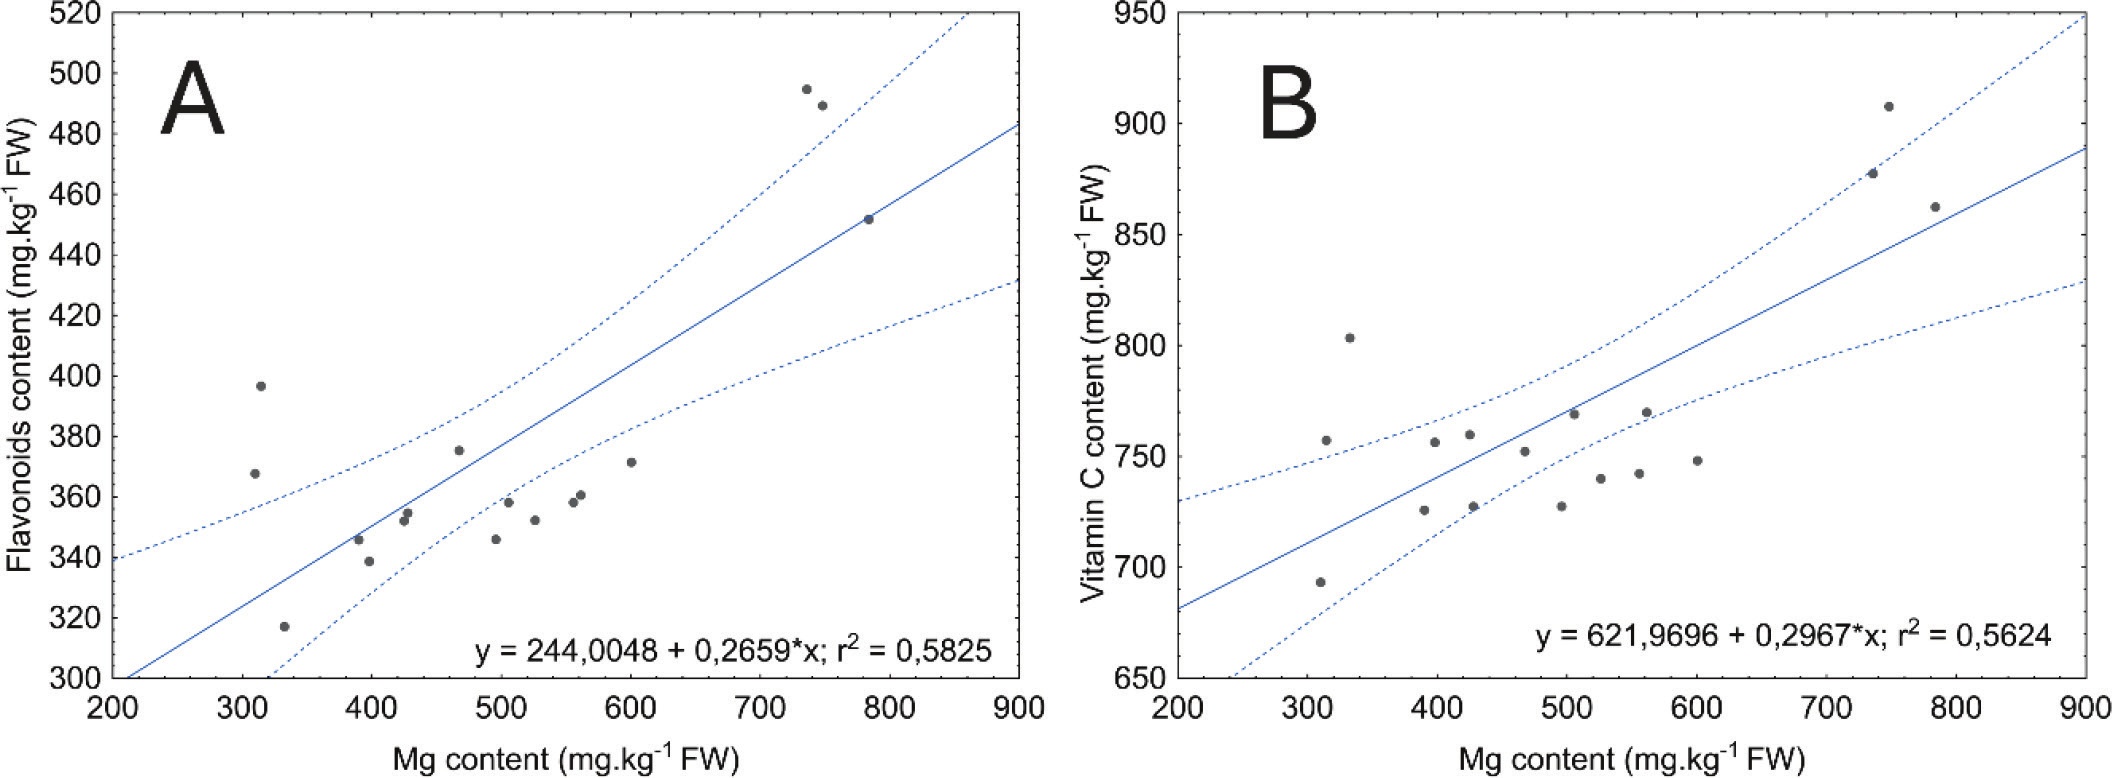
Figure 5.
Relationship between magnesium content and selected parameters for broccoli microgreens: (A) relationship between magnesium content and flavonoid content; (B) relationship between magnesium content and vitamin C content. Values represent individual data points with the fitted regression line and 95% confidence intervals.
DISCUSSION
The effect of magnesium biofortification in plants at the microgreens or sprout stage has not yet been the focus of extensive scientific research. One of the few available studies, conducted by Przybysz et al. (2015), reported that MgSO4 concentrations of 50–300 mg · L−1 increased Mg content in broccoli sprouts by 8%-83%, although the experiment was carried out on sprouts rather than microgreens.
The suitability of a particular microgreen species for magnesium biofortification is influenced, among other factors, by the genetically determined magnesium content in both seeds and plant biomass during growth. Xiao et al. (2016) reported an average Mg content of 510 mg · kg−1 FW in broccoli microgreens, which is notably higher than the value observed in the control treatment of the present study (319 mg · kg−1 FW). By contrast, the reported value for mustard (350 mg · kg−1 FW) closely corresponds to the levels observed in this study (370 mg · kg−1 FW). In sunflower microgreens, Di Gioia et al. (2023) reported Mg levels of 390 mg · kg−1 FW, which is substantially higher than the 204 mg · kg−1 FW observed in the control treatment of the present study (Table S1).
Basil microgreens that exhibited the highest percentage increase in Mg accumulation had the lowest Mg content in the control variant, and therefore likely also in the seeds. To achieve maximum efficiency in Mg biofortification of plants, it is essential to consider not only the species-specific responses of microgreens to Mg supply but also the genetic differences in the initial Mg content of seeds (White and Broadley, 2009; Przybysz et al., 2015). Munir et al. (2017) reported an Mg content of 316 mg Mg · kg−1 FW in O. basilicum L. seeds, whereas Ocimum tenuiflorum L. seeds contained 2770 mg Mg · kg−1 FW (Ziemichód et al., 2019). This indicates substantial interspecific variability in seed Mg content, and a preliminary analysis of seed Mg levels would be advisable when selecting species for Mg biofortification.
The response of plant species to Mg uptake may be rooted in genetic variation. Different plant species possess distinct mechanisms for Mg2+ uptake and transport, which are adapted to specific environmental conditions (Tang et al., 2015; Kleczkowski and Igamberdiev, 2021). The low Mg uptake observed in sunflower microgreens in this study may be related to the presence of seed coat remnants on the leaves, which could only be safely removed 2 days before harvest and may have limited early Mg absorption compared with species with readily exposed cotyledons. Tavan et al. (2024) also emphasise that adequate exposure of the leaf surface to foliar ions application can be a crucial factor for successful biofortification.
Plants have developed efficient physiological systems for effective uptake and internal translocation of Mg. The magnesium transporter (MGT)/mitochondrial RNA splicing 2 (MRS2) family represents the most extensively characterised group of Mg transporters in plants (Chen et al., 2018; Tian et al., 2021). Mg2+ uptake mediated by these transporters follows an active transport pathway, which requires energy consumption and involves the binding of Mg2+ to membrane proteins, facilitating its transmembrane movement against the concentration gradient (Chen et al., 2018). In addition to active uptake, Mg can also enter the root cells through non-selective cation channels (passive pathways), where it moves along the concentration gradient via energy-independent diffusion driven by water flow. Both active and passive pathways contribute to Mg uptake in plants. However, it remains unclear which pathway predominates under varying Mg availability conditions and at different growth stages (Wang et al., 2020a).
The efficiency of magnesium uptake, as well as the nutrient and phytochemical content, is influenced by multiple factors, including crop and cultivar selection, genetic variability among species and cultivars, the breeding status of the chosen genotype and the growth stage (Ebert, 2022; Ishfaq et al., 2022). However, environmental factors also play a significant role; notable differences in the content of certain secondary metabolites have been observed when microgreens were grown under growth chamber conditions compared with a windowsill environment (Liu et al., 2021). The effectiveness of biofortification can also be influenced by the form in which Mg is supplied to plants. For instance, MgSO4 had a more positive effect on secondary metabolite content compared with MgCl2 application in green beans (Ciscomani-Larios et al., 2021).
Substrate selection may also be a key factor in enhancing biofortification success, as cabbage microgreens grown hydroponically exhibited lower element concentrations (K, S, Ca, Mg, Mn, Cu, Zn, Fe, and Na) compared with those cultivated in vermicompost (Weber, 2016). Proper management of the light environment can improve element uptake in microgreens. However, studies suggest that species-specific responses to changes in the light spectrum must be considered (Brazaitytė et al., 2018). The microgreen species examined in this study showed significant differences in the content and accumulation of the water-soluble magnesium fraction in plant tissues, which, in addition to interspecific variability in Mg absorption capacity, may also be related to cultivation duration, overall irrigation requirements and species-specific environmental requirements (Table 3).
Based on the previously stated adult RDI for magnesium (National Academies Press, 1997) and the Mg concentration measured in our cucumber microgreens, the amounts required to meet the daily requirement are approximately 390 g FW for men and 300 g FW for women. Since most people likely consume only 50% of the RDI (Nielsen, 2018), magnesium-enriched microgreens could provide an easily accessible dietary supplement. A portion of 100 g of magnesium-enriched microgreens could substantially contribute to meeting the daily magnesium requirements. Broccoli, which had the third-highest Mg content in the control treatment and second-highest after 50 mg Mg · L−1 application (Table S1), also had relatively high levels of vitamin C, flavonoids, total phenols, a pronounced DPPH scavenging capacity and, therefore, showed substantial antioxidant activity (Table 8). These could potentially be further enhanced with higher Mg concentrations (Figure 4), making broccoli an attractive option for biofortification. Future studies should explore the effects of magnesium biofortification on different broccoli cultivars.
The minimal effect of Mg application on Ca content observed in this study may be related to the short cultivation period of microgreens. Calcium (Ca2+) and magnesium (Mg2+) are the two most abundant divalent cations in plants and often interact antagonistically, as they compete for the same binding sites on enzymatic and transport proteins (Guo et al., 2015; Tang and Luan, 2017). However, a proposed hypothesis suggests that high levels of external Mg2+ may cause a transient increase in cytosolic Ca2+ within plant cells (Tang et al., 2015). Such a mechanism could potentially explain the slight increases in Ca content detected in some species, although this remains to be experimentally confirmed.
Excluding Mg5, broccoli’s dry matter content averaged 9.2% (Table 8), higher than the 7.9% reported by Xiao et al. (2016). The higher dry matter content in this study may be attributed to differences in growing conditions or cultivar, as well as a 1-day longer cultivation period. The average dry matter content in basil (12.3%) aligns with other studies, where green basil’s dry matter content ranged from 10.1 to 11.9% (Pannico et al., 2020). A recent study on the biofortification of broccoli microgreens with ascorbic acid showed a correlation between higher ascorbic acid doses and dry matter content, with the control having an average of 7.5% dry matter, which increased to 8.9% with 0.25% ascorbic acid (Kathi et al., 2023).
While no significant effect of Mg on dry matter content in broccoli was observed in this study, the average dry matter content was still higher, and the Mg5 treatment showed a non-significant (p > 0.05) trend towards higher dry matter content at Mg5 compared with the lower concentrations and control (Table 6). Similar inconsistencies have also been reported in biofortification studies with other nutrients. In zinc biofortification, for instance, no significant effect of Zn application on dry matter content was observed (Poudel et al., 2023). The impact of Zn supplementation appeared to be species-dependent, with a significant effect detected only in arugula microgreens, while other species remained unaffected (Di Gioia et al., 2019). These findings partially align with the results of the present study, where dry matter content was influenced only in mustard, whereas no significant differences were observed in the remaining species.
Magnesium biofortification did not show any significant differences in biomass yield compared with the control treatments. Importantly, the application of MgSO4 did not induce toxicity symptoms. These findings align with a study on the effect of magnesium enrichment in plant sprouts, which also reported negligible impacts on yield (Przybysz et al., 2015).
Magnesium deficiency in plants has been the subject of significantly greater research interest than its toxicity (Verbruggen and Hermans, 2013). Toxicity is also barely noticeable even at concentrations of up to 60 mM Mg (Shaul et al., 1999). One potential explanation for the limited reports on Mg toxicity is the substantial vacuolar storage capacity for Mg within plant cells (Hawkesford et al., 2012). In this study, no significant effect on biomass accumulation was observed across different treatments, suggesting that Mg enrichment in microgreens can be conducted without a negative impact on yield. Conversely, the negative effects of excessive Mg on biomass accumulation in young rice and cockspur grass plants have been attributed to a decline in Ca concentrations (Kobayashi et al., 2005). By contrast, the present study did not reveal any negative effect of Mg on Ca accumulation (Table 5).
The effect of biofortification on microgreen yield has not been demonstrated for selenium in basil (Pannico et al., 2020) or in members of the Brassicaceae family, such as kale and kohlrabi (Viltres-Portales et al., 2024). In some cases, however, high concentrations of the applied element can negatively impact yield. For instance, Di Gioia et al. (2019) reported that Fe concentrations exceeding 10 mg · L−1 adversely affected the yield of tested species. Similarly, Fe concentrations of 24 and 36 mg · L−1 reduced yield in broccoli and radish, whereas no negative effects were observed in mung beans or alfalfa (Przybysz et al., 2016).
Di Gioia et al. (2023) examined the yield of 17 microgreen species, including broccoli, basil, cress and sunflower, which were also a part of this study. These plants were cultivated in a soilless system using a natural fibre mat as the growing substrate. In their study, the reported yield of broccoli was 1461 g · m−2, whereas our study achieved a higher yield of 1925 g · m−2, excluding root mass (Table 7). Notably, our experimental conditions included a sowing density of 13.7 seeds · cm−2, compared with their lower density of 2.7 seeds · cm−2. Additionally, our cultivation period was 10 days, while theirs extended to 11 days (Table 1; Table 7).
Sunflower yields of 1656 g · m−2 have been documented at a sowing density of 1 seed · cm−2 over 10 days. In our study, we achieved a higher yield of 2342 g · m−2 (excluding roots) with a density of 1.8 seeds · cm−2 over 9 days (Table 1; Table 7). Vrkić et al. (2024) reported a yield range of 1219–1590 g · m−2 for mustard, depending on the LED lighting intensity, with a sowing density of 5 seeds · cm−2 and an 8-day cultivation cycle. By contrast, our study achieved a significantly higher yield of 2547 g · m−2 at a sowing density of 7.3 seeds · cm−2 over 6 days (Table 1; Table 7).
The high sowing density in this study may not always correlate with increased yield. Variations in results may also arise from differences in harvesting methods (e.g. harvesting the entire plant with roots, precision of above-ground part harvesting, or time since the last watering, affecting turgor). Future studies should focus on optimising the sowing density-to-yield ratio. Additionally, seed quality, cultivar choice and cultivation conditions should be considered.
Phytochemical parameters, including vitamin C, play an equally important role in assessing the dietary value of microgreens. In mature broccoli, Koh et al. (2009) reported an average vitamin C content of 872 mg · kg−1 FW, while for broccoli microgreens, reported values range between 791 mg · kg−1 FW (Kowitcharoen et al., 2021) and 893 mg · kg−1 FW (Xiao et al., 2019). In the present study, lower magnesium concentrations (up to 40 mg · L−1) did not significantly affect ascorbic acid content compared with the control, whereas the highest concentration caused a noticeable increase (Table S2), suggesting a potential contribution of Mg enrichment to elevated vitamin C levels, although this effect requires further confirmation at higher Mg concentrations and across species.
This raises the question of possible underlying mechanisms, as magnesium sulphate at certain levels may influence ascorbate oxidase activity, thereby altering ascorbic acid accumulation (Malik et al., 2011; Gokul et al., 2021). The effect of magnesium on vitamin C content appears to be species-specific and may also depend on the form of magnesium applied. For example, Borowski and Michałek (2010) reported that foliar application of magnesium salts negatively affected ascorbic acid levels in spinach, while Yadav et al. (2019) found that cucumber microgreens contained more vitamin C than cucumber fruits.
The literature values for cucumber show strong variability, likely reflecting cultivar differences; nevertheless, according to the U.S. Department of Agriculture (2024), the average content in cucumber fruits is 28 mg · kg−1 FW. By comparison, cucumber microgreens in this study contained on average 75.78 mg · kg−1 FW (Table 8), which, although relatively low compared with other microgreen species, still exceeds values typically reported for cucumber fruits. Supporting evidence for a positive relationship between magnesium and vitamin C has been observed in Chinese cabbage, where high Mg content enhanced vitamin C synthesis (Liu et al., 2008). Conversely, the negative correlation reported in spinach was attributed to the so-called ‘thinning effect’, as the higher biomass yield of Mg-treated plants diluted vitamin C concentrations (Borowski and Michałek, 2010).
Since in this study a clear correlation between Mg and vitamin C was observed only in broccoli, it can be concluded that plant responses to elevated Mg levels are strongly species-dependent. Biofortification through the supplemental application of ascorbic acid in broccoli microgreens resulted in an increase in vitamin C content by up to 222%. A positive correlation between vitamins C and K was observed, while negative correlations were found with N, P, Mg, Ca, S and B (Kathi et al., 2023). Additionally, the simultaneous application of ascorbic acid and Ca increased Mg content in arugula microgreens by 17% (Kathi et al., 2024).
Investigating the combined application of ascorbic acid with Mg could provide valuable insights. The RDI of vitamin C is 90 mg for men and 75 mg for women (Naidu, 2003). Given the highest average vitamin C values found in this study (883 mg · kg−1 for broccoli), daily consumption of 102 g of broccoli microgreens for men and 85 g for women would meet the RDI. Future studies should also consider the impact of different broccoli cultivars on vitamin C content.
The results suggest that mustard is the richest source of total phenols, with species from the Brassicaceae family generally being good sources of phenolic compounds. Mustard seeds are well known for their high phenolic content (Nguyen et al., 2024), and this study supports the idea that young mustard plants have a similar phenolic profile. Xuan et al. (2022) reported higher concentrations of total phenols in rice seedlings when magnesium sulphate was applied compared with the control. In the present study, a comparable effect was observed in broccoli microgreens, where the Mg5 treatment led to an increase in the total phenol content.
Magnesium is involved in secondary metabolism, where plants synthesise polyphenols via the shikimic acid and polyacetate pathways. These pathways lead to the production of flavonoids, anthocyanins and tannins (Guo et al., 2015; Amaya-Olivas et al., 2023). Mg biofortification may have induced abiotic stress in broccoli microgreens, resulting in increased total phenolic production through the activation of the phenylpropanoid pathway (Islam et al., 2020). A similar increase was observed in vitamin C and flavonoids, all of which exhibit free radical-scavenging activity (Janas et al., 2009; Akladious, 2012).
Selenium application consistently had a positive effect on the total phenol content; however, species-specific responses to Se were often evident (Islam et al., 2020; Pannico et al., 2020; Newman et al., 2021). Additionally, the application of ZnO positively increased the concentration of phenols in pea and sunflower microgreens (Poudel et al., 2023). Przybysz et al. (2015) reported that MgSO4 concentrations between 50 and 300 mg · L−1 positively affected antioxidant activity in broccoli sprouts, though in our study, these findings were only partially confirmed (for the Mg5 treatment).
In this study, broccoli exhibited the highest antioxidant activity, which is consistent with previous reports identifying broccoli microgreens as an excellent source of antioxidants (Akladious, 2012; Patras et al., 2017). Antioxidant activity is often assessed in similar studies focusing on the enrichment of microgreens with certain elements; for instance, higher antioxidant activity has been observed with the biofortification of microgreens with Zn or Se (Newman et al., 2021; Poudel et al., 2023).
To better understand these results, it is important to consider the physiological mechanisms through which Mg supply may influence antioxidant responses in plants. The response to abiotic stress factors (temperature, light exposure, salinity) can induce the production of primary and secondary metabolites in plants, contributing to the functional quality of edible plant parts (Teklić et al., 2020). For instance, an increase in antioxidant activity has been observed in hydroponically grown tomatoes in response to an excess of Mg in the nutrient solution (Fanasca et al., 2006).
Elevated antioxidant activity under high Mg supply may be linked to increased activity of enzymes such as glutamine synthetase, which plays a crucial role in ammonia regulation and detoxification of plant tissues (Rouphael and Kyriacou, 2018). The increase in antioxidant activity following the application of 50 mg Mg · L−1 in broccoli microgreens may be a response to stress induced by Mg biofortification.
Antioxidants subsequently regulate the levels of reactive oxygen species (ROS), which accumulate and are activated under stress conditions. During the initial phase of seed hydration and germination, ROS signalling pathways are triggered, leading to the activation of antioxidant mechanisms (Przybysz et al., 2015; Islam et al., 2020). Antioxidant activity is directly related to the total phenolic content in plants, particularly in fruits and vegetables (Morales-Morales et al., 2020), which is consistent with the findings of our study in the case of broccoli Mg5 treatment.
Ciscomani-Larios et al. (2021) reported a positive effect of MgSO4 application on flavonoid content in green beans, and a similar increase was observed in rice seedlings (Amaya-Olivas et al., 2023). However, these studies focused on later developmental stages, suggesting that a longer cultivation period might also influence flavonoid and total phenol accumulation in the species examined here.
In the present study, a significant increase in flavonoid content was detected only in broccoli microgreens under the Mg5 treatment, whereas the other species showed no clear response. Agronomic biofortification of sunflower and pea microgreens with Zn similarly did not result in significant changes in flavonoid concentration (Poudel et al., 2023), while the application of selenium in wheat microgreens had a pronounced positive effect (Islam et al., 2020).
Cucumber exhibited the lowest average flavonoid content across all treatments, while basil had the highest, confirming its role as a rich source of flavonoids, as also reported in previous studies (Ghasemzadeh et al., 2016; Nguyen et al., 2021). In this study, basil consistently stood out for its flavonoid content, although its total phenol levels were lower than in other species. By contrast, mustard showed average flavonoid levels but had a total phenol content more than three times higher than basil, likely reflecting genotypic variability or differences in cultivation period.
CONCLUSIONS
This study demonstrated that application of MgSO4 effectively increased magnesium content in the microgreens studied, with cucumber and broccoli showing the greatest potential for Mg biofortification. Notably, no adverse effects were observed on yield or the measured phytochemicals. In broccoli, the highest Mg concentration (50 mg · L−1) significantly increased total phenols, flavonoids, ascorbic acid and antioxidant activity, and could therefore be recommended to enhance antioxidant activity and bioactive compounds. Agronomic biofortification of crops has the potential to enhance magnesium intake in the human diet, offering a viable alternative to commercial dietary supplements. The effectiveness and safety of such nutritional recommendations is contingent upon the selection of appropriate crop species, cultivation conditions and the method of Mg application. Standardisation of the biofortification process is essential to ensure optimal crop quality, food safety and adequate Mg accumulation. This research, one of the first to focus on magnesium biofortification in microgreens, provided valuable insights into their potential as functional foods. Future studies should explore the impact of Mg biofortification on bioactive compounds, like glucosinolates in Brassicaceae species, and examine interactions between Mg and other elements, such as sulphur. It is also essential to optimise Mg biofortification techniques for individual microgreen species, particularly for those identified as the most promising candidates for magnesium enrichment. These efforts could help improve the process of microgreen biofortification and enhance their role as healthy dietary supplements.
Abbreviations
- DPPH
2,2-diphenyl-1-picrylhydrazyl
- LED
light-emitting diode
- PVDF
polyvinylidene fluoride
- RDI
recommended daily intake
- ROS
reactive oxygen species
Notes
[9] Contributed by AUTHOR CONTRIBUTIONS
A.F., A.J. – conceptualisation; A.J. – methodology; R.P. – software; A.J., R.P. – validation; A.F. – formal analysis; A.F., A.J. – investigation; A.F. – resources; A.J. – data curation; A.F. – writing–original draft preparation; R.P. – writing-review and editing; A.F. – visualisation; A.J., R.P. – supervision; R.P. – project administration; R.P. – funding acquisition. All authors have read and agreed to the published version of the manuscript.
[10] Conflicts of interest CONFLICT OF INTEREST
The authors declare no conflicts of interest.
SUPPLEMENTARY MATERIALS
Table S1.
Magnesium content in the studied species (mg·kg−1 FW) as dependent on the applied MgSO4 treatments
| Treatment | Cress | Mustard | Broccoli | Basil | Sunflower | Cucumber |
|---|---|---|---|---|---|---|
| C | 216.8 ± 22.4 c | 369.8 ± 14.6 d | 319.1 ± 6.9 e | 150.7 ± 17.5 c | 203.7 ± 5.5 b | 376.8 ± 19.8 d |
| Mg1 | 377.8 ± 51.2 bc | 389.8 ± 21.7 d | 404.4 ± 10.6 de | 214.9 ± 19.6 bc | 292.5 ± 36.1 ab | 491.4 ± 6.9 cd |
| Mg2 | 366.5 ± 7.0 bc | 427.4 ± 15.6 cd | 476.5 ± 24.5 cd | 307.8 ± 16.8 bc | 294.0 ± 25.9 ab | 683.4 ± 18.5 bc |
| Mg3 | 451.8 ± 38.9 ab | 493.9 ± 15.1 bc | 516.5 ± 25.9 bc | 393.8 ± 65.8 ab | 307.5 ± 7.3 a | 823.7 ± 55.8 b |
| Mg4 | 533.1 ± 39.3 ab | 556.3 ± 32.2 ab | 581.0 ± 19.5 b | 379.6 ± 17.3 ab | 276.9 ± 10.8 ab | 850.9 ± 122.9 ab |
| Mg5 | 589.7 ± 66.2 a | 616.8 ± 13.4 a | 756.05 ± 14.4 a | 545.8 ± 57.0 a | 368.5 ± 18.1 a | 1076.1 ± 30.1 a |
Table S2.
Selected bioactive parameters of microgreen species under different Mg treatments
| Treatment | Vitamin C (mg · kg−1 FW) | Antioxidant activity (DPPH) (mg · kg−1 FW) | Flavonoids (mg · kg−1 FW) | Total phenols (mg · kg−1 FW) |
|---|---|---|---|---|
| Cress | ||||
| C | 197.3 ± 33.8 a | 845.3 ± 62.9 a | 289.9 ± 2.1 a | 1624.0 ± 57.2 a |
| Mg1 | 193.6 ± 19.3 a | 886.2 ± 81.7 a | 313.2 ± 21.6 a | 1829.3 ± 260.8 a |
| Mg2 | 160.0 ± 6.1 a | 856.8 ± 47.2 a | 278.9 ± 8.7 a | 1885.1 ± 82.4 a |
| Mg3 | 169.4 ± 13.4 a | 843.8 ± 38.2 a | 303.6 ± 8.8 a | 1893.4 ± 97.0 a |
| Mg4 | 159.7 ± 16.1 a | 952.9 ± 83.9 a | 329.6 ± 25.1 a | 2128.2 ± 230.6 a |
| Mg5 | 136.0 ± 5.8 a | 922.5 ± 62.2 a | 310.7 ± 16.1 a | 2003.0 ± 123.7 a |
| Mustard | ||||
| C | 297.4 ± 5.0 a | 889.5 ± 77.3 a | 394.3 ± 14.0 a | 3431.8 ± 224.7 a |
| Mg1 | 285.8 ± 16.7 a | 885.8 ± 84.3 a | 355.9 ± 28.9 a | 3919.3 ± 148.4 a |
| Mg2 | 304.6 ± 23.5 a | 827.4 ± 45.9 a | 309.6 ± 6.6 a | 2974.2 ± 362.4 a |
| Mg3 | 321.6 ± 5.9 a | 936.7 ± 71.4 a | 308.3 ± 19.3 a | 3275.4 ± 167.7 a |
| Mg4 | 309.7 ± 9.9 a | 962.5 ± 28.9 a | 318.1 ± 8.2 a | 3499.8 ± 100.7 a |
| Mg5 | 345.1 ± 31.3 a | 938.6 ± 18.2 a | 356.8 ± 24.3 a | 3730.3 ± 47.1 a |
| Broccoli | ||||
| C | 751.3 ± 31.9 b | 1008.5 ± 19.5 b | 360.4 ± 23.2 b | 1699.9 ± 2.5 b |
| Mg1 | 747.3 ± 10.8 b | 991.8 ± 21.9 b | 345.5 ± 3.9 b | 1673.9 ± 7.0 b |
| Mg2 | 741.3 ± 13.8 b | 1010.5 ± 21.5 b | 352.9 ± 3.6 b | 1694.0 ± 42.2 b |
| Mg3 | 744.8 ± 3.8 b | 993.2 ± 22.1 b | 361.8 ± 6.9 b | 1752.4 ± 24.6 b |
| Mg4 | 757.5 ± 6.4 b | 985.7 ± 17.1 b | 349.3 ± 17.0 b | 1717.2 ± 26.7 b |
| Mg5 | 882.5 ± 13.3 a | 1123.3 ± 23.5 a | 478.5 ± 13.5 a | 1884.0 ± 16.5 a |
| Basil | ||||
| C | 44.8 ± 2.7 a | 551.2 ± 86.4 a | 474.8 ± 107.9 ab | 1041.9 ± 120.0 a |
| Mg1 | 43.1 ± 5.8 a | 618.4 ± 26.7 a | 575.1 ± 50.3 ab | 1114.6 ± 30.7 a |
| Mg2 | 37.2 ± 5.2 a | 478.0 ± 5.7 a | 457.7 ± 15.3 ab | 1016.5 ± 121.4 a |
| Mg3 | 39.1 ± 1.3 a | 669.7 ± 12.2 a | 662.4 ± 10.7 a | 1135.6 ± 7.3 a |
| Mg4 | 44.4 ± 3.2 a | 524.2 ± 38.4 a | 535.1 ± 21.8 ab | 942.2 ± 114.4 a |
| Mg5 | 51.3 ± 4.2 a | 478.0 ± 53.5 a | 378.3 ± 31.1 b | 785.9 ± 45.6 a |
| Sunflower | ||||
| C | 56.3 ± 5.8 a | 430.3 ± 9.7 ab | 481.5 ± 24.1 a | 1251.10 ± 129.2 a |
| Mg1 | 47.2 ± 5.7 a | 375.5 ± 819.5 ab | 415.4 ± 50.5 a | 872.8 ± 70.0 a |
| Mg2 | 41.6 ± 2.3 a | 328.8 ± 54.0 b | 402.6 ± 45.3 a | 849.3 ± 77.9 a |
| Mg3 | 50.5 ± 2.1 a | 349.1 ± 26.5 ab | 382.4 ± 46.9 a | 906.0 ± 61.3 a |
| Mg4 | 51.6 ± 4.5 a | 471.1 ± 132.0 ab | 390.6 ± 74.1 a | 1092.3 ± 191.0 a |
| Mg5 | 61.9 ± 6.4 a | 564.5 ± 146.5 a | 478.9 ± 84.3 a | 1054.7 ± 180.7 a |
| Cucumber | ||||
| C | 78.8 ± 5.4 a | 161.1 ± 14.6 ab | 135.7 ± 8.8 a | 703.5 ± 56.1 ab |
| Mg1 | 66.1 ± 1.6 a | 154.5 ± 7.7 ab | 144.3 ± 11.5 a | 650.5 ± 14.6 ab |
| Mg2 | 73.5 ± 6.6 a | 180.9 ± 8.4 a | 145.4 ± 6.7 a | 694.5 ± 26.9 ab |
| Mg3 | 70.5 ± 5.4 a | 127.1 ± 9.9 b | 137.5 ± 11.7 a | 657.0 ± 34.3 ab |
| Mg4 | 81.2 ± 7.1 a | 144.9 ± 4.9 ab | 152.2 ± 12.3 a | 612.9 ± 28.3 bc |
| Mg5 | 83.7 ± 10.7 a | 123.2 ± 0.9 b | 169.3 ± 9.9 a | 620.6 ± 17.1 bc |
Table S3.
Yield of tested microgreen species as dependent on the applied MgSO4 treatments (g · m−2)
| Treatment | Cress | Mustard | Broccoli | Basil | Sunflower | Cucumber |
|---|---|---|---|---|---|---|
| C | 1932 ± 5 a | 2400 ± 202 a | 3183 ± 86 a | 1265 ± 54 a | 5041 ± 84 a | 3975 ± 259 a |
| Mg1 | 1949 ± 111 a | 2561 ± 131 a | 3275 ± 85 a | 1395 ± 46 a | 5021 ± 168 a | 4285 ± 213 a |
| Mg2 | 1775 ± 104 a | 2624 ± 89 a | 3446 ± 141 a | 1324 ± 112 a | 5224 ± 203 a | 4017 ± 254 a |
| Mg3 | 1691 ± 82 a | 2535 ± 46 a | 3399 ± 99 a | 1369 ± 43 a | 4674 ± 113 a | 4241 ± 104 a |
| Mg4 | 1714 ± 254 a | 2581 ± 148 a | 3180 ± 123 a | 1317 ± 58 a | 4657 ± 141 a | 3987 ± 45 a |
| Mg5 | 1858 ± 57 a | 2515 ± 140 a | 3069 ± 70 a | 1237 ± 58 a | 4610 ± 82 a | 4078 ± 69 a |