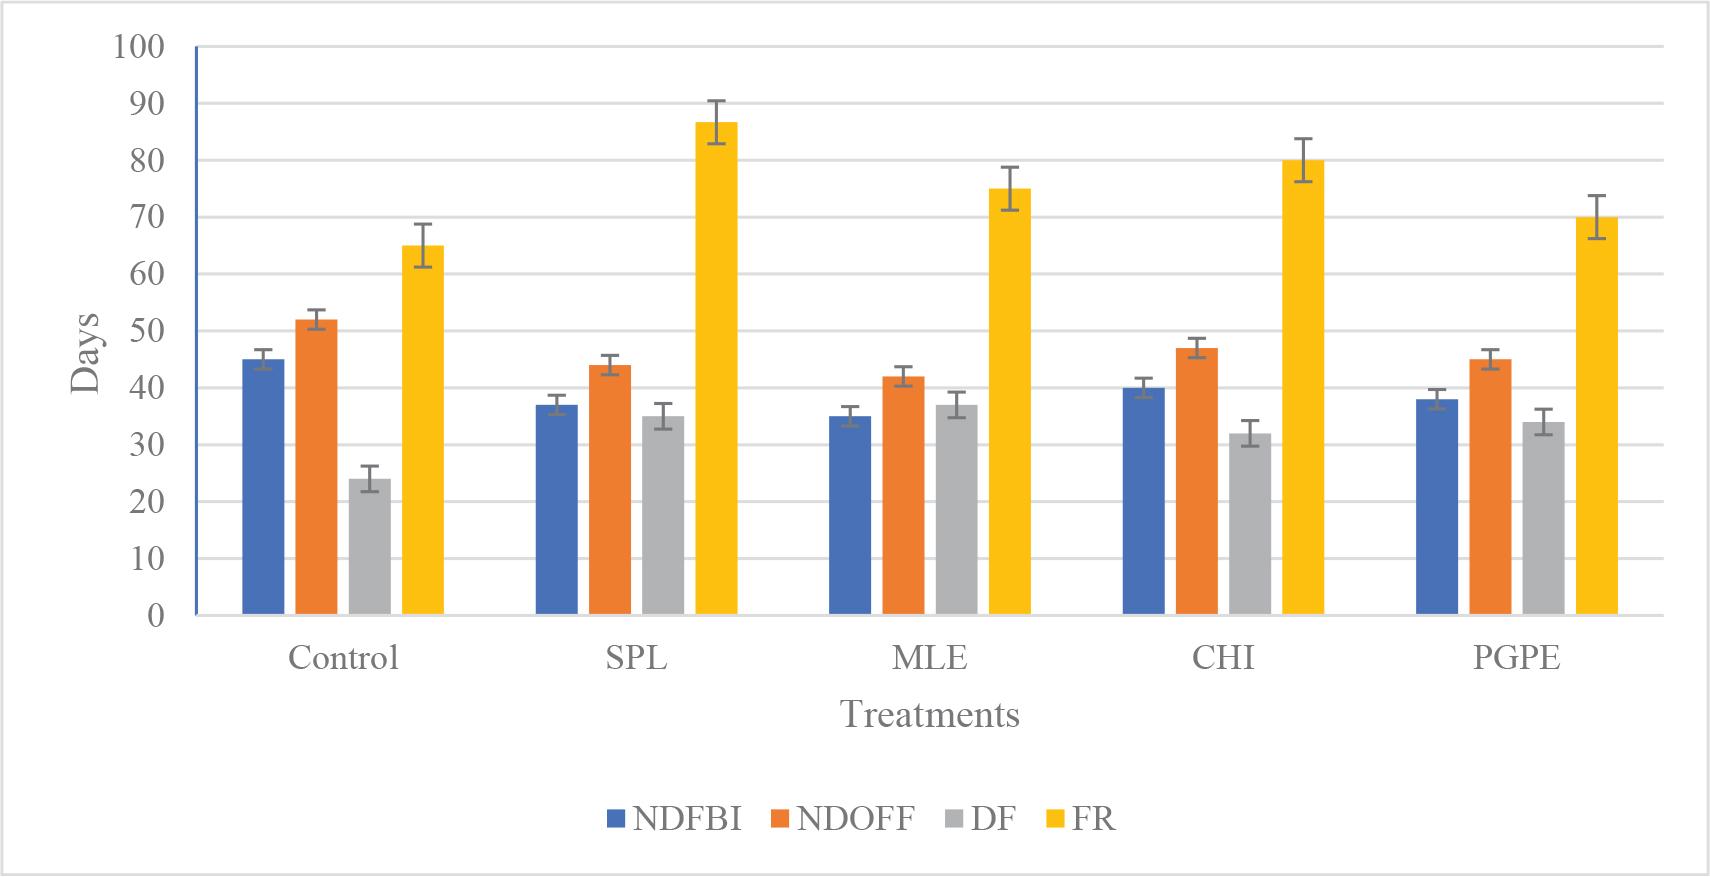
Figure 1.

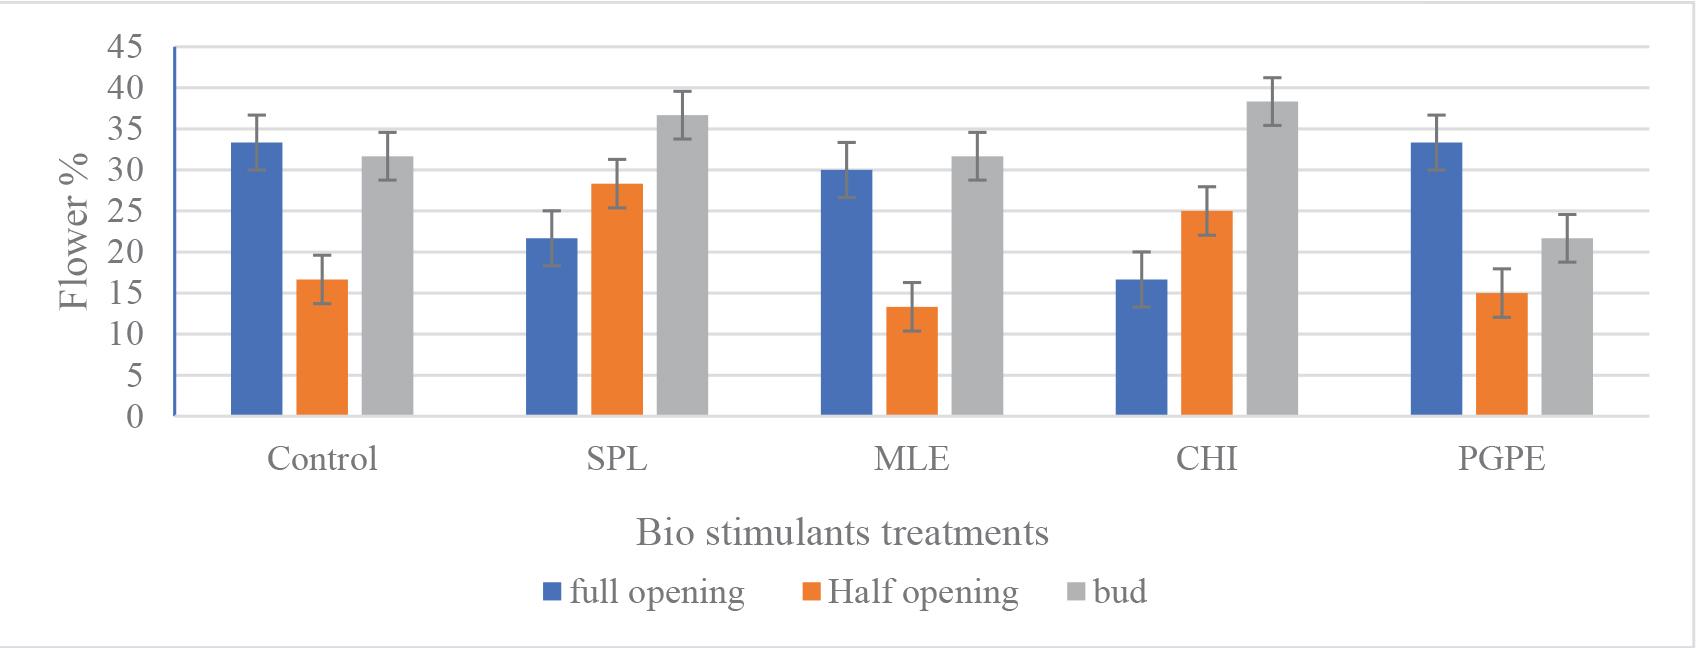
Figure 2.

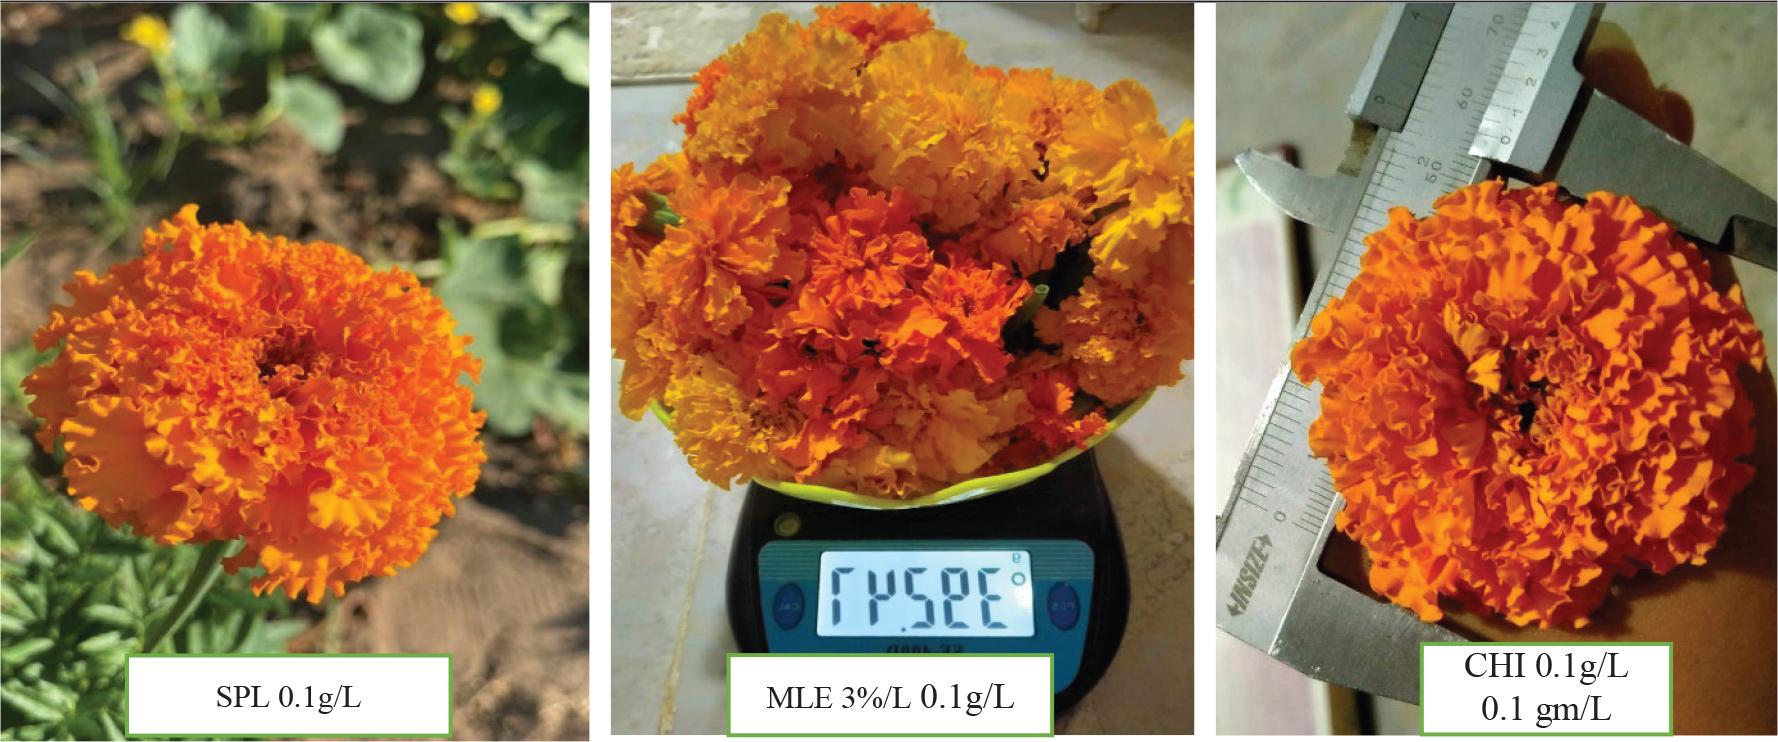
Figure 3.

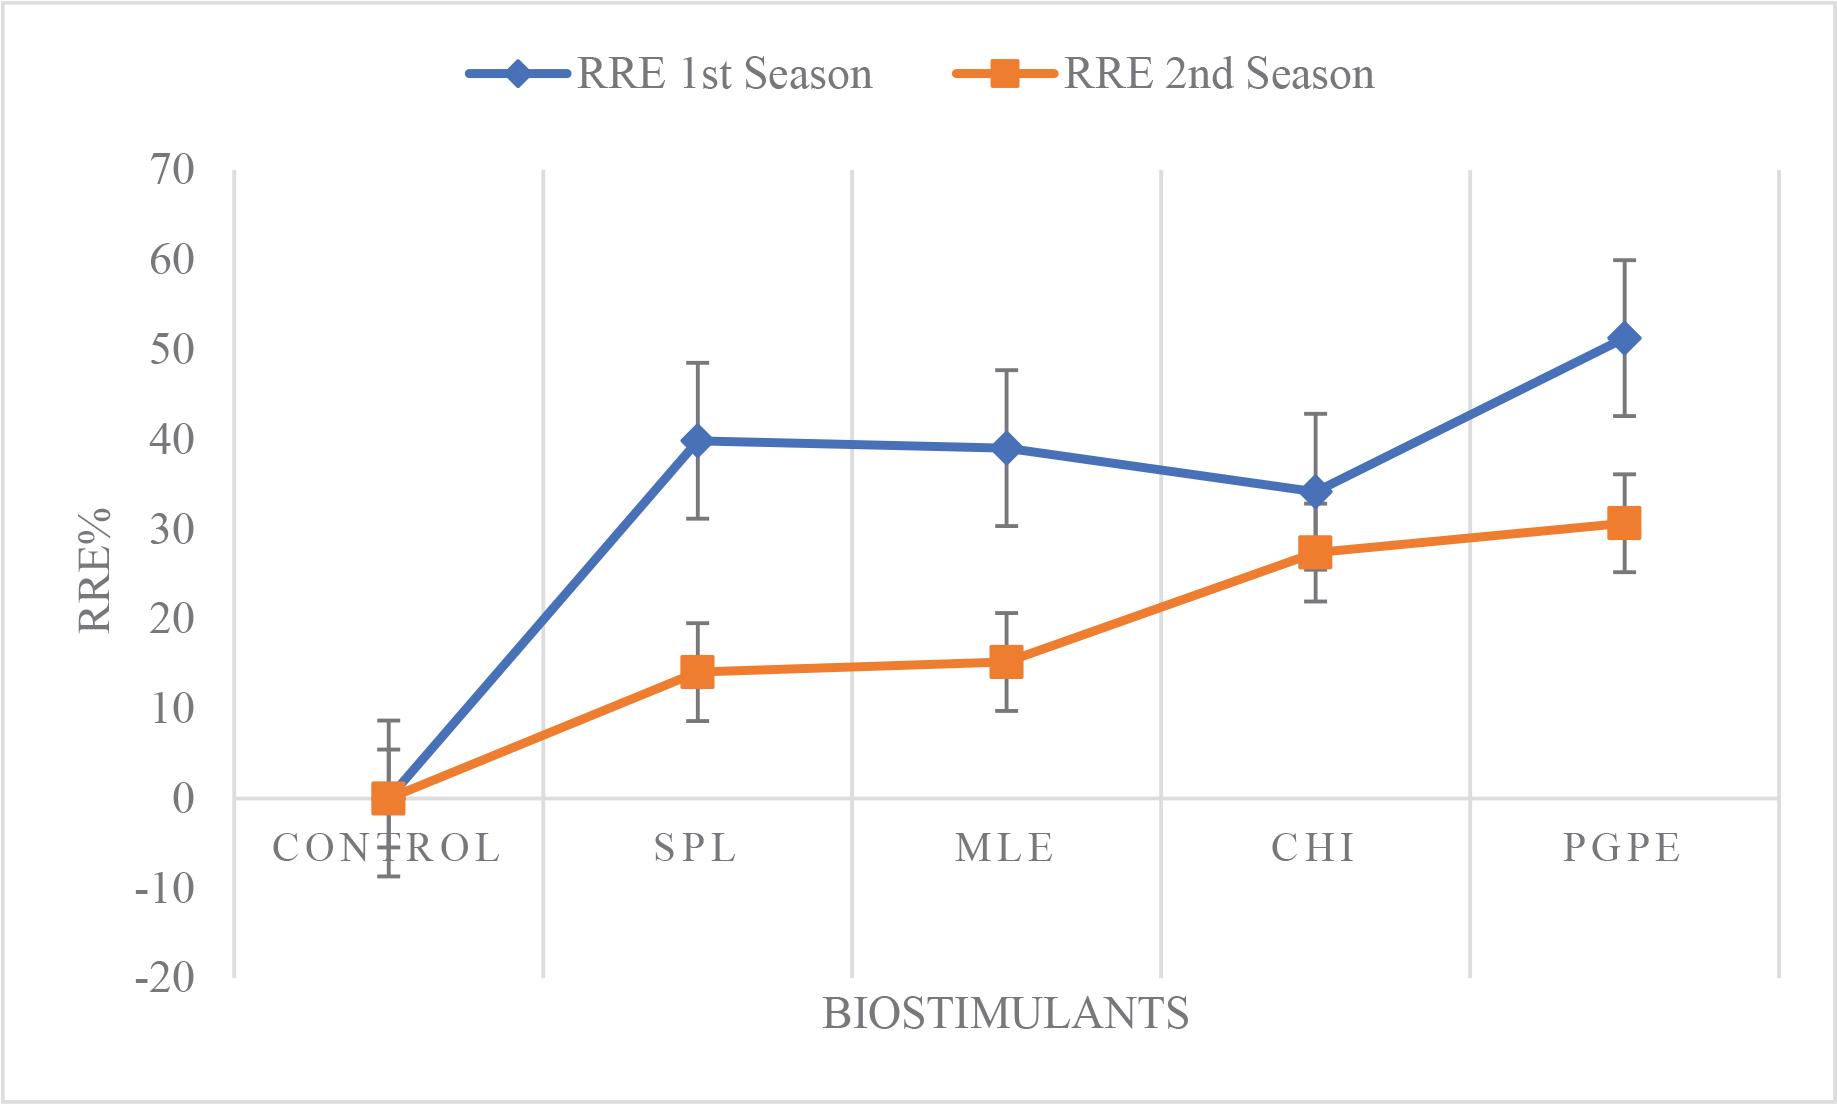
Figure 4.

Figure 5.

The quantitative phytochemical result, proximate composition and mineral composition of the aqueous fresh leaves extract of Moringa oleifera (Nweze and Nwafor, 2014)_
| Mineral composition | Value (g · 100 g−1) | Nutrient composition | Value (g · 100 g−1) | Phytochemical extract | Value (g · 100 g−1) |
|---|---|---|---|---|---|
| Nitrogen | 3.03 | Carbohydrate | 57.01 | Anthraquinone | 11.68 |
| Calcium | 2.09 | Protein | 18.92 | Tannins | 9.36 |
| Potassium | 1.62 | Fibre | 9.31 | Terpenoids | 4.84 |
| Sulphur | 0.85 | Ash | 7.95 | Flavonoid | 3.56 |
| Magnesium | 0.48 | Moisture | 4.09 | Steroids | 3.21 |
| Phosphorous | 0.44 | Fats | 2.74 | Alkaloids | 3.07 |
| Iron | 0.03 | Saponins | 1.46 | ||
| Copper | 0.01 | Carotenoids | 1.16 | ||
| Zinc | 0.005 | Cardiac glycoside | 0.36 | ||
| Anthocyanin | 0.06 |
Average values of some physical and chemical soil properties for the experimental site as mean values of the two growing seasons_
| Soil layer depth (cm) | Particle size distribution (%) | Soil-water constant | ||||||
|---|---|---|---|---|---|---|---|---|
| Sand | Silt | Clay | Texture | Bulk density (g · cm−3) | F.C 1 (%, wt/wt) | P.W.P 2 (%, wt/wt) | A.W 3 (%, wt/wt) | |
| 0–20 | 79.17 | 15.62 | 5.21 | Sandy | 6.76 | 3.7 | 1.85 | 1.85 |
| 20–40 | 89.58 | 7.29 | 3.13 | Sandy | 6.89 | 3.2 | 1.60 | 1.60 |
| 40–60 | 83.33 | 12.50 | 4.17 | Sandy | 6.85 | 3.0 | 1.50 | 1.50 |
| Mean | 84.02 | 11.81 | 4.17 | Sandy | 15.93 | 3.3 | 1.65 | 1.65 |
| Chemical soil characteristics | ||||||||
Effect of BSs treatments on the number of flowers per plant, diameter of flower (cm) and weight of flower (g) of Tagetes erecta during the 2022 and 2023 seasons_
| Treatment | Number of flowers per plant | Diameter of flower (cm) | Weight of flower (g) | |||
|---|---|---|---|---|---|---|
| 2022 | 2023 | 2022 | 2023 | 2022 | 2023 | |
| Control | 14.67 ± 2.08 c | 14.00 ± 0.0 c | 5.06 ± 0.76 d | 4.99 ± 0.18 b | 3.38 ± 0.22 d | 5.38 ± 0.85 d |
| SPL | 29.33 ± 0.58 ab | 32.00 ± 2.0 b | 5.64 ± 0.07 c | 5.49 ± 0.21 b | 5.30 ± 0.16 b | 7.31 ± 0.06 b |
| MLE | 33.00 ± 2.00 a | 38.33 ± 0.58 a | 5.65 ± 0.11 c | 5.49 ± 0.29 b | 5.50 ± 0.16 ab | 7.49 ± 0.06 ab |
| CHI | 25.33 ± 1.53 b | 29.33 ± 0.58 b | 6.69 ± 0.10 a | 6.46 ± 0.34 a | 5.82 ± 0.15 a | 7.67 ± 0.09 a |
| PGPE | 27.67 ± 1.53 b | 31.00 ± 1.0 b | 6.30 ± 0.13 b | 6.33 ± 0.25 a | 4.62 ± 0.23 c | 6.60 ± 0.09 c |
Some agro-meteorological data for the Damietta region (31° 25′ N Latitude, 31° 49′ E Longitude), during the 2022 and 2023 seasons_
| Months | Temp (C°) | RH (%) | WS (m · s−1) | Ep (mm · day−1) | RF (mm · month−1) | |||
|---|---|---|---|---|---|---|---|---|
| Min. | Max. | Mean | ||||||
| 2022 | April | 23.32 | 15.43 | 18.93 | 71.34 | 4.10 | 5.50 | 0.00 |
| May | 26.77 | 18.95 | 22.50 | 67.16 | 4.30 | 6.60 | 0.00 | |
| June | 30.27 | 23.17 | 26.35 | 65.58 | 3.22 | 7.85 | 0.00 | |
| July | 31.67 | 24.75 | 27.94 | 64.28 | 4.20 | 8.25 | 0.01 | |
| August | 31.74 | 25.80 | 28.32 | 65.50 | 4.17 | 7.57 | 0.00 | |
| Mean 2022 | 28.75 | 21.62 | 24.81 | 66.77 | 4.00 | 7.15 | 0.00 | |
| 2023 | April | 23.95 | 16.31 | 19.68 | 62.70 | 4.38 | 5.69 | 0.26 |
| May | 26.53 | 19.08 | 22.36 | 64.97 | 4.52 | 6.43 | 0.02 | |
| June | 29.83 | 22.51 | 25.76 | 65.91 | 4.32 | 7.39 | 0.07 | |
| July | 33.34 | 25.58 | 29.04 | 64.06 | 4.20 | 8.46 | 0.00 | |
| August | 31.92 | 25.88 | 28.51 | 65.79 | 4.00 | 7.57 | 0.00 | |
| Mean 2023 | 29.11 | 21.87 | 25.07 | 64.69 | 4.28 | 7.11 | 0.07 | |
Effect of BSs treatments on vegetative growth parameters of Tagetes erecta during the two seasons_ 2022 and 2023
| Treatment | Plant height (cm) | Main branches number | Fresh weight of plant (g · plant−1) | Dry weight of plant (g · plant−1) | ||||
|---|---|---|---|---|---|---|---|---|
| 2022 | 2023 | 2022 | 2023 | 2022 | 2023 | 2022 | 2023 | |
| Control | 58.43 ± 1.67 c | 44.23 ±2.11 d | 12.67 ± 0.58 c | 11.33 ± 1.53 b | 174.11 ± 9.71 c | 136.89 ± 11.5 c | 30.10 ± 2.37 b | 28.86 ± 1.66 d |
| SPL | 65.40 ±2.20 be | 58.93 ± 1.70 c | 14.67 ± 0.58 b | 14.67 ±0.58 a | 282.27 ± 12.6 b | 216.61 ± 1.14 b | 50.76 ±2.31 a | 44.66 ± 1.91 be |
| MLE | 69.27 ± 1.66 b | 59.03 ± 1.85 c | 16.67 ±0.58 a | 17.00 ± 1.00 a | 364.79 ± 30.8 a | 275.49 ± 9.6 a | 51.07 ± 1.27 a | 42.21 ± 0.96 c |
| CHI | 77.33 ± 1.76 a | 72.90 ±1.35 a | 16.33 ±0.58 a | 15.67 ±0.58 a | 297.76 ± 12.06 b | 261.20 ± 17.1 a | 54.21 ± 1.38 a | 50.85 ±2.17 a |
| PGPE | 72.47 ± 1.57 b | 66.87 ± 0.23 b | 14.33 ± 0.58 b | 16.67 ±0.58 a | 306.26 ±6.01 b | 214.84 ± 2.6 b | 53.73 ± 1.85 a | 47.07 ± 1.91 ab |
Effect of BSs treatments on root parameters of Tagetes erecta during the two seasons, 2022 and 2023_
| Treatment | Root length (cm) | Roots fresh weight (g · plant−1) | Roots dry weight (g · plant−1) | RRE (%) | ||||
|---|---|---|---|---|---|---|---|---|
| 2022 | 2023 | 2022 | 2023 | 2022 | 2023 | 2022 | 2023 | |
| Control | 12.83 ± 0.76 c | 9.00 ± 0.00 d | 12.08 ± 0.57 d | 12.39 ± 0.92 d | 2.42 ± 0.29 b | 3.52 ±0.41 c | - | - |
| SPL | 14.93 ±0.21 b | 14.96 ±0.41 b | 24.52 ± 1.02 b | 19.17 ± 0.92 c | 6.53 ±0.13 a | 4.95 ± 0.36 b | 14.07 | 39.84 |
| MLE | 15.13 ± 0.45 b | 14.76 ± 0.25 be | 16.56 ± 0.85 c | 17.15 ± 0.62 c | 3.62 ± 0.40 b | 5.03 ± 0.73 b | 15.20 | 39.02 |
| CHI | 17.67 ± 0.72 a | 13.67 ± 0.47 c | 15.25 ±0.91 c | 29.61 ± 1.2 a | 6.27 ± 1.04 a | 7.53 ±0.13 a | 27.39 | 34.16 |
| PGPE | 18.50 ±0.78 a | 18.47 ± 0.76 a | 31.55 ±0.79 a | 24.41 ± 1.2 b | 6.35 ±0.73 a | 7.12 ±0.26 a | 30.65 | 51.27 |
Chemical constituents of palm pollen grains extract (PPGE) (Taha et al_, 2020)_
| Component | Unit | Value | Component | Unit | Value |
|---|---|---|---|---|---|
| Moisture | g · 100 g−1 | 28.90 ± 1.64 | Zinc (Zn) | g · kg−1 | 2.72 ± 0.12 |
| Ash | 6.20 ± 0.42 | Copper (Cu) | 3.03 ± 0.16 | ||
| Protein | 31.00 ± 1.52 | Sodium (Na) | 0.52 ± 0.02 | ||
| Total free amino acids | 30.20 ± 1.16 | Soluble phenols | 0.72 ± 0.03 | ||
| Free proline | 0.34 ± 0.01 | Total flavonoids | 0.61 ± 0.02 | ||
| Soluble sugars | g · kg−1 | 14.20 ± 0.31 | Total carotenoids | 14.20 ± 0.24 | |
| Phosphorus (P) | 9.04 ± 0.54 | Vitamin C (ascorbic acid) | 1.06 ± 0.01 | ||
| Calcium (Ca) | 2.49 ± 0.13 | Vitamin A | IU · kg−1 | 747 ± 12.40 | |
| Magnesium (Mg) | 3.42 ± 0.18 | Vitamin E | 335 ± 5.42 | ||
| Potassium (K) | 8.63 ± 0.49 | DPPH (antioxidant activity) | % | ||
| Sulphur (S) | 6.16 ± 0.32 | Phytohormones | |||
| Molybdenum (Mo) | 2.94 ± 0.16 | Indole-3-acetic acid | mg · kg−1 | 85.20 ± 1.38 | |
| Boron (B) | 2.98 ± 0.14 | Gibberellins | 4.92 ± 0.03 | ||
| Iron (Fe) | 4.55 ± 0.20 | Cytokinins | 6.74 ± 0.05 | ||
| Manganese (Mn) | 2.92 ± 0.17 |
Effect of BSs treatments on yield of flower per plant (g) and per ha (t · ha−1), and percentage yield increase of Tagetes erecta during 2022 and 2023 seasons_
| Treatment | Yield of flower per plant (g) | Yield of flower per ha (t · ha−1) | Yield increasing (%) | |||
|---|---|---|---|---|---|---|
| 2022 | 2023 | 2022 | 2023 | 2022 | 2023 | |
| Control | 49.32 ± 3.63 c | 75.37 ± 1.19 d | 2.74 ± 0.2 c | 4.19 ± 0.07 d | – | – |
| SPL | 155.52 ± 7.5 ab | 234.05 ± 15.31 b | 8.64 ± 0.4 ab | 13.30 ± 0.9 b | 68.29 | 67.79 |
| MLE | 181.71 ± 16.13 a | 287.01 ± 6.29 a | 10.10 ± 0.8 a | 15.96 ± 0.3 a | 72.86 | 73.74 |
| CHI | 147.52 ± 8.69 b | 224.90 ± 6.06 bc | 8.20 ± 0.5 b | 12.50 ± 0.3 bc | 66.56 | 66.49 |
| PGPE | 128.05 ± 13.3 b | 204.62 ± 8.04 c | 7.12 ± 0.7 b | 11.38 ± 0.4 c | 61.48 | 63.17 |
Correlation of properties of Tagetes erecta affected by BSs foliar application_
| Attributes | 1 | 2 | 3 | 4 | 5 | 6 | 7 | 8 | 9 | 10 | 11 |
|---|---|---|---|---|---|---|---|---|---|---|---|
| 1. Plant height | 1 | ||||||||||
| 2. No. of branches | 0.661** | 1 | |||||||||
| 3. Plant fresh weight | 0.670** | 0.821** | 1 | ||||||||
| 4. Plant dry weight | 0.840** | 0.745** | 0.844** | 1 | |||||||
| 5. No. flower per plant | 0.540** | 0.842** | 0.929** | 0.804** | 1 | ||||||
| 6. Flower diameter | 0.944** | 0.615* | 0.497 | 0.621* | 0.376 | 1 | |||||
| 7. Weight of flower | 0.744** | 0.865** | 0.807** | 0.923** | 0.832** | 0.635* | 1 | ||||
| 8. Flower yield per plant | 0.618* | 0.807** | 0.929** | 0.896** | 0.377 | 0.451 | 0.915** | 1 | |||
| 9. Flower yield per ha | 0.618* | 0.807** | 0.929** | 0.896** | 0.377 | 0.451 | 0.915** | 1.000** | 1 | ||
| 10. Root length | 0.868** | 0.416 | 0.534* | 0.792** | 0.425 | 0.896** | 0.792* | 0.515* | 0.430 | 1 | |
| 11. Root fresh weight | 0.296 | -0.066 | 0.354 | 0.549* | 0.466 | 0.349 | 0.549* | 0.140 | 0.299 | 0.616* | 1 |
| 12. Root dry weight | 0.634* | 0.316 | 0.364 | 0.760** | 0.428 | 0.729** | 0.760** | 0.565* | 0.445 | 0.738** | 0.664** |