
Table 1.
Ten genotypes of sweet potato used in the experiment, their local name and characteristics.
| Accession number | Local name | Characteristics |
|---|---|---|
| SR 2022/01 | Beniharuka | Purple white skin, light yellow central parenchyma |
| KS 2022/02 | Pakkadmadpor | Red skin, soft white central parenchyma |
| SR 2022/03 | Moangpurple | Dark purple skin, light purple central parenchyma |
| SR 2022/04 | Moangmaitaiwan | Dark purple skin, dark purple central parenchyma |
| SR 2022/05 | Moangokinava | Purple skin, dark purple central parenchyma |
| SR 2022/06 | Moangharumurazaki | Purple skin, purple central parenchyma |
| KS 2022/07 | Somporsidang | Red skin, orange central parenchyma |
| KS 2022/08 | Sweetthijong | White skin, soft white central parenchyma |
| SR 2022/09 | Somokinava | Red skin, dark orange central parenchyma |
| SR 2022/10 | Annoimo | Red skin, dark yellow central parenchyma |
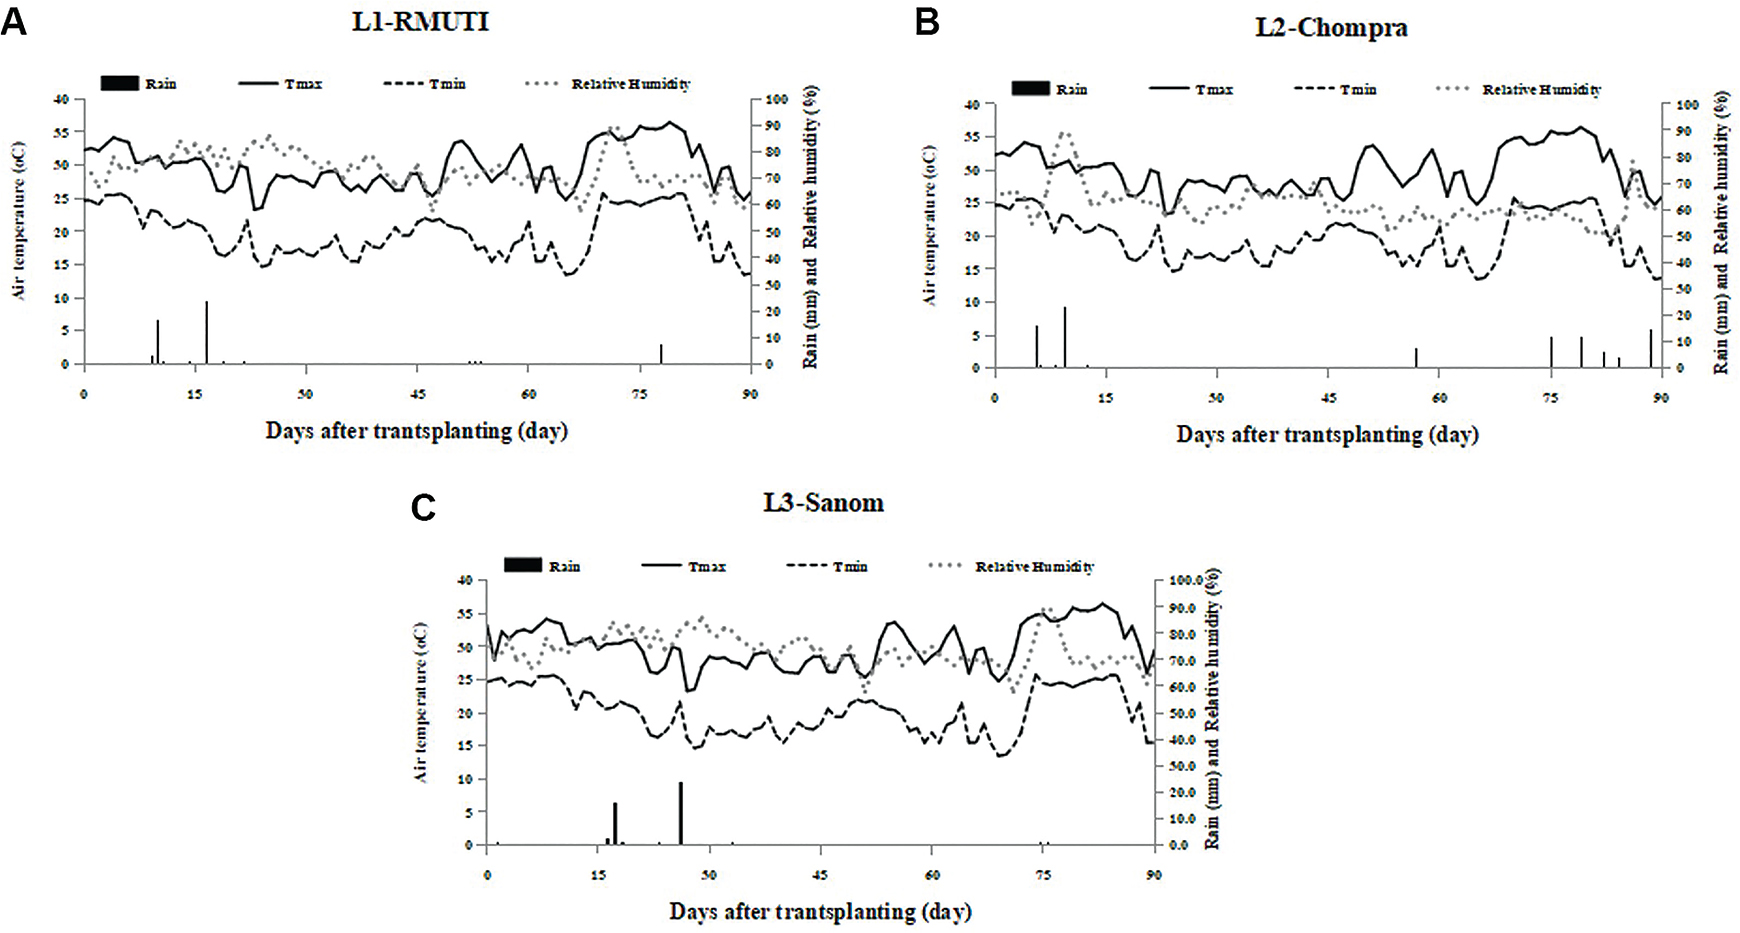
Figure 1.
Maximum temperature (Tmax; °C), minimum temperature (Tmin; °C), relative humidity (%) and rainfall (mm) in location 1 (L1-RMUTI) (A), location 2 (L2-Chompra) (B) and location 3 (L3-Sanom) (C) provinces during the growing season.
Table 2.
Physical and chemical properties of the soil samples of three locations.
| Soil properties | L1-RMUTI | L2-Chomphra | L3-Sanom |
|---|---|---|---|
| Physical properties | |||
| Sand (%) | 77.79 | 62.03 | 79.47 |
| Silt (%) | 18.19 | 29.52 | 13.13 |
| Clay (%) | 4.02 | 8.45 | 6.80 |
| Texture class | Loamy sand | Sandy loam | Loamy sand |
| Chemical properties | |||
| pH | 5.49 | 5.22 | 5.30 |
| Electrical conductivity (dS · m−1) | 0.041 | 0.028 | 0.055 |
| Cation-exchange capacity (cmol · kg−1) | 3.80 | 4.40 | 4.80 |
| Organic matter (%) | 0.50 | 1.09 | 0.81 |
| Total N (%) | 0.027 | 0.051 | 0.040 |
| Available P (mg · kg−1) | 93.75 | 23.50 | 8.75 |
| Exchangeable K (mg · kg−1) | 44.37 | 67.65 | 11.42 |
| Exchangeable Ca (mg · kg−1) | 113.93 | 189.30 | 36.31 |
| Exchangeable Mg (mg · kg−1) | 39.19 | 52.93 | 23.27 |
Table 3.
Mean squares for number for (storage root · plant−1), storage root dry weight (t · ha−1), harvest index, anthocyanin content (mg · 100 g−1 FW) and carotenoid content (mg · 100 g−1 FW) of 10 sweet potato genotypes evaluated across three locations.
| Source of variance | df | Number of storage roots per plant (storage root · plant−1) | Storage root dry weight (t · ha−1) | Harvest index | Anthocyanin (mg · 100 g−1 FW) | Carotenoid (mg · 100 g−1 FW) |
|---|---|---|---|---|---|---|
| Location (L) | 2 | 3.14**(41.81) | 5.74** (33.88) | 0.348** (78.55) | 175.68** (59.77) | 0.54 ns(2.52) |
| Error (a) | 6 | 0.03 (0.40) | 0.01 (0.06) | 0.001 (0.23) | 0.84 (0.28) | 4.16 (19.41) |
| Genotype (G) | 9 | 1.88**(25.03) | 7.39** (43.63) | 0.052** (11.74) | 64.59** (21.97) | 6.09*(28.40) |
| L × G | 18 | 2.40**(31.96) | 3.77** (22.26) | 0.041** (9.26) | 51.33** (17.46) | 7.61**(35.49) |
| Error (b) | 54 | 0.06 (0.80) | 0.03 (0.17) | 0.001 (0.22) | 1.51 (0.52) | 3.04 (14.18) |
| Total | 89 | |||||
| C.V.% (a) | 7.76 | 5.24 | 2.25 | 16.92 | 17.20 | |
| C.V.% (b) | 11.84 | 9.77 | 7.33 | 22.66 | 14.69 |
Table 4.
Means for number of storage roots per plant, storage root dry weight (t · ha ‘) and harvest index of 10 potato genotypes evaluated at three locations.
| Genotypes | Number of storage roots per plant (storage root · plant−1) | Storage root dry weight (t · ha−1) | Harvest index | |||||||||
|---|---|---|---|---|---|---|---|---|---|---|---|---|
| L1 | L2 | L3 | Means | L1 | L2 | L3 | Means | L1 | L2 | L3 | Means | |
| SR 2022/01 | 2.0 cd | 1.3 cd | 3.3 a | 2.2 B | 0.93 fg | 0.24 g | 1.66 e | 0.94 E | 0.52 be | 0.19 d | 0.72 c | 0.57 D |
| KS 2022/02 | 2.4 c | 1.5 cd | 1.7 e | 1.9 CD | 0.97 fg | 3.66 b | 0.60 i | 1.74 D | 0.37 o | 0.84 a | 0.76 b | 0.65 BC |
| SR 2022/03 | 1.6 de | 4.4 a | 2.3 cd | 2.7 A | 1.46 c-e | 6.63 a | 2.33 c | 3.47 A | 0.5 e | 0.85 a | 0.7 cd | 0.68 AB |
| SR 2022/04 | 2.1 cd | 1.4 cd | 2.7 b | 2.1 BC | 1.68 b-d | 1.63 d | 1.42 f | 1.57 D | 0.68 a | 0.62 c | 0.61 f | 0.63 C |
| SR 2022/05 | 2.2 c | 1.5 cd | 1.3 f | 1.7 DE | 1.82 be | 2.69 c | 2.28 c | 2.26 C | 0.44d e | 0.72 b | 0.77 b | 0.64 C |
| SR 2022/06 | 2.5 c | 1.3 cd | 2.5 be | 2.1 BC | 1.30 d-f | 1.01 e | 0.84 h | 1.05 F | 0.44 de | 0.37 e | 0.65 e | 0.48 E |
| KS 2022/07 | 4.3 a | 2.1 b | 1.5 ef | 2.6 A | 3.21 a | 2.95 c | 2.91 a | 3.02 B | 0.59 h-j | 0.75 b | 0.84 a | 0.72 A |
| KS 2022/08 | 2.4 c | 0.9 e | 1.5 ef | 1.6 E | 2.01 b | 0.77 ef | 2.02 d | 1.60 D | 0.47c-e | 0.47 d | 0.79 b | 0.57 D |
| SR 2022/09 | 3.6 b | 2.3 b | 2.1 d | 2.7 A | 1.21 ef | 3.52 b | 2.48 b | 2.40 C | 0.55b c | 0.86 a | 0.77 b | 0.72 A |
| SR 2022/10 | 1.2 e | 1.2 d | 2.1 d | 1.5 E | 0.54 g | 0.52 f | 1.08 g | 0.71 F | 0.57 ab | 0.51 d | 0.67 de | 0.58 D |
| Means | 2.42 A | 1.77 C | 2.08 B | 1.52 C | 2.37A | 1.77 B | 0.51 C | 0.65 B | 0.73 A | |||
| F-test | ** | ** | ** | ** | ** | ** | ** | ** | ** | |||
| C.V. (%) | 13.35 | 10.93 | 9.84 | 17.43 | 24.4 | 4.09 | 12.68 | 6.67 | 2.46 | |||
1 Means in the same column followed by a common letter are significantly different at p ≤ 0.05 by DMRT.
Table 5.
Means for anthocyanin content (mg · 100 g−1 FW) and carotenoid content (mg · 100 g−1 FW) of 10 potato genotypes evaluated at three locations.
| Genotypes | Anthocyanin (mg · 100 g−1 FW) | Carotenoid (mg · 100 g−1 FW) | ||||||
|---|---|---|---|---|---|---|---|---|
| L1 | L2 | L3 | Mean | L1 | L2 | L3 | Mean | |
| SR 2022/01 | 5.91 c | 4.41 cd | 7.03 a | 5.78 C | 12.39 ab | 11.27 ab | 13.05 a–c | 12.24 A–C |
| KS 2022/02 | 2.00 e | 10.99 b | 1.88 cd | 4.96 CD | 11.61 ab | 11.63 ab | 9.95 d | 11.06 BC |
| SR 2022/03 | 1.50 e | 12.99 b | 6.90 a | 7.13 B | 11.14 ab | 10.72 ab | 9.87 d | 10.58 C |
| SR 2022/04 | 1.55 e | 2.77 d | 1.04 d | 1.78 G | 10.29 b | 12.07 ab | 9.87 d | 10.75 C |
| SR 2022/05 | 0.98 e | 6.88 c | 6.79 a | 4.77 CD | 12.19 ab | 14.02 a | 9.98 d | 12.06 A–C |
| SR 2022/06 | 3.83 d | 4.17 cd | 3.19 bc | 3.74 EF | 12.57 ab | 13.34 a | 11.98 b–d | 12.63 AB |
| KS 2022/07 | 6.76 bc | 22.71 a | 3.54 b | 11.00 A | 10.85 b | 13.09 a | 13.97 ab | 12.63 AB |
| KS 2022/08 | 1.93 e | 3.50 d | 2.92 bc | 2.79 FG | 13.22 ab | 8.69 b | 13.04 a–c | 11.65 A–C |
| SR 2022/09 | 7.82 b | 2.83 d | 2.83 d | 4.47 DE | 14.22 a | 10.93 ab | 11.22 cd | 12.12 A–C |
| SR 2022/10 | 10.32 a | 10.98 b | 2.25 b–d | 7.85 B | 11.63 ab | 12.43 ab | 14.63 a | 12.90 A |
| Means | 4.26 B | 8.22 A | 3.83 B | 12.01 | 11.82 | 11.75 | ||
| F-test | ** | ** | ** | ** | ** | ** | ||
| C.V. (%) | 17.18 | 21.65 | 24.07 | 15.74 | 16.89 | 10.60 | ||
1 Means in the same column followed by a common letter are significantly different at p ≤ 0.05 by DMRT.
1 Different capital letters indicate significant differences between environments and between genotypes at p ≤ 0.05 by DMRT.
Table 6.
Stability analyses of storage root dry weight (t · ha−1), anthocyanin content (mg · 100 g−1 FW) and carotenoid content (mg · 100 g−1 FW) of 10 sweet potato genotypes evaluated across three locations.
| Genotypes | Storage root dry weight (t · ha−1) | b | Anthocyanin (mg · 100 g−1 FW) | b | Carotenoid (mg · 100 g−1 FW) | b | |||
|---|---|---|---|---|---|---|---|---|---|
| SR 2022/01 | 0.94 E | –1.10ns | 0.533** | 5.78 C | –0.51* | –0.075ns | 12.24 A–C | –0.60ns | 0.552ns |
| KS 2022/02 | 1.74 D | 3.51ns | 0.837** | 4.96 CD | 2.15* | –0.159ns | 11.06 BC | 4.94ns | –0.064ns |
| SR 2022/03 | 3.47 A | 6.28* | 0.257** | 7.13 B | 1.99ns | 19.258** | 10.58 C | 4.34ns | –0.876ns |
| SR 2022/04 | 1.57 D | 0.02ns | 0.027ns | 1.78 G | 0.35* | –0.419ns | 10.75 C | –0.87ns | 1.672ns |
| SR 2022/05 | 2.26 C | 0.96ns | 0.016ns | 4.77 CD | 0.61ns | 18.066** | 12.06 A–C | 4.39ns | 6.430** |
| SR 2022/06 | 1.05 F | –0.22ns | 0.076** | 3.74 EF | 0.17* | –0.324ns | 12.63 AB | 0.84ns | –0.136ns |
| KS 2022/07 | 3.02 B | –0.24ns | 0.022ns | 11.00 A | 4.23* | 0.497ns | 12.63 AB | –11.99** | –1.044ns |
| KS 2022/08 | 1.60 D | –1.56ns | 0.079** | 2.79 FG | 0.24ns | 0.114ns | 11.65 A–C | 5.95ns | 10.867** |
| SR 2022/09 | 2.40 C | 2.54ns | 0.211** | 4.47 DE | –0.49ns | 13.522** | 12.12 A–C | 12.91ns | –0.386ns |
| SR 2022/10 | 0.71 F | –0.19ns | 0.179** | 7.85 B | 1.26ns | 28.087** | 12.90 A | –9.90ns | 0.251ns |
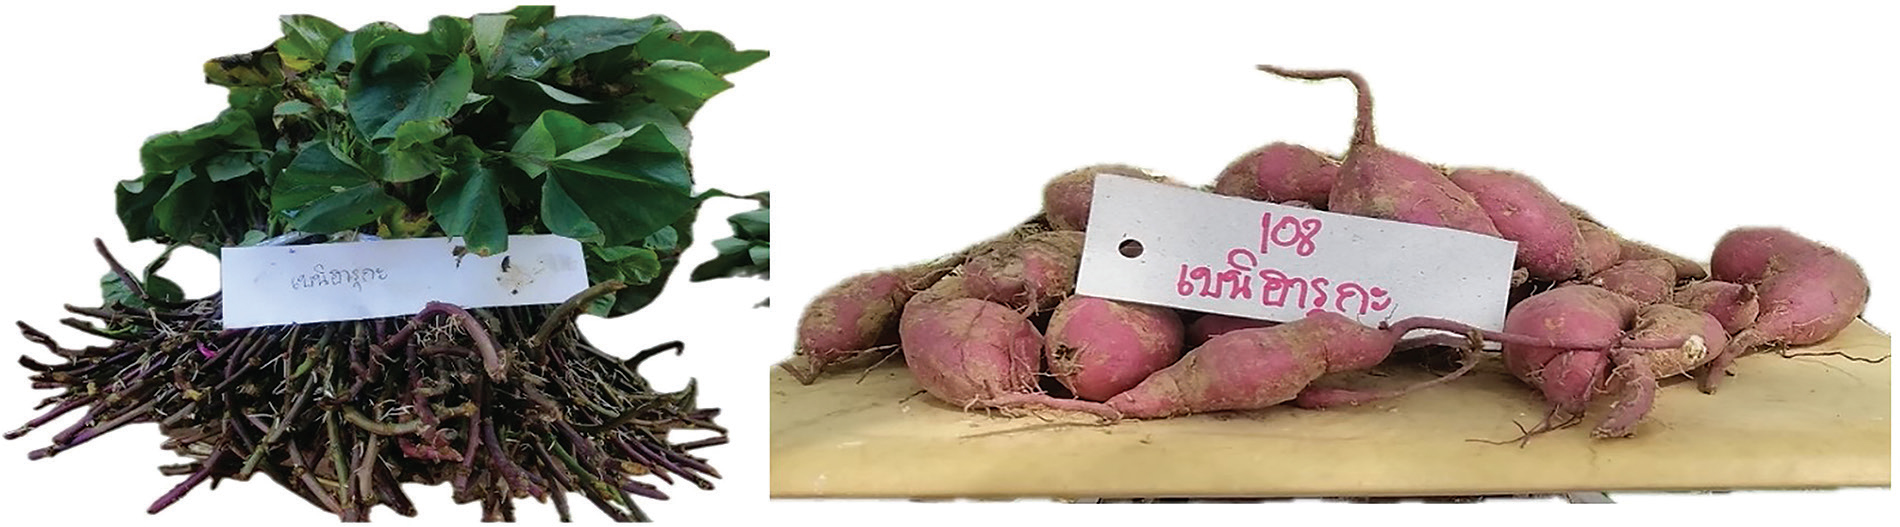
Supplementary Figure S1.
SR 2022/01 Beniharuka genotype.
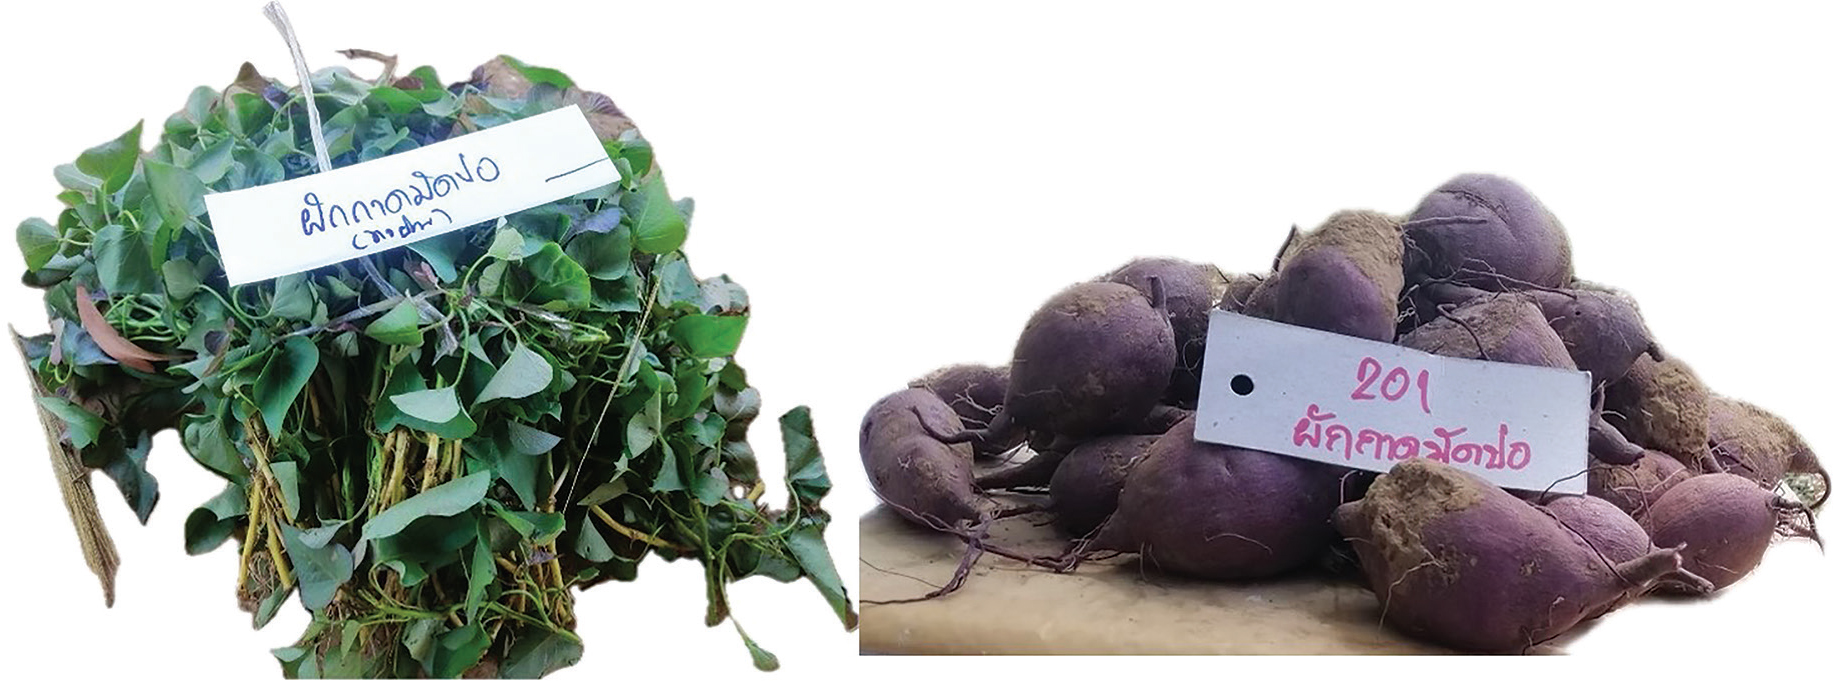
Supplementary Figure S2.
KS 2022/02 Pakkadmadpor genotype.
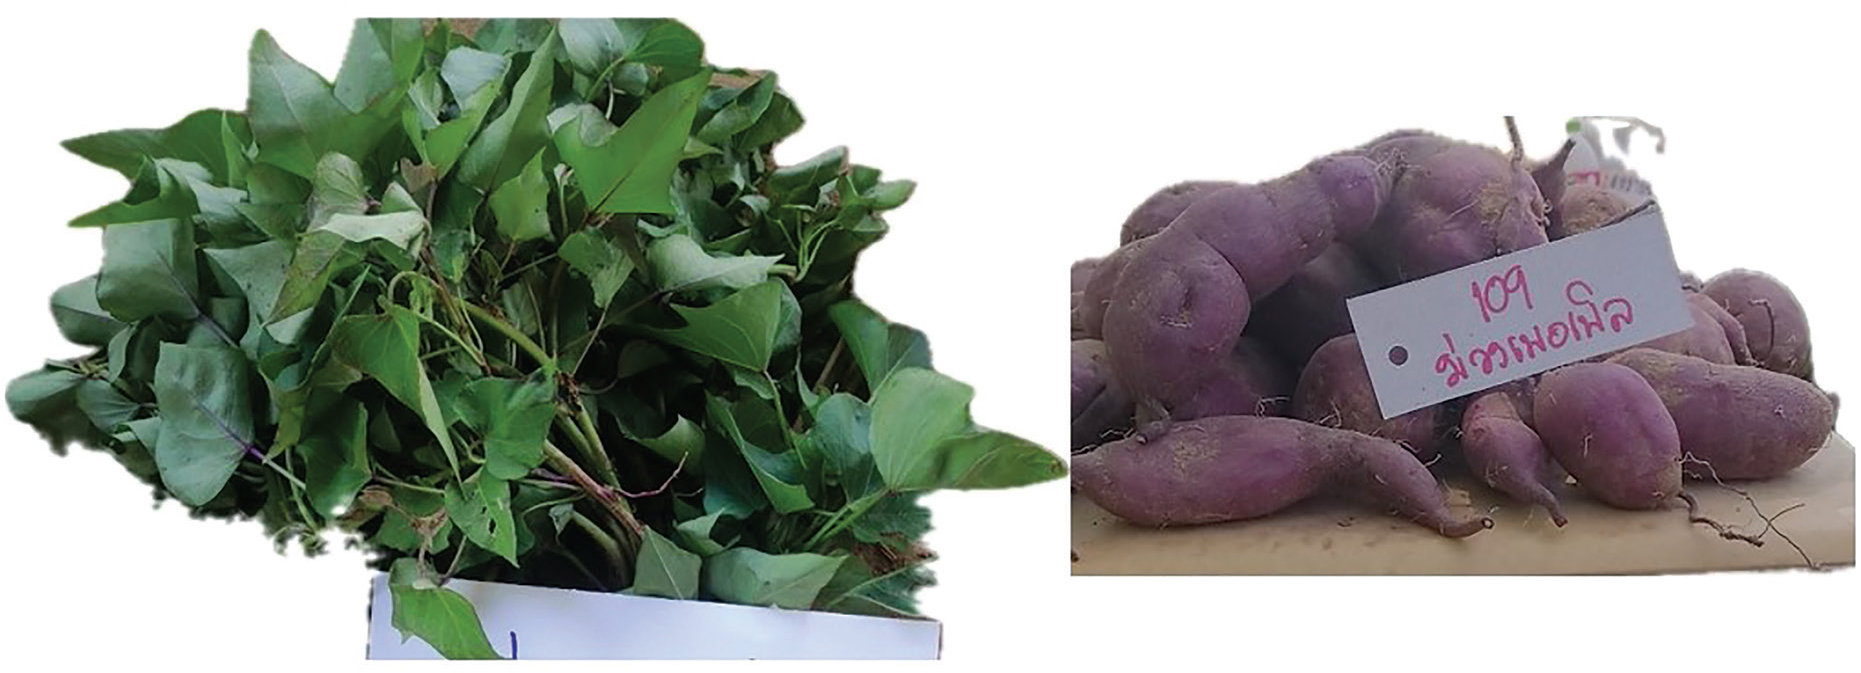
Supplementary Figure S3.
SR 2022/03 Moangpurple genotype.
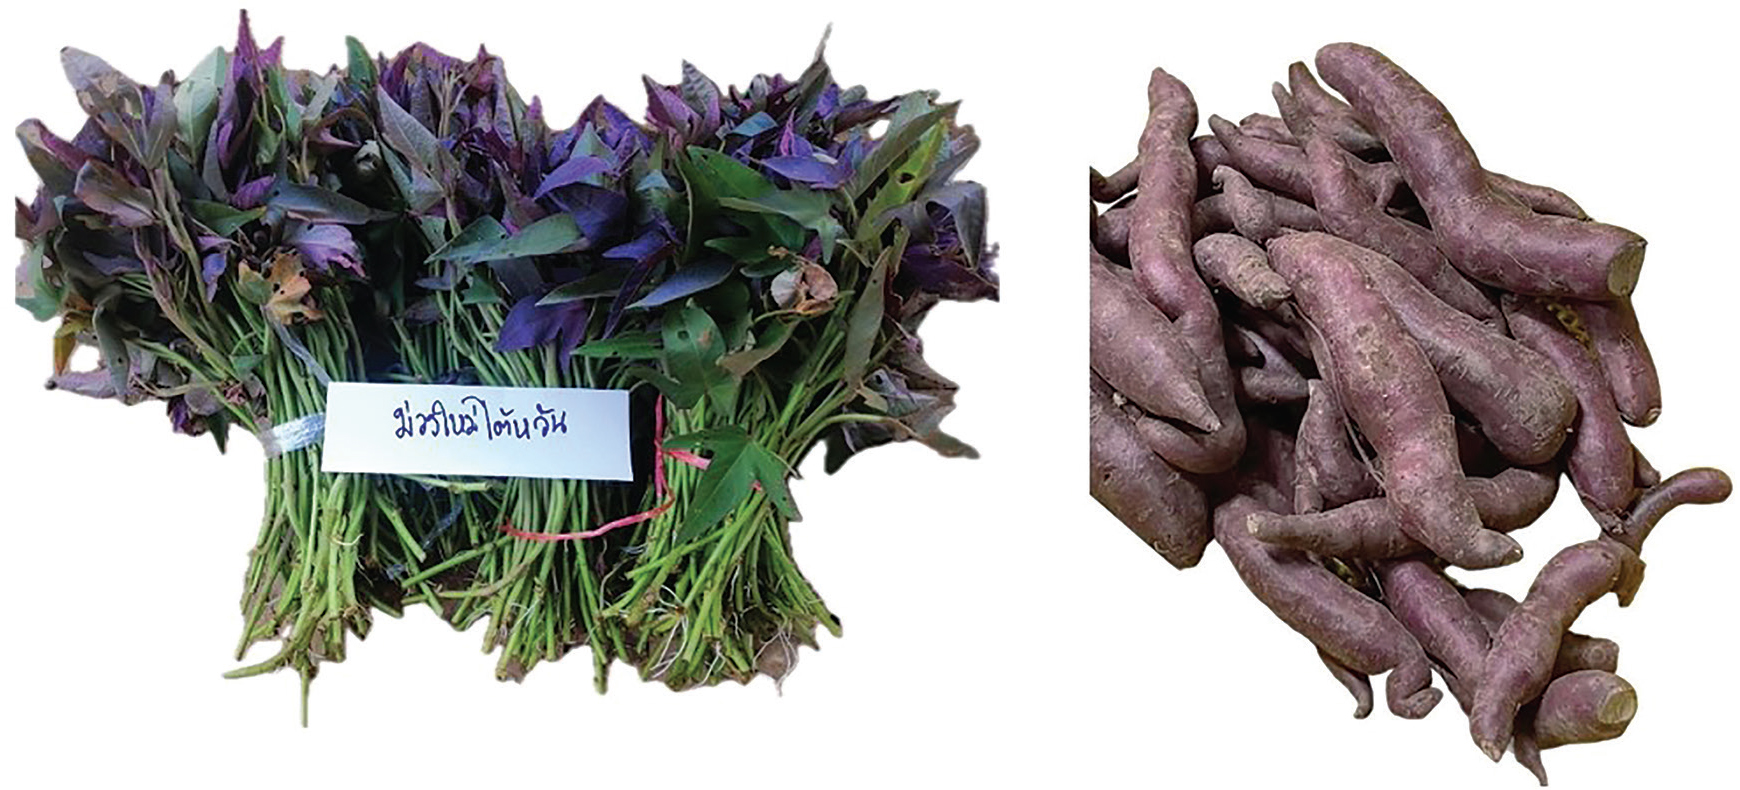
Supplementary Figure S4.
SR 2022/04 Moangmaitaiwan genotype.
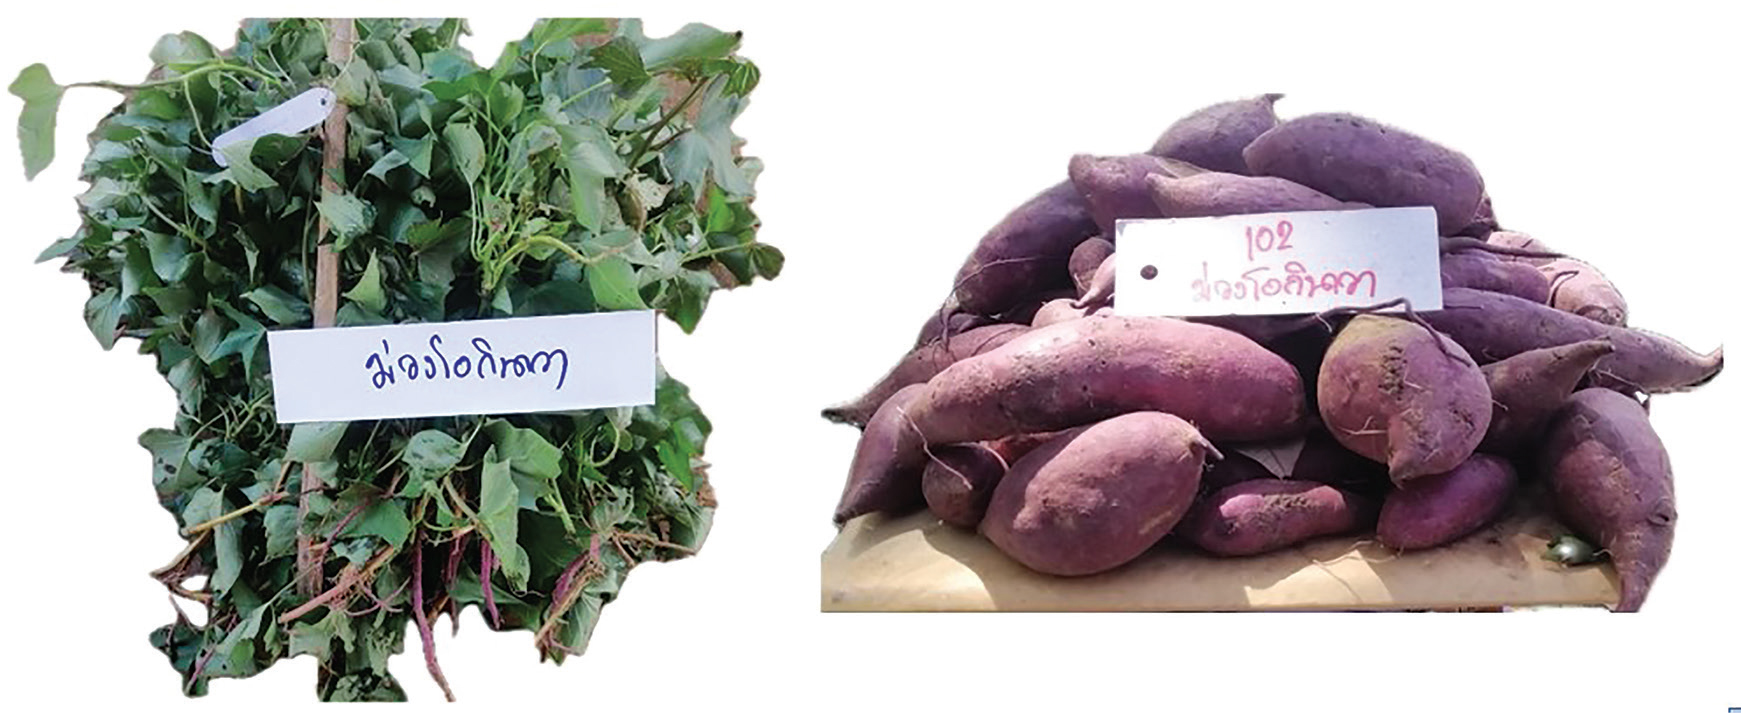
Supplementary Figure S5.
SR 2022/05 Moangokinava genotype.
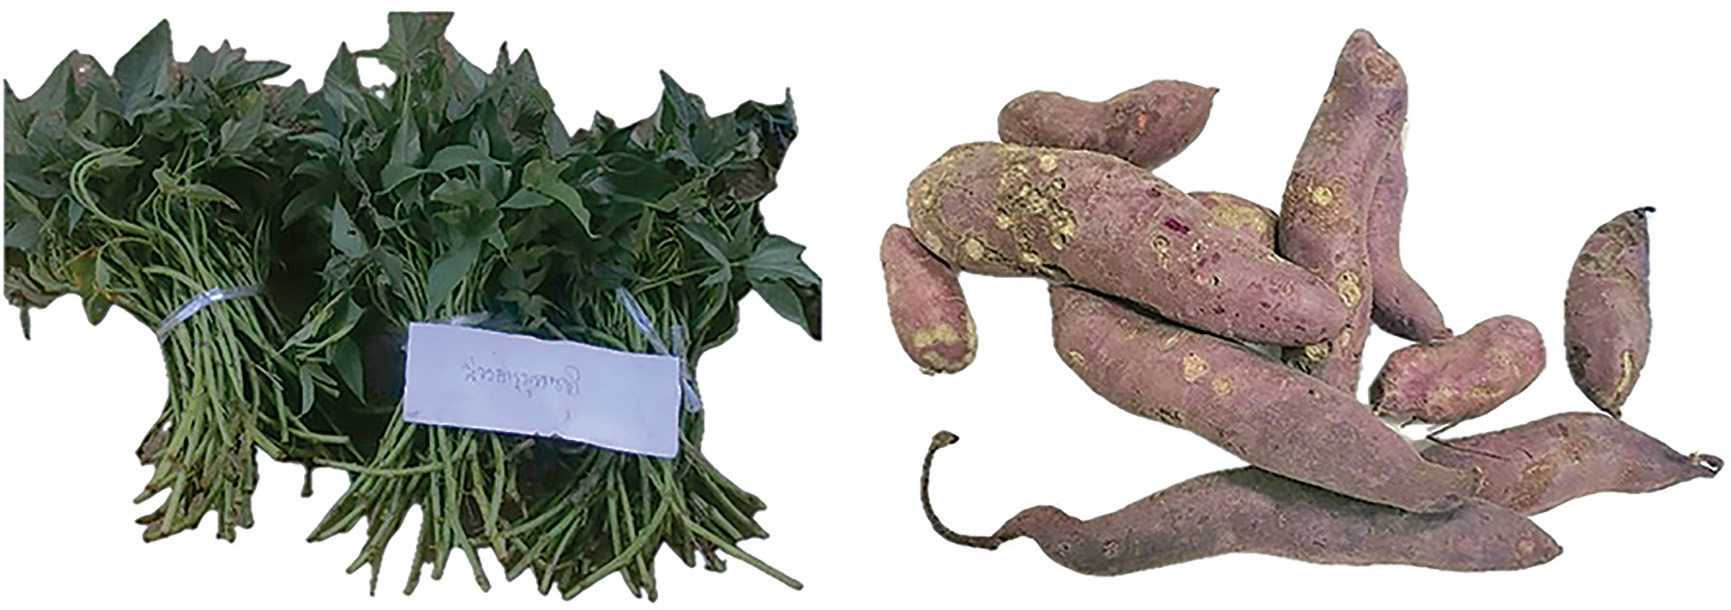
Supplementary Figure S6.
SR 2022/06 Moangharumurazaki genotype.
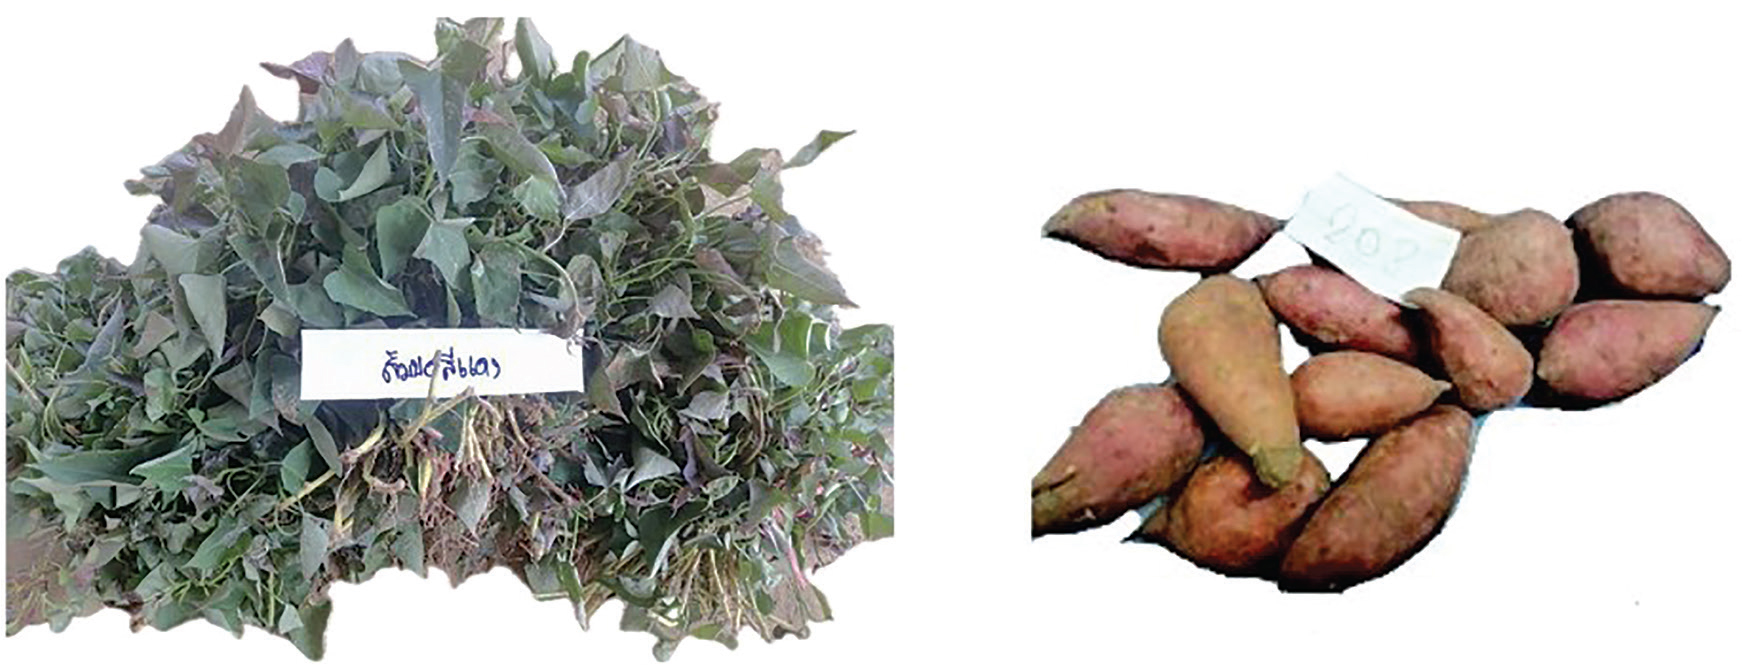
Supplementary Figure S7.
KS 2022/07 Somporsidang genotype.
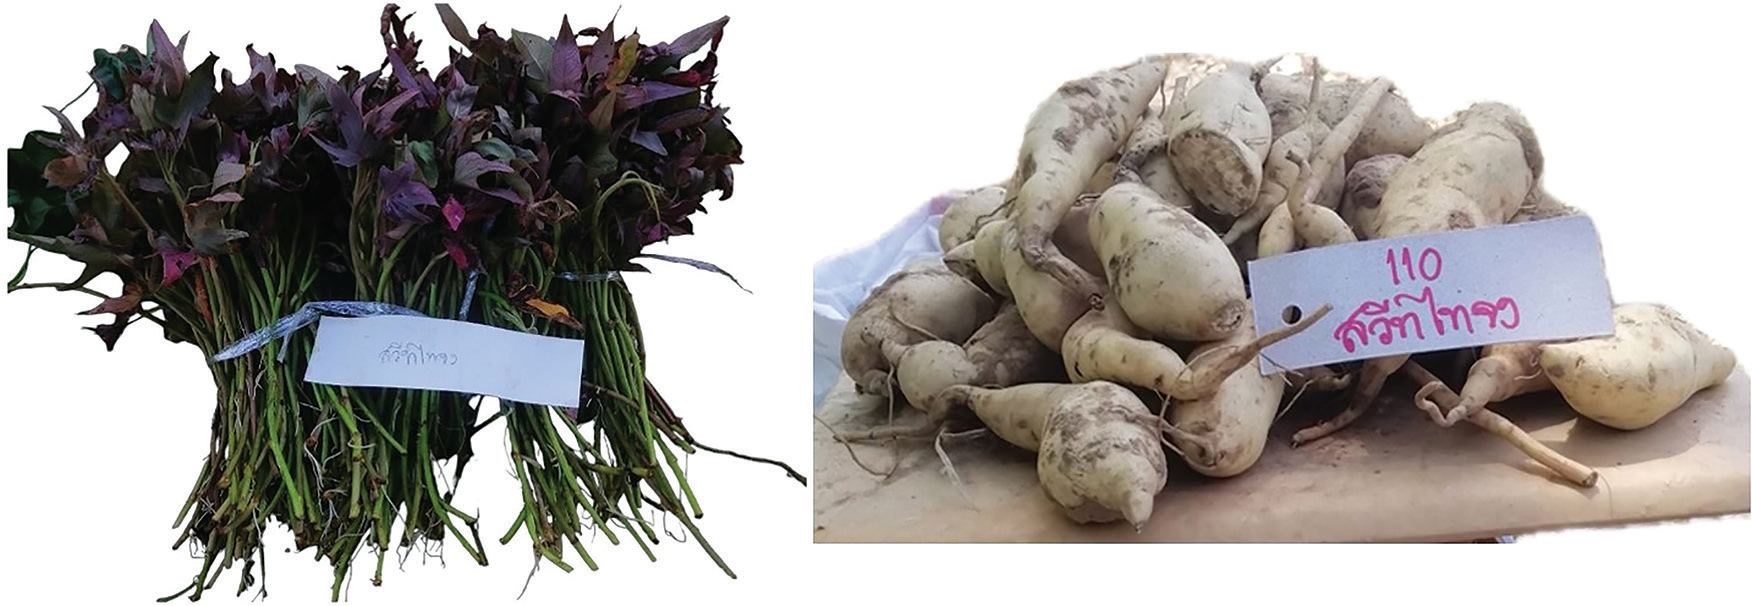
Supplementary Figure S8.
KS 2022/08 Sweetthijong genotype.
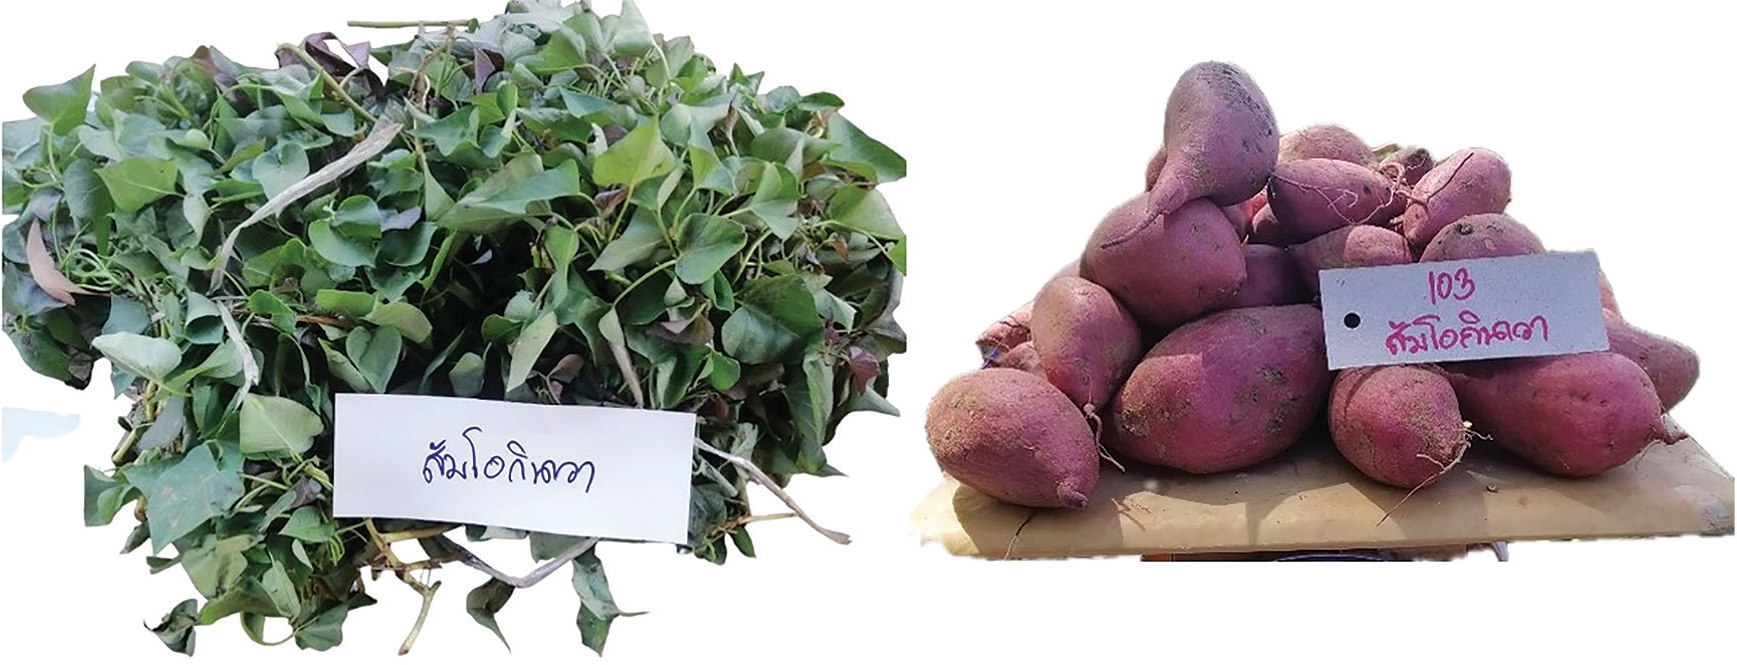
Supplementary Figure S9.
SR 2022/09 Somokinava genotype.
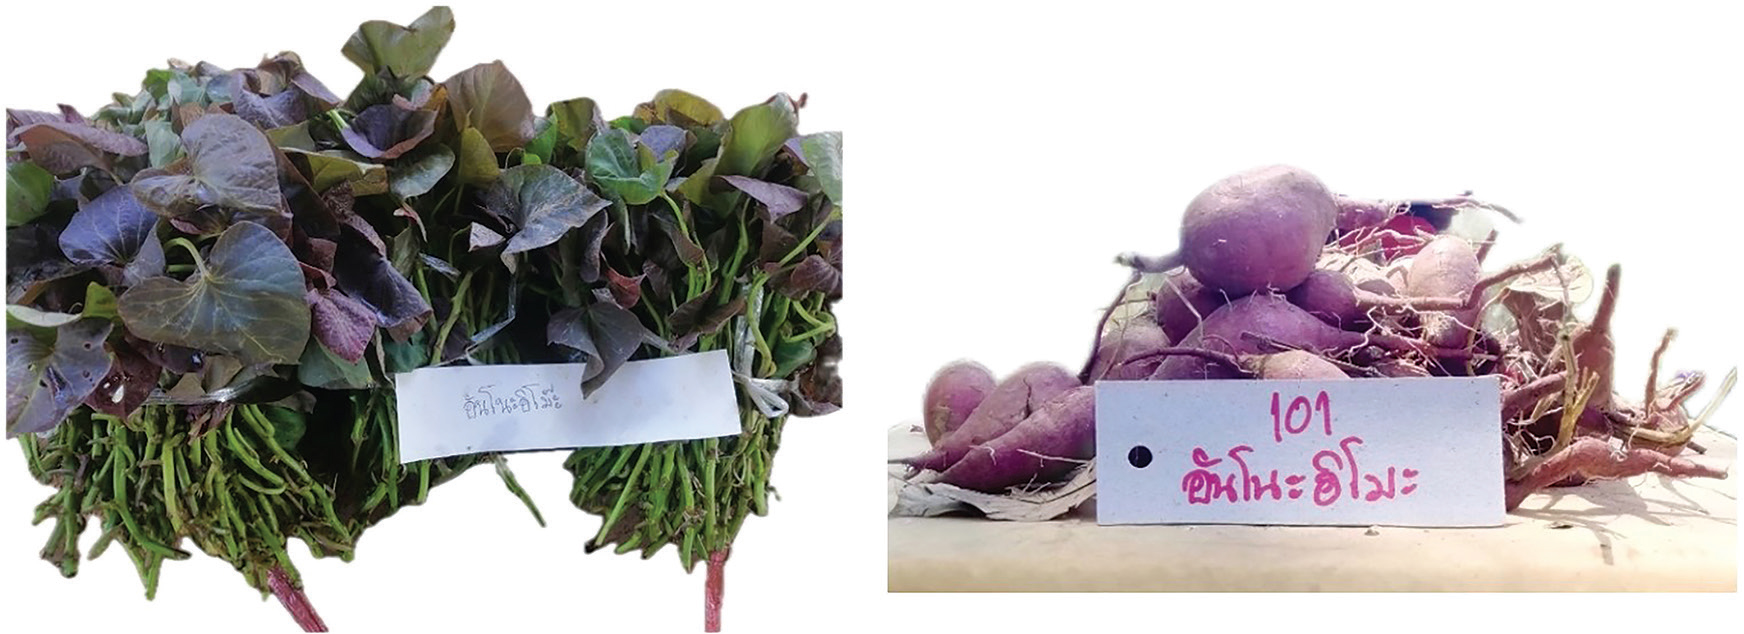
Supplementary Figure S10.
SR 2022/10 Annoimo genotype.