
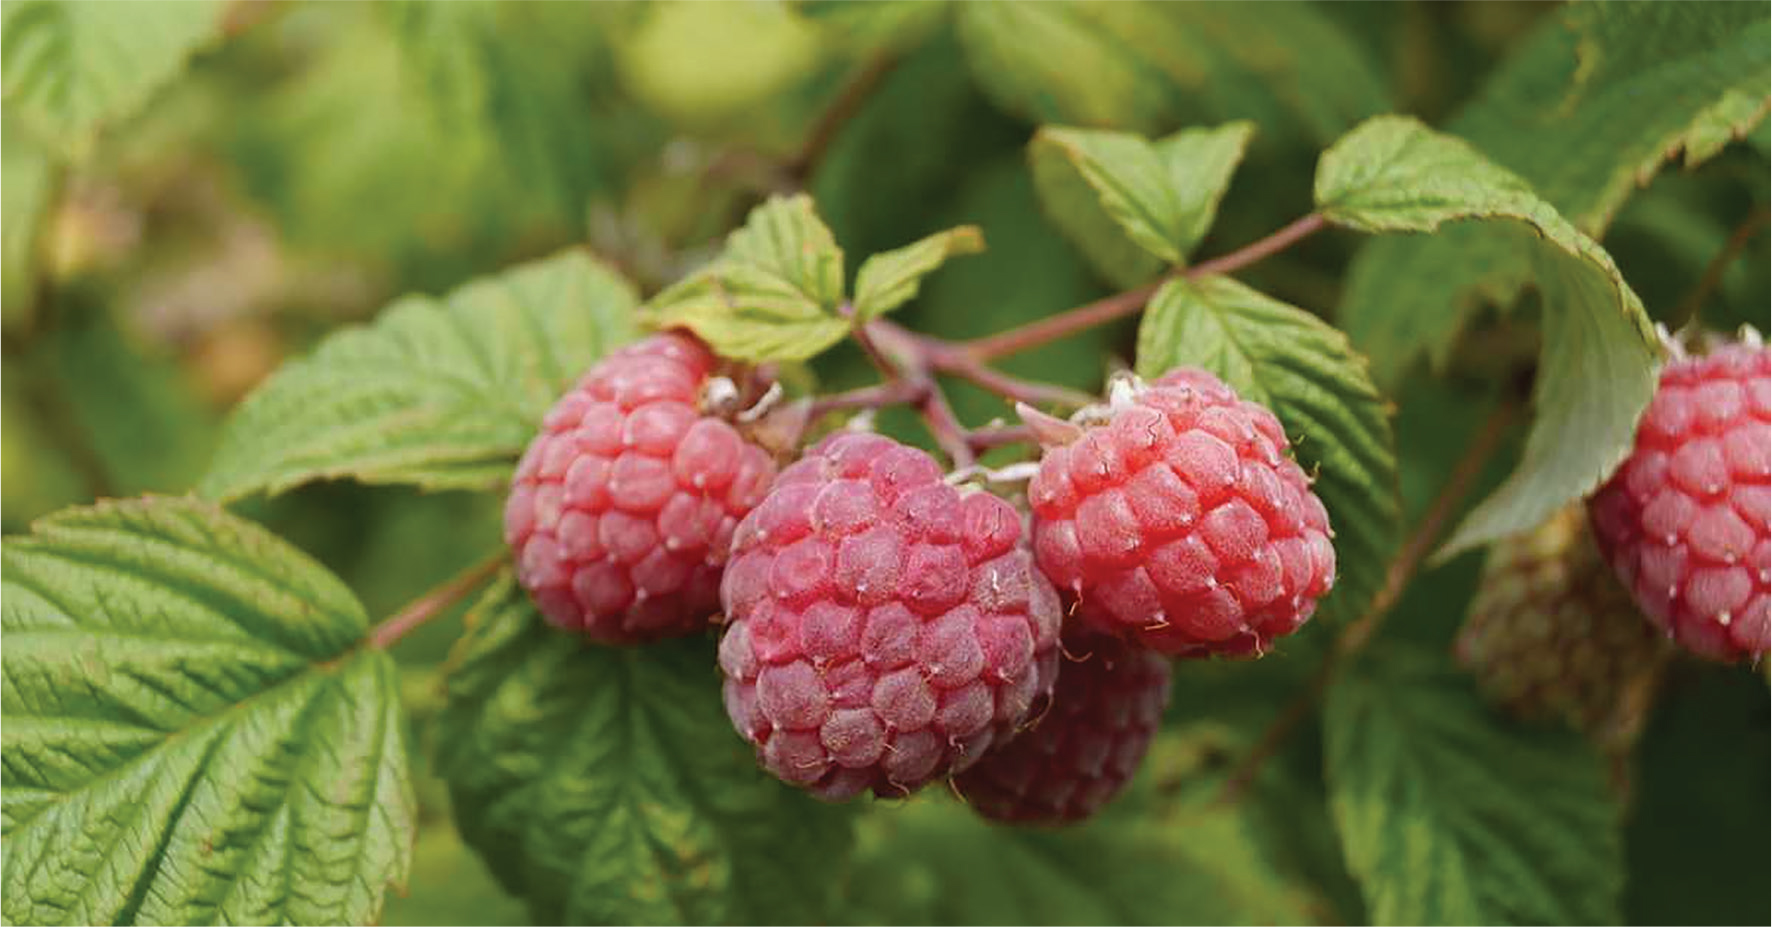
Figure 1.
Wild raspberry plants in Vercenik plateau.
Table 1.
The sensory characteristics of the fruits of 11 wild red raspberry ecotypes in 2021 and 2022.
| Aroma | Taste | Juiciness | ||||
|---|---|---|---|---|---|---|
| Ecotypes | 2021 | 2022 | 2021 | 2022 | 2021 | 2022 |
| V-1 | High | High | Sweet-Sour | Sweet | High | High |
| V-2 | Moderate | High | Sweet | Sweet | Moderate | High |
| V-3 | Moderate | Moderate | Sweet | Sweet | Moderate | Moderate |
| V-4 | High | High | Sweet | Sweet | High | High |
| V-5 | High | Moderate | Sweet | Sweet | High | High |
| V-6 | High | High | Sweet-Sour | Sweet | Moderate | Moderate |
| V-7 | Moderate | High | Sweet-Sour | Sweet-Sour | High | High |
| V-8 | High | High | Sweet-Sour | Sweet-Sour | High | High |
| V-9 | High | High | Sweet | Sweet | High | High |
| V-10 | High | High | Sweet | Sweet | Moderate | Moderate |
| V-11 | Moderate | Moderate | Sweet-Sour | Sweet-Sour | Moderate | Moderate |
Table 2.
Fruit morphological characteristics of wild-grown red raspberry ecotypes.
| Ecotypes | Fruit weight (g) | Number of drupelets | Firmness (N) | Chroma | ||||
|---|---|---|---|---|---|---|---|---|
| 2021 | 2022 | 2021 | 2022 | 2021 | 2022 | 2021 | 2022 | |
| V-1 | 1.14 ±0.18 be | 1.09 ±0.16 be | 65 ±3.8 cd | 61 ± 3.3 ab | 0.41 ± 0.2 be | 0.45 ± 0.2 ab | 29.34 ± 1.7 abc | 25.22 ± 1.6 ab |
| V-2 | 1.02 ± 0.12 d | 0.99 ± 0.10 d | 56 ±3.1 ef | 50 ±3.2 c | 0.44 ± 0.4 be | 0.51 ± 0.3 ab | 32.11 ± 1.9 ab | 30.19 ± 1.8 a |
| V-3 | 1.21 ± 0.16 b | 1.15 ± 0.17 b | 68 ±4.2 c | 63 ± 4.0 ab | 0.52 ±0.5 a | 0.56 ±0.3 a | 30.03 ± 1.6 b | 26.14 ± 1.4 ab |
| V-4 | 1.33 ±0.24 a | 1.27 ±0.20 a | 76 ± 3.0 a | 68 ±3.1 ab | 0.40 ± 0.2 be | 0.43 ± 0.4 ab | 28.30 ± 1.4 ab | 26.56 ± 1.3 ab |
| V-5 | 1.11 ±0.10 c | 1.08 ±0.11 be | 62 ± 3.2 d | 60 ± 3.4 b | 0.41 ±0.3 be | 0.46 ± 0.5 ab | 26.36 ± 1.4 c | 27.19 ± 1.6 ab |
| V-6 | 1.14 ±0.12 be | 1.11 ±0.10 be | 66 ±3.0 cd | 59 ± 3.0 b | 0.47 ± 0.6 abc | 0.53 ± 0.5 ab | 33.70 ±2.1 a | 29.06 ± 2.4 ab |
| V-7 | 1.04 ±0.10 cd | 1.02 ±0.11 c | 58 ±2.7 e | 54 ±2.8 be | 0.40 ± 0.2 be | 0.45 ± 0.3 ab | 27.30 ± 1.5 be | 28.25 ± 1.4 ab |
| V-8 | 1.07 ±0.10 cd | 1.03 ±0.10 c | 72 ± 3.8 b | 69 ±3.5 a | 0.41 ± 0.2 be | 0.47 ± 0.2 ab | 29.11 ± 1.8 be | 25.44 ± 1.6 ab |
| V-9 | 1.04 ±0.10 cd | 1.00 ±0.09 cd | 68 ±3.4 c | 62 ± 3.0 ab | 0.38 ±0.9 c | 0.40 ± 0.5 b | 31.18 ± 1.9 ab | 30.10 ±2.2 a |
| V-10 | 1.06 ±0.10 cd | 0.97 ± 0.08 d | 70 ± 4.4 be | 67 ± 4.0 ab | 0.46 ± 0.7 b | 0.47 ± 0.4 ab | 30.33 ± 1.9 b | 27.41 ± 1.8 ab |
| V-11 | 1.10 ±0.09 c | 1.06 ±0.11 be | 60 ± 3.7 de | 55 ±3.8 be | 0.43 ±0.8 be | 0.49 ± 0.6 ab | 26.11 ±2.1 c | 23.17 ± 2.0 b |
Table 3.
Organic acid content in the fruits of 11 wild-grown red raspberries.
| Ecotypes | Citric acid (g · 100 g−1 f.w.) | Malic acid (g · 100 g−1 f.w.) | Tartaric acid (g · 100 g−1 f.w.) | |||
|---|---|---|---|---|---|---|
| 2021 | 2022 | 2021 | 2022 | 2021 | 2022 | |
| V-1 | 2.46 ± 0.09 a | 2.73 ± 0.12 a | 0.66 ± 0.2 a | 0.71 ± 0.1 ab | 0.14 ± 0.01 NS | 0.17 ± 0.01 NS |
| V-2 | 2.11 ± 0.09 bc | 2.32 ± 0.10 bc | 0.59 ± 0.1 ab | 0.63 ± 0.2 ab | 0.10 ± 0.03 | 0.12 ± 0.03 |
| V-3 | 2.07 ± 0.08 bc | 2.15 ± 0.09 bc | 0.60 ± 0.1 ab | 0.55 ± 0.1 b | 0.15 ± 0.03 | 0.15 ± 0.01 |
| V-4 | 2.04 ± 0.11 c | 2.07 ± 0.10 bc | 0.50 ± 0.1 ab | 0.57 ± 0.2 ab | 0.21 ± 0.02 | 0.23 ± 0.02 |
| V-5 | 2.10 ± 0.07 bc | 2.07 ± 0.11 bc | 0.60 ± 0.2 ab | 0.64 ± 0.1 ab | 0.09 ± 0.01 | 0.14 ± 0.01 |
| V-6 | 2.32 ± 0.09 ab | 2.26 ± 0.13 bc | 0.65 ± 0.2 a | 0.68 ± 0.2 ab | 0.12 ± 0.02 | 0.10 ± 0.02 |
| V-7 | 2.41 ± 0.09 a | 2.47 ± 0.12 ab | 0.63 ± 0.1 ab | 0.75 ± 0.1 a | 0.16 ± 0.00 | 0.22 ± 0.00 |
| V-8 | 2.22 ± 0.06 b | 2.27 ± 0.14 bc | 0.63 ± 0.1 ab | 0.70 ± 0.1 ab | 0.10 ± 0.00 | 0.19 ± 0.00 |
| V-9 | 1.93 ± 0.07 bc | 1.99 ± 0.09 c | 0.57 ± 0.2 b | 0.63 ± 0.1 ab | 0.20 ± 0.02 | 0.26 ± 0.00 |
| V-10 | 2.16 ± 0.08 bc | 2.22 ± 0.09 bc | 0.58 ± 0.2 ab | 0.65 ± 0.2 ab | 0.23 ± 0.00 | 0.27 ± 0.01 |
| V-11 | 2.43 ± 0.12 a | 2.37 ± 0.14 b | 0.64 ± 0.4 ab | 0.69 ± 0.3 ab | 0.11 ± 0.00 | 0.16 ± 0.00 |
Table 4.
SSC and vitamin C in the fruits of 11 wild red raspberry ecotypes
| Ecotypes | SSC (%) | Vitamin C (mg · 100 g−1 f.w.) | ||
|---|---|---|---|---|
| 2021 | 2022 | 2021 | 2022 | |
| V-1 | 9.8 ± 0.4 cd | 10.3 ± 0.6 de | 36.3 ± 1.9 ab | 41.3 ± 2.1 ab |
| V-2 | 11.2 ± 0.6 bc | 11.5 ± 0.7 c | 29.3 ± 1.7 c | 33.4 ± 1.8 c |
| V-3 | 12.4 ± 1.0 ab | 12.2 ± 1.1 b | 33.6 ± 2.1 bc | 36.0 ± 2.0 bc |
| V-4 | 11.7 ± 0.8 b | 11.9 ± 0.7 bc | 39.7 ± 2.4 ab | 43.4 ± 2.0 ab |
| V-5 | 12.8 ± 0.7 a | 12.9 ± 1.3 a | 37.2 ± 2.2 ab | 39.1 ± 2.0 abc |
| V-6 | 10.3 ± 0.5 cd | 11.1 ± 0.6 cd | 38.8 ± 2.0 ab | 38.6 ± 2.1 b |
| V-7 | 10.5 ± 0.4 cd | 10.8 ± 0.5 d | 37.2 ± 1.8 ab | 40.3 ± 1.8 ab |
| V-8 | 9.9 ± 0.4 d | 10.2 ± 0.3 e | 40.1 ± 1.9 ab | 44.4 ± 2.1 a |
| V-9 | 11.9 ± 0.6 abc | 11.8 ± 0.7 bc | 35.5 ± 2.5 b | 38.3 ± 2.3 bc |
| V-10 | 11.6 ± 0.6 abc | 12.0 ± 0.7 bc | 35.0 ± 2.3 bc | 39.0 ± 2.2 abc |
| V-11 | 10.6 ± 0.7 c | 10.9 ± 0.5 cde | 41.4 ± 3.1 a | 42.7 ± 3.0 ab |
Table 5.
Total phenolics, total flavonoids, TA and total antioxidant capacity in the fruits of 11 wild red raspberry ecotypes.
| Ecotypes | Total phenolics (mg GAE · 100 g 1 f.w.) | Total flavonoids (mg QE · 100 g 1 f.w.) | TA (mg cy-3-g eq. · 100 g−1) | FRAP (mmol TE · 100 g−1) | ||||
|---|---|---|---|---|---|---|---|---|
| 2021 | 2022 | 2021 | 2022 | 2021 | 2022 | 2021 | 2022 | |
| V-1 | 255 ± 13.2 d | 303 ± 15.1 c | 14.8 ±0.9 cd | 15.4 ±0.8 be | 27.0 ± 0.8 e | 26.3 ±0.7 be | 17.0 ±1.0 e | 19.3 ±1.1 c |
| V-2 | 210 ± 10.9 ef | 232 ± 14.2 | 17.2 ± 1.1 a | 16.9 ± EOab | 32.1 ± El b | 28.3 ± 1.0 ab | 14.8 ± 0.9 f | 16.2 ± 0.8 de |
| V-3 | 270 ± 12.6 cd | 279 ± 11.3 d | 15.0 ±0.7 cd | 15.5 ± 0.8 b | 28.4 ± 0.9 d | 26.2 ±0.7 be | 18.2 ± 1.3 d | 19.5 ±1.0 be |
| V-4 | 233 ±11.2 e | 256 ± 12.0 e | 14.0 ± 0.8 de | 15.2 ±0.9 be | 23.2 ± 0.6 f | 23.0 ±0.5 c | 16.2 ± 0.8 ef | 17.9 ± 0.7 d |
| V-5 | 164 ± 9.8 g | 188 ± 9.2 g | 12.9 ±0.6 ef | 13.3 ±0.5 c | 19.4 ± 0.6 g | 20.3 ±0.4 cd | 13.4 ± 0.4 g | 14.6 ± 0.5 ef |
| V-6 | 362 ± 18.4 a | 390 ± 17.1 a | 16.3 ± 0.9 b | 17.6 ± 1.1 a | 33.2 ±1.3 a | 31.0 ± 1.1 a | 22.3 ±1.5 a | 23.3 ±1.4 a |
| V-7 | 355 ± 17.6 ab | 367 ± 18.0 b | 13.6 ±0.8 e | 14.2 ± 0.9 be | 22.0 ± 0.8 fg | 21.4 ±0.7 cd | 21.0 ± 1.3 b | 22.7 ± 1.2 ab |
| V-8 | 241 ± 12.0 de | 250 ± 11.1 e | 14.4 ± 1.1 d | 14.8 ± EObc | 17.3 ± 0.5 i | 17.6 ± 0.4 de | 12.0 ± 0.6 h | 15.5 ±0.7 e |
| V-9 | 296 ± 14.9 c | 308 ± 15.2 be | 15.2 ±1.2 c | 15.9 ± 1.1 ab | 30.9 ± 1.1 c | 27.9 ± 1.0 b | 19.0 ± 1.1 cd | 21.4 ± 1.4 b |
| V-10 | 188 ± 10.5 f | 204 ± 11.0 f | 10.3 ± 0.5 f | 11.8 ± 0.5 d | 30.0 ±1.2 cd | 29.6 ± 1.1 ab | 10.4 ±0.5 i | 12.3 ± 0.8 f |
| V-11 | 340 ± 16.7 b | 361 ± 18.0 b | 15.9 ± 1.1 be | 14.6 ± 1.0 be | 18.0 ± 0.5 h | 19.2 ± 0.7 d | 19.6 ±0.9 c | 20.7 ± El be |
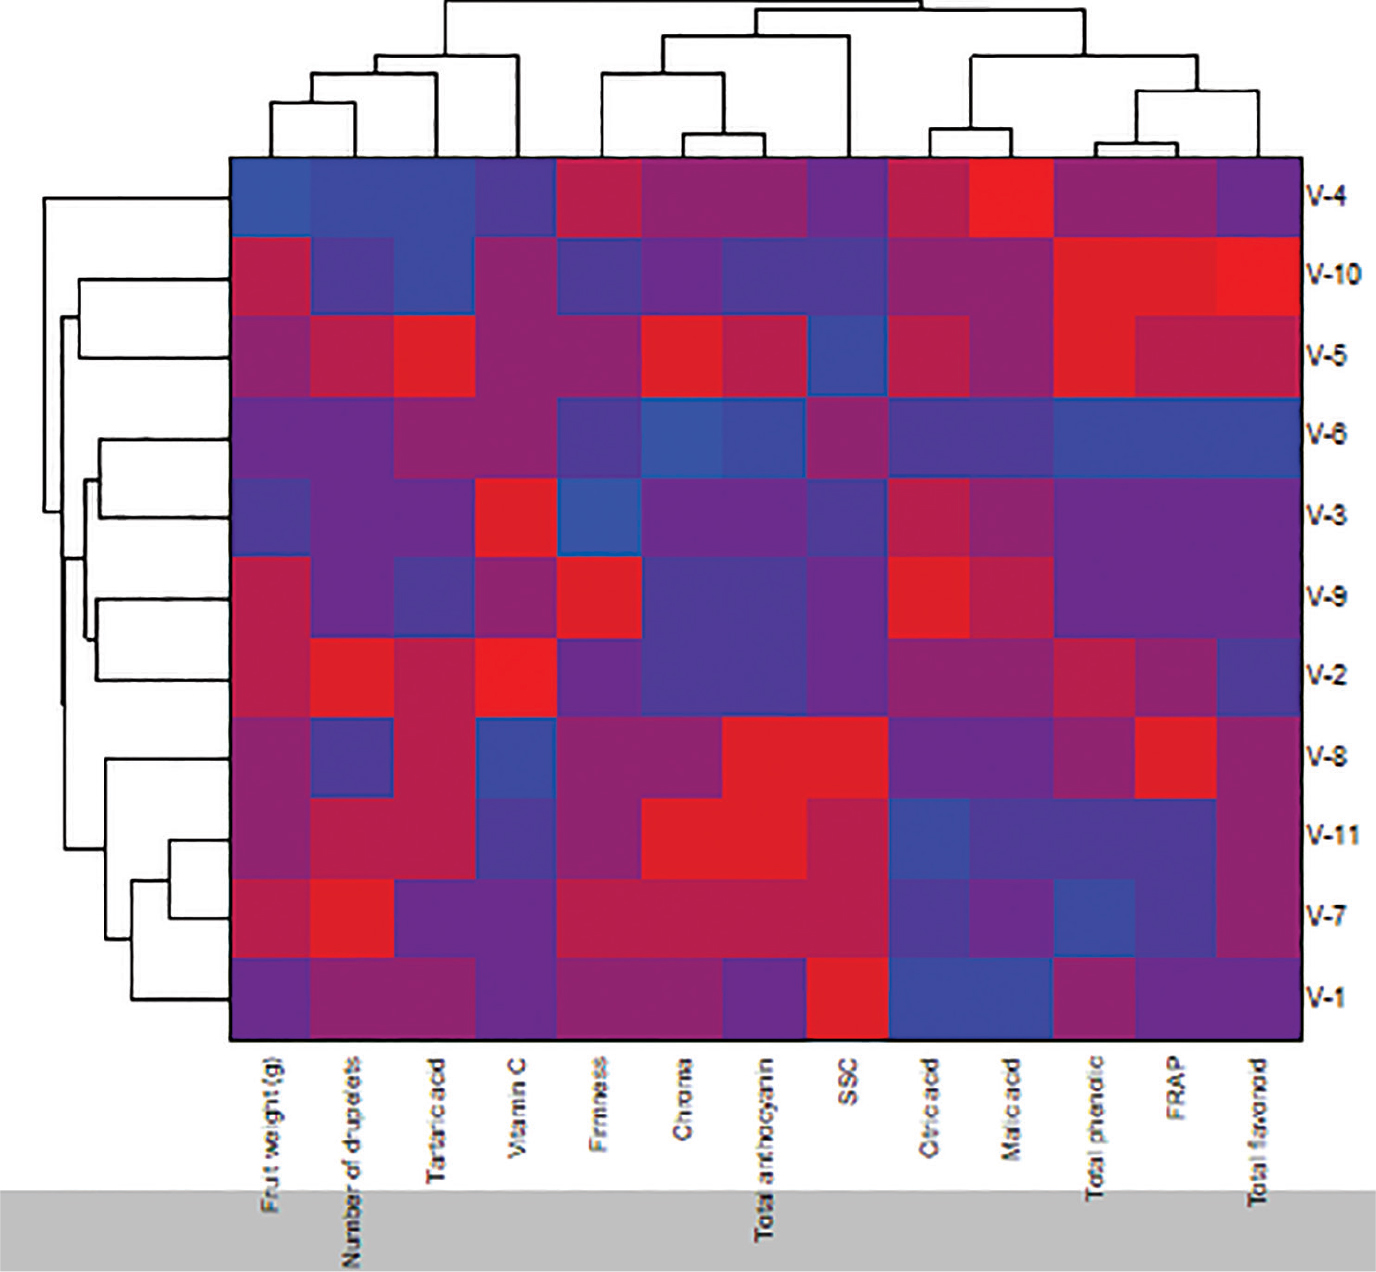
Figure 2.
Hierarchical clustering analysis. Dendrogram associated with heat map of physiological and biochemical characteristics from fruit samples of red raspberry genotypes. f.w., fresh weight; FRAP, Ferric Reducing Antioxidant Power; SSC, soluble solid content.