
INTRODUCTION
The common fig (Ficus carica L.; 2n = 2x = 26) is one of the earliest cultivated tree species from Moraceae, a family which is constituted by approximately 40 genera and over 1,400 species (Boudchicha et al., 2018). The fig was originated from a region in western Asia, between the Caspian Sea and Northeast Turkey, and has been spread through the Mediterranean basin (Stover et al., 2007; Caliskan et al., 2012; Gündeşli, 2020). Fig trees can be found throughout Turkey in the internal valleys of Central and Southeast Anatolia as well as in regions near the Black Sea, Marmara, the Aegean and the Mediterranean coast. The world fresh fig production in 2017 was more than 1 million tons and Turkey, with around 305,450 tons of annual fig production, was the top fig-producing country in the world. Turkey was followed by Algeria and Egypt with 131,798 tons and 167,622 tons of annual fig production, respectively (FAO, 2017). The fig tree has not been the subject of intensive breeding efforts. Therefore, in case of precise identification and classification, existed rich genetic diversity within the fig populations could be exploited (Perez-Jiménez et al., 2012).
Morphological characters and chemical properties are considered to be an option for the selection and classification of fruits’ germplasm (Polat et al., 2015; Gündeşli et al., 2020; Kafkas et al., 2020). The advent of DNA-based genetic characterisation methods of fruits germplasm, especially the simple sequence repeat (SSR) or microsatellite markers, have circumvented some of the limitations associated with the use of morphological traits and chemical properties in germplasm characterisation (Giraldo et al., 2004; Zavodna et al.; 2005, Bandelj et al., 2007; Chatti et al., 2010; Wang et al., 2011; Ikhsan et al., 2016; Güney et al., 2018; Güney et al., 2019; Yılmaz et al., 2020). SSRs have several advantages over morphological markers due to their co-dominant inheritance and transferability, hyper-variability and the ease of assessment (Xu et al., 2013; Zaloglu et al., 2015).
Indeed, SSRs were successfully used for genetic characterisation of figs procured from various regions of the world (Giraldo et al., 2008; Boudchicha et al., 2018; Saddoud et al., 2008; Do Val et al., 2013; Abou-Ellail et al., 2014; Ferrara et al., 2016; Costa et al., 2017). However, only a few studies using molecular markers were conducted previously on a limited number of Anatolian fig accessions. Akbulut et al. (2009) analysed 14 wild figs from the Çoruh valley located near the Black Sea coast of Turkey by RAPD markers. Similarly, Ikten et al. (2009) analysed the population structure of some female Anatolian fig accessions by DNA markers. The genetic diversity of fig accessions from the Hatay province of Turkey was evaluated through the SSR analysis by Caliskan et al. (2012). Further, Belttar et al. (2017) estimated genetic relationships among 86 fig accessions collected from Algeria and Turkey using 16 SSR primers.
In the current study, a total of 310 Anatolian fig accessions that included both male and female figs were analysed using 14 SSR markers. Possible associations between these fig accessions were examined using different structure analysis methods and a comprehensive SSR database was developed by identifying clones, synonymous (genetically similar accessions known by different names) and homonymous (genetically different accessions known by the same name) fig accessions.
MATERIALS AND METHODS
Plant material
We used 310 fig accessions which were collected from different eco-geographical sites (Figure 1) in Anatolia and deposited at the National Fig Germplasm Repository, Fig Research Institute, Erbeyli-Aydın, Turkey. The names, accession numbers, locations and the gender of the figs studied here are presented in Supplementary Table 1.
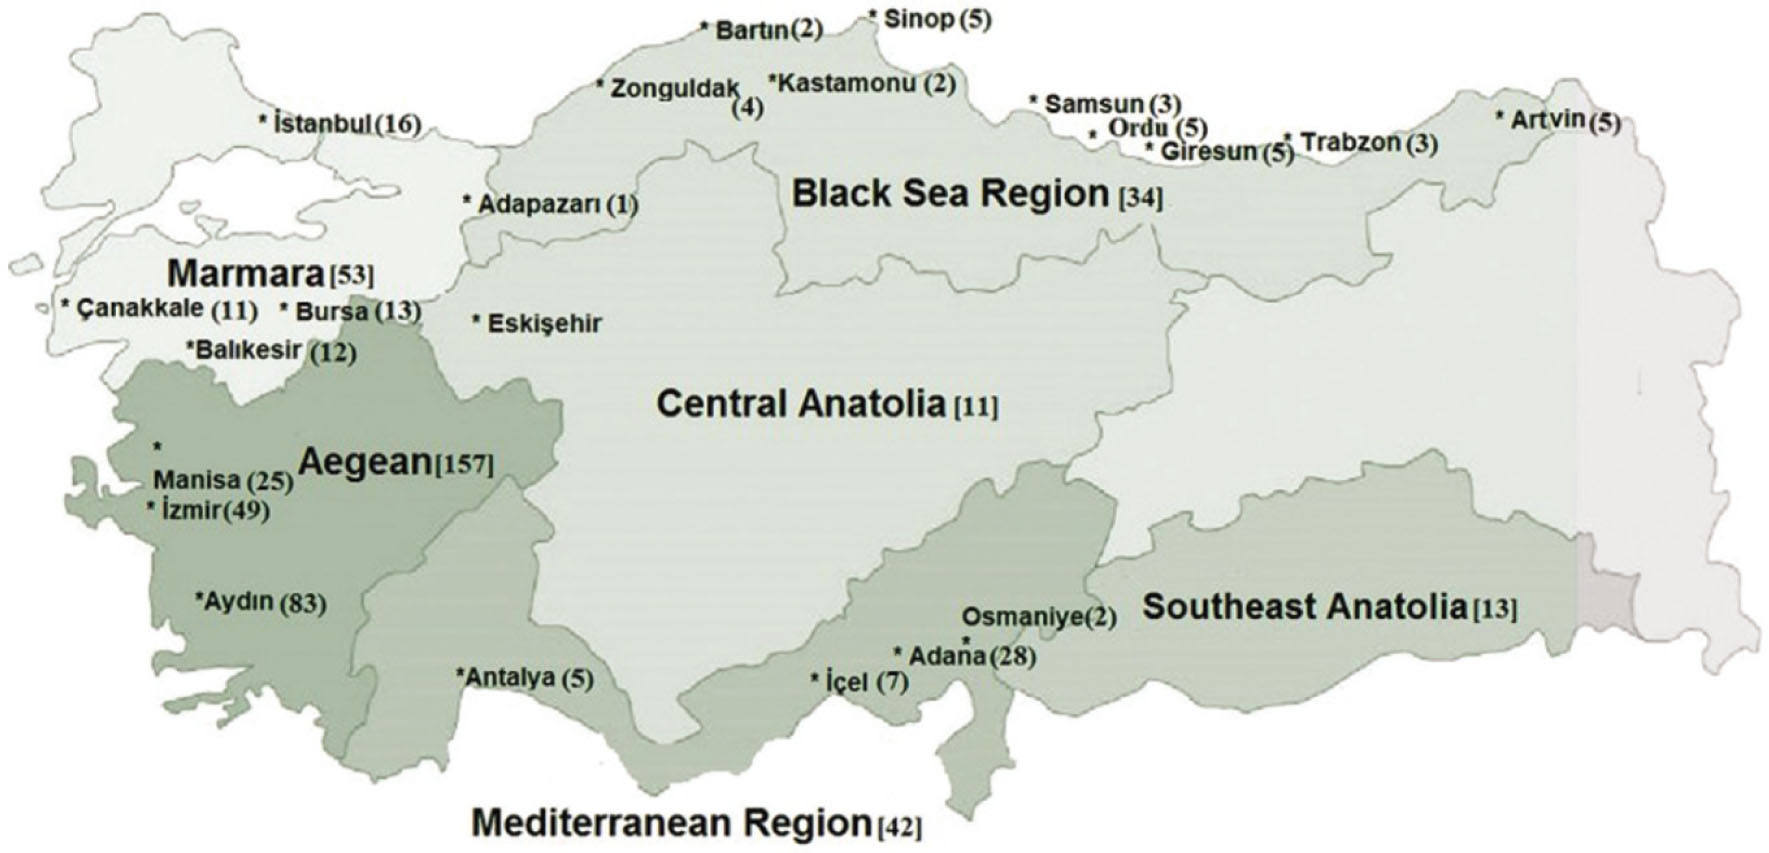
Figure 1
Eco-geographical sites of Anatolian fig accessions used in this study. The number of fig accessions collected from each different eco-geographical province is given in brackets.
DNA isolations
DNA was extracted from leaf tissue as described by Lefort et al. (1998) and its concentration was estimated spectrophotometrically as described in detail by Akçay et al. (2014) and Burak et al. (2014).
SSR analysis
Fourteen SSR markers, namely MFC1, MFC2, MFC3, MFC8 (Khadari et al., 2001), LMFC23, LMFC25, LMFC30 (Giraldo et al., 2005), FCUP068-1, FCUP038-6, FCUP008-2, FCUP070-2, FCUP027-4, FCUP066-7 (Bandelj et al., 2007) and FM4-70 (Zavodna et al., 2005) were used in this study (Supplementary Table 2). PCR amplifications were performed as previously described by Akçay et al. (2014). Briefly, 15–200 ng DNA, 0.5 mM dNTP, 5 pmol of labelled forward and reverse primers, 0.5 unit DNA polymerase (Promega) (containing 1.5 mM MgCl2) and 1 ml 10X buffer were used and a total of 10 ml of PCR reaction mixture was prepared. PCR program: 1 cycle (94°C for 3 min), 35 cycles (94°C for 1 min, 53–58°C depending on the primers for 1 min, 72°C for 2 min), followed by 72°C for 10 min and 4°C forever (Supplementary Table 2). The amplification control of PCR products was checked by 2% agarose gel electrophoresis.
Capillary electrophoresis conditions were previously described by Akçay et al. (2014) and Burak et al. (2014) in detail. A Beckman CEQ fragment analysis software was used to determine the allele size of each SSR locus. The analyses were repeated at least twice to ensure that the results are reproducible. In each run, ‘Sarılop’ and ‘Kadota’ cultivars were included as controls.
For each locus, the number of alleles (n), allele frequency, expected (He) and observed heterozygosity (Ho) and the probability of identity (PI) values were calculated as previously described (Akçay et al., 2014; Burak et al., 2014). The software IDENTITY was used to detect identical accessions; the proportion of shared alleles was calculated using Microsat (version 1.5) (Minch et al., 1995) and a dendrogram was constructed with the unweighted pair-group method with arithmetic mean (UPGMA) method (Sneath and Sokal, 1973), using the software NTSYS-pc (Numerical Taxonomy and Multiware Analysis System) (version 2.0) (Rohlf, 1988).
Excluding the Beyaz Bukele accession which showed tri allelic cases for SSR loci, the Arlequin software (Excoffier et al., 2005) was used to estimate the population genetic parameters of 309 diploid fig accessions. A neighbour-joining tree constructed from Nei's genetic distances was used (1972). Genetix 4 (Belkhir et al., 1996–1998) was used to perform factorial correspondence analysis (FCA) and gene flow estimates. We used the BAPS (Bayesian Analysis of Population Structure) software (version 6.0) (http://www.helsinki.fi/bsg/soft-ware/BAPS) (Corander et al., 2008) to analyse individual elements of data from each province to distinguish population structures. The STRUCTURE software (Pritchard et al., 2000) was employed to analyse population structures of fig accessions. In these analyses, the same computing parameters were used with the exception of measuring the K level for K:1-8 for unknown reconstructed panmictic populations (RPPs) with 25 replications as reported by Pereira-Lorenzo et al. (2018). Structure Harvester (Earl and von Holdt, 2012) was also used for the estimation of the best K value supported by the data (Evanno et al., 2005). We used Bayesian model-based clustering methods to identify RPPs. The number of accessions strongly assigned to each RPPs was determined based on the qI (probability of membership) probabilities greater than 80%.
For clone differentiation, the GenAlEx v6.5 program (Peakall and Smouse, 2012) was used to identify multilocus genotypes (MLGs) in populations. Using the same program, number of different alleles (Na), effective alleles (Ne), observed heterozygosity (Ho), Nei's (1978) unbiased expected heterozygosity (uHe) and private alleles summary (PAS) values for each population were determined.
In addition, a histogram of pairwise distances generated using the software GenoType v1.2 (Meirmans and van Tienderen, 2004) was used to determine whether somatic mutations are present. A possible number of clones (representing clone number) and Simpson's diversity based on multilocus lineages (MLLs) calculations was conducted using the GenoDive v1.1 program (Meirmans and van Tienderen, 2004). In addition, an effective number of genotypes (accessions) (eff), genotypic diversity (div), eveness (eve) and Shannon–Wiener (shw) diversity index values were calculated using the GenoDive v1.1 program. In the analysis of MLGs, different mutational threshold or T values (T shows the maximum distance allowed to identify a clone between two individuals with the same ‘MLG (accession)’ value) were tested (e.g. from threshold = 0 to threshold = 10) to minimise potential scoring errors and mutational problems. The groupings of MLGs within MLLs were considered, and the accessions with similar mutational threshold values were considered to represent the clones.
RESULTS
SSR analysis
In this study, a total of 310 fig accessions were analysed for 14 SSR loci and a total of 124 alleles were identified. The lowest number of alleles (2) was observed for the LMFC23 and the highest number of alleles (15) was found for the FCUP038-6 locus. The average allele number per locus was 7.75 and the mean He and Ho values were 0.652 and 0.685, respectively. The highest Ho values of 0.845 and 0.819 were observed for MFC1 and LMFC30, and the lowest values of 0.319 and 0.383 for MFC8 and LMFC23, respectively. FCUP038-6 with 15 alleles (PI: 0.093), FCUP070-2 with 11 alleles (PI: 0.094) and LMFC30 with 9 alleles (PI: 0.093) were the most informative loci. LMFC23 (PI: 0.600) with two alleles was the least informative locus (Table 1).
Table 1
Genetic parameters of Anatolian fig accessions examined in this study.
| Locus no | Locus name | N | He | Ho | PI |
|---|---|---|---|---|---|
| L1 | MFC1 | 6 | 0.592 | 0.845 | 0.362 |
| L2 | MFC2 | 9 | 0.706 | 0.680 | 0.198 |
| L3 | MFC3 | 8 | 0.554 | 0.409 | 0.373 |
| L4 | MFC8 | 6 | 0.339 | 0.319 | 0.505 |
| L5 | FCUP008-2 | 11 | 0.763 | 0.761 | 0.161 |
| L6 | FCUP027-4 | 9 | 0.778 | 0.732 | 0.135 |
| L7 | FCUP038-6 | 15 | 0.805 | 0.696 | 0.093 |
| L8 | FCUP066-7 | 8 | 0.701 | 0.754 | 0.240 |
| L9 | FCUP068-1 | 11 | 0.726 | 0.748 | 0.189 |
| L10 | FCUP070-2 | 11 | 0.831 | 0.764 | 0.094 |
| L11 | LMFC23 | 2 | 0.413 | 0.383 | 0.600 |
| L12 | LMFC25 | 5 | 0.521 | 0.532 | 0.424 |
| L13 | LMFC30 | 9 | 0.833 | 0.819 | 0.093 |
| L14 | FM4-70 | 6 | 0.736 | 0.658 | 0.212 |
| Mean | 7.75 | 0.652 | 0.685 | – |
[i] Allele numbers (N), expected heterozygosity (He), observed heterozygosity (Ho) and probability of identity (PI) values for the SSR loci are shown.
Genetic relationships of fig accession groups
Various genetic parameters, such as Ho and He, polymorphic loci and the mean number of alleles per locus, estimated for six fig accession groups, are summarised in Table 2.
Table 2
Expected and observed heterozygosities, polymorphic locus at both 95% and 99% probability levels and the mean number of alleles per locus in six Anatolian fig populations (sample size of each population).
| Populations (sample size of each population) | Heterozygosity | Polymorphic locus | Mean of alleles/loci | ||
|---|---|---|---|---|---|
| Hexp | Hobs | P(0.95) | P(0.99) | ||
| Aegean (157) | 0.624 ± 0.146 | 0.625 ± 0.160 | 1.000 | 1.000 | 6.86 |
| Central Anatolia (11) | 0.625 ± 0.154 | 0.623 ± 0.214 | 1.000 | 1.000 | 4.79 |
| Mediterranean (42) | 0.658 ± 0.176 | 0.668 ± 0.192 | 1.000 | 1.000 | 6.36 |
| Marmara (53) | 0.655 ± 0.193 | 0.685 ± 0.219 | 1.000 | 1.000 | 6.36 |
| Black Sea (34) | 0.641 ± 0.169 | 0.687 ± 0.209 | 1.000 | 1.000 | 5.50 |
| Southeast Anatolia (13) | 0.638 ± 0.185 | 0.687 ± 0.221 | 1.000 | 1.000 | 5.50 |
The highest gene flow (Nm) (31.23) was found between Central Anatolia and Marmara accession groups and the lowest gene flow (2.94) was found between Aegean and Black Sea accession groups (Table 3). Genetic similarity between the accessions was estimated using the coefficient for Nei's standard genetic distance (1972) (Supplementary Table 3), which showed relatively high genetic similarities. The tree constructed using neighbour-joining analysis was consistent with the findings from genetic distance analyses (Supplementary Figure 1).
Table 3
Pairwise population differentiation (Fst) and gene flow (Nm) between Anatolian fig populations.
| Populations (Fst/Nm) | Aegean | Central Anatolia | Mediterranean | Marmara | Black Sea |
|---|---|---|---|---|---|
| Aegean | – | ||||
| Central Anatolia | 0.035***/6.92 | – | |||
| Mediterranean | 0.067***/3.50 | 0.067***/3.47 | – | ||
| Marmara | 0.024***/10.16 | 0.007ns/31.23 | 0.048***/4.92 | – | |
| Black Sea | 0.078***/2.94 | 0.043***/5.40 | 0.068***/3.41 | 0.037***/6.40 | – |
| Southeast Anatolia | 0.71***/3.26 | 0.069***/3.39 | 0.028**/8.70 | 0.048***/4.90 | 0.054***/4.28 |
Marmara accessions showed relatively high similarity to the geographically close Aegean and Central Anatolian accessions with high gene flow rates (10.16 and 31.23, respectively) between these accession groups (Supplementary Figure 1, Table 3 and Supplementary Table 3). Southeast Anatolian accessions showed relatively low similarity to the accessions from other regions, especially to Aegean and Central Anatolia groups, as evidenced by high genetic distance and low gene flow values. Overall, genetic distance and adjacent joining analyses revealed that genetic similarities between the groups were high.
The FCA (Figure 2) showed partial sub-structuring of fig accession groups. Mediterranean and Black Sea accessions were grouped separately and showed relatively little overlap with other accession groups. Southeast Anatolian accessions were similar to Mediterranean and Black Sea accessions and showed a partial overlap with these two groups (Figure 2). In contrast, Aegean and Marmara accessions showed a strong overlap with accessions from Central Anatolia, most likely due to potential gene flows occurring between these populations (Table 3).

Figure 2
FCA of six fig populations. Different colours indicate different geographical regions where different fig accessions are originated from. The first axis of the FCA accounts for 38.76% of the variation within the data whereas the second axis accounts for an additional 28.63%. Both axes together account for 67.39% of the variability in the dataset. FCA, factorial correspondence analysis.
Southeast Anatolian accessions, which showed relatively high genetic distance from the accessions of other regions, displayed a homogenous (monocoloured) BAPS structure (Supplementary Table 3 and Supplementary Figure 2). Central Anatolia, which showed overlap with other regions in the FCA, formed a homogenous structure according to the BAPS analysis. Marmara accessions, which showed the low genetic distance to other populations with a significant overlap in the FCA, displayed an admixture BAPS structure (Figure 2; Supplementary Figure 2).
Genetic relationships of Anatolian fig accessions
In this study, we identified 22 homonymous (genetically different accessions known by the same name), 36 synonymous (genetically same accessions known by the different name) and 7 identical accession groups (Supplementary Tables 4–6).
A maximum K value at K = 2 corresponding to the two main RPPs (Figure 3; Supplementary Figure 3; Supplementary Tables 1 and 2) (RPP1 and RPP2) was identified using STRUCTURE analyses of diploid fig populations. Furthermore, RPP analyses showed that 87% (271) of accessions could be assigned to individual RPPs with at least 80% probability whereas 13% of accessions either could not be assigned or could be assigned only with a low probability value to a representative RPP (Figure 3).
RPP1 contained 81% of the Aegean population, followed by Central Anatolia (55%) and Marmara (51%) populations. In RPP1, 127 out of 165 accessions (77%) were observed with a probability of membership ratio qI (>80%), whereas a total of 38 accessions (23%) of different populations were identified as <80%. In RPP1, the highest number of accessions (126) was found in the Aegean population whereas the lowest number of accessions (4) was found in the Mediterranean population (Figure 3, Supplementary Table 1).

Figure 3
A: Illustration of two RPPs (RPP1 and RPP2) (K = 2, ql = 100–0%) B: Distribution of fig accessions by RPPs; accession no (population no: (1): Aegean, (2): Central Anatolia, (3): Mediterranean, (4): Marmara, (5): Black Sea, (6): Southeast Anatolia). See Supplementary Table 1 for corresponding accession numbers. RPPs, reconstructed panmictic populations.
In RPP2, the populations with the highest numbers of accessions were Southeast Anatolia (100%), Mediterranean (93%) and Black Sea (79%). In RPP2, the qI (>80%) value of 72% was similar to that of RPP1. In RPP2 populations, the highest number of entries was found in the Mediterranean (39 accessions) and the lowest number of accessions (5 accessions) was found in Central Anatolia. In addition, the qI value was <80% for 40 accessions (28%), which included 4 accessions from the Black Sea, 3 accessions from Southeast Anatolia, 10 accessions from Marmara, 4 accessions from the Mediterranean, 2 accessions from Central Anatolia and 17 accessions from Aegean populations.
In both RPPs, RPP1 and RPP2, a total of 70 accessions were identified as admixed accessions (qI < 80%). The populations with the highest number of admixed accessions for both groups were Aegean (35 accessions) and Marmara (22 genotypes) (Figure 3; Supplementary Table 1).
When male–female distribution was examined in RPP analyses, female figs were distributed in two RPPs, whereas 40 out of 45 male (caprifig) figs originating from Aegean-Aydın and Aegean-İzmir, respectively, were found in RPP1, and the remaining 5 in RPP2.
Clonal analysis
In MLG analyses, a total of 96 different MLGs (accessions) and 213 unique accessions were identified. In line with the number of populations, the highest number of MLGs was 38 and these were found in the Aegean population; on the other hand, the lowest number of MLGs was 3 and these were found in the Central Anatolia population. The mean number of different alleles (Na) and effective alleles (Ne), which were 5.87 and 3.35, respectively, were similar in all 6 populations. Observed heterozygosity (Ho) values were 0.68 in Marmara, Black Sea and Southeast Anatolia populations. These Ho values were higher than the uHe values of the same populations. However, in the Aegean population, Ho and uHe values were identical. The lowest PAS value with 4 alleles at 2 different loci was found in the Black Sea and Southeast Anatolia populations, whereas the highest PAS value with 12 alleles at 5 different loci was found in Aegean and Mediterranean populations (Table 4).
Table 4
Multilocus genotypes (MLG), number of different alleles (Na), effective alleles (Ne), observed heterozygosity (Ho), unbiased expected heterozygosity (uHe) and PAS values found in different fig populations studied.
| Population | MLG | Na | Ne | Ho | uHe | PAS (Locus no: alleles (bp)) |
|---|---|---|---|---|---|---|
| Aegean | 38 | 6.85 | 3.07 | 0.62 | 0.62 | L3:137, L6:246, L8:142, L10:155–159–179, L11:176 |
| Central Anatolia | 3 | 4.78 | 3.03 | 0.62 | 0.65 | L4:156, L12:124 |
| Mediterranean | 19 | 6.35 | 3.60 | 0.66 | 0.66 | L3:141, L6:160, L7:190, L9:153, L15:196 |
| Marmara | 15 | 6.35 | 3.67 | 0.68 | 0.66 | L6:148–168, L7:158, L8:186, L14:249 |
| Black Sea | 15 | 5.42 | 3.35 | 0.68 | 0.64 | L2:160, L8:144 |
| Southeast Anatolia | 6 | 5.50 | 3.40 | 0.68 | 0.66 | L2:186, L11:152 |
| Total | 96 | 35.25 | 20.12 | 3.94 | 3.89 | – |
[i] PAS, private alleles summary.
In MLLs analyses performed using different threshold values, some minor differences were observed in the number of different MLLs. There was no difference in the number of MLLs between threshold = 2 and threshold = 3 values. Therefore, threshold = 2 is considered as the threshold value.
Based on clonal diversity values, all populations except Central Anatolia and one accession of Southeast Anatolia were found to contain unique accessions (Table 5).
Table 5
Number of genotypes (accessions) (gen)/clonality, effective number of genotypes (accessions) (eff), genotypic diversity (div), eveness (eve) and Shannon-Wiener (shw) values (for threshold = 2) determined in MLLs analysis.
| Population | Number of genotypes (accessions) (gen)/Clonality | Effective number of genotypes (accessions) (eff) | Genotypic diversity (div) | Eveness (eve) | Shannon-wiener (shw) |
|---|---|---|---|---|---|
| Aegean | 124/33 | 87 | 0.994 | 0.702 | 2.035 |
| Central Anatolia | 11/0 | 11 | 1.000 | 1.000 | 1.041 |
| Mediterranean | 33/9 | 26 | 0.986 | 0.809 | 1.479 |
| Marmara | 46/7 | 41 | 0.994 | 0.911 | 1.644 |
| Black Sea | 29/4 | 26 | 0.992 | 0.915 | 1.445 |
| Southeast Anatolia | 12/1 | 11 | 0.987 | 0.938 | 1.067 |
[i] MLLs, multilocus lineages.
The genotypic diversity (div) value, also known as expected heterozygosity, was similarly found to be high in all populations (mean 0.991). The lowest eveness (eve) value, which shows distribution status of accessions within a population, was 0.702 in the Aegean population, whereas the highest eveness value, which was the same as the number of effective number of genotypes (accessions) (eff), was 1.000 in the Central Anatolia population. This indicates that all accessions of the Central Anatolia population have the same frequency. The higher Shannon–Wiener (shw) value (2.035) which was observed in the Aegean population as compared with other populations, was consistent with the high-diversity features of this population (Table 5).
Among accessions, 54 clones/multilocus accessions were found for threshold = 2. Especially in Aegean (33 clones) and Mediterranean (9 clones) populations, accession-clone matches were found to occur mostly within the same population. Detailed information (accession name, accession no, geographical region and province) on clones determined based on threshold = 2 value is given in Supplementary Table 7.
It has been observed that the clone matching groups determined in the MLL analysis are partially similar to the groups determined in the RPP analysis.
DISCUSSION
To date, Anatolian figs have been identified mostly based on their morphological features and current accessions have been often named by individual collectors/curators of such germplasms. Therefore, it is suspected that due to the lack of a reliable genetic characterisation system, a number of homonymous and synonymous fig accessions from Anatolia have remained uncharacterised. In this study, we used SSR markers, which have been used extensively for genetic diversity, linkage mapping and population genetic studies (Verma et al., 2013), for the characterisation of Anatolian figs. The database constructed for Anatolian figs in this study will be a useful national and international reference for future studies.
SSR analysis
Based on the PI values, the most informative locus was FCUP038-6 (PI: 0.093; 15 alleles), and the least informative locus was LMFC23 (PI: 0.600; 2 alleles). The FCUP038-6 locus has also been identified as the locus which demonstrates the highest number of alleles in previous investigations (Bandelj et al., 2007; Caliskan et al., 2012; Ferrara et al., 2016; Caliskan et al., 2018). The number of alleles per locus ranged from 2 for LMFC23 to 15 for FCUP038-6 and the allele sizes ranged from 121bp for MFC3 to 261bp for LMFC30. Similarly, the LMFC23 locus displayed low polymorphism in other studies (Giraldo et al. 2005; Giraldo et al., 2008; Ferrara et al., 2016). The MFC and LMF group loci (Khadari et al., 2003; Saddoud et al., 2008; Achtak et al., 2009; Aradhya et al., 2010; Do Val et al., 2013; Caliskan et al., 2018; Ganopoulos et al., 2015; Teoman et al., 2017) and the FM4-70 locus (Zavodna et al., 2005; Caliskan et al., 2012; Ikten et al., 2018) have also been used by other workers for genetic identification of figs and, overall, our results are in accordance with these previous studies. In a study by Teoman et al. (2017), 24 LMF loci were studied on 45 caprifigs (F. carica var. caprificus) and 2 female figs from the Marmara and Aegean regions of Turkey, and the LMF-30 locus was found to have the highest number of alleles per locus (9 alleles). Similar results were also obtained by Achtak et al. (2009) and Aradhya et al. (2010).
Genetic relationships of fig accession groups
Estimates of genetic similarity were obtained from SSR markers data. The genetic distance matrix varied between 0.055 and 0.232 suggesting that fig accessions analysed had relatively high genetic diversity. The lowest similarity value was found between the accessions from Southeast and Central Anatolia whereas the maximum similarity was found between Marmara and Aegean accessions. Additionally, high similarities between accessions from Marmara and other regions were found (Supplementary Table 3). The Marmara region is known for having the highest rate of human commute due to its historical past (the former capital of Turkey throughout history), and this genetic similarity of Marmara accessions and other regions can be due to the comparatively high level of genetic material exchange with these regions throughout history.
Based on SSR analyses, 310 accessions were classified into six accession groups (dendrogram not shown). Similarly, Caliskan et al. (2018) divided 90 caprifig accessions from the Eastern Mediterranean into five groups. In our study, reference accessions from geographically distant Aegean region clustered separately from eastern accessions. The most significant genetic differentiation value (0.078) was found between Aegean and Black Sea fig accession groups whereas the lowest FST value (0.007) was identified between Marmara and Central Anatolian fig populations. Similarly, significant genetic differentiation values were found within Anatolian fig populations, with the highest and lowest FST values being 0.182 and 0.007, respectively (Caliskan et al., 2018). The results of gene flow analyses revealed that the accessions from geographically distant regions had lower levels of gene flow, whereas the accessions originated from closer geographical locations had higher levels of gene flow.
The observed heterozygosity values, which were higher than expected heterozygosity for all groups except for those from Central Anatolia, indicated a high level of cross-pollination in different F. carica populations. This finding agrees with that of Aradhya et al. (2010), who studied fig samples from Europe, Asia and North America. According to the BAPS structure analysis, fig accessions from Southeast Anatolia displayed a homogeneous structure which is consistent with the FCA analysis. In addition, Southeast Anatolian accessions showed the highest genetic distance among the remaining regions studied (Supplementary Table 3). Central Anatolian accessions showed a homogeneous structure. Based on genetic distance and the rate of gene flow analyses, genetic similarity between accessions from this region and those of Marmara indicated gene flow from Central Anatolia to the Marmara region. Marmara and Aegean accessions with an admixture (heterogeneous) structure had some overlap with other accessions (Figure 2; Supplementary Figure 2), suggesting that gene flows to these regions from other regions had been also occurred.
The RPP analyses confirmed the results of structuring by other population analyses (FCA, BAPS structure, gene flow, etc.). RPP1 included 81% of the Aegean population, half of the Marmara population and 50% of the Central Anatolia population. As a result, these three populations overlapped in FCA, showing high gene flow and low genetic distance to one another.
RPP2 was the most diverse RPP and consisted of accessions from all populations. In particular, the Mediterranean and Southeast Anatolia, which showed high similarity to each other, were included in this group (Figure 3; Supplementary Tables 1 and 2).
In MLG analysis carried out in our research, 96 MLGs that showed correspondence to 31% of the total population were distinguished. In similar MLG analyses performed on different plants, this rate was 78% in Halophila ovalis population (Xu et al., 2019), 48% in olive population (Barazani et al., 2014) and 14% in wild population of Ziziphus celata (Rhamnaceae) (Gitzendanner et al., 2012). The rate of MLGs in a population may vary significantly depending on the total population number, the number of SSR markers used and discrimination power (Hamadeh et al., 2018). Accordingly, about 56% of 96 MLGs determined in MLG analysis were distinguished as clone in MLL analysis (threshold = 2) (Table 5) and proved that the discrimination power of SSR markers used in the clonal analysis is sufficient.
As it is known, heterozygosity values (unbiased expected heterozygosity (uHe) and observed heterozygosity) determined in MLG analysis provide information about genetic diversity and kinship relations between MLGs (Harris and DeGiorgio, 2017). In MLG analysis performed on 1,747 Pueraria montana (Lour.) Merr. var. lobata (also known as kudzu) plants belonging to 87 different locations in the United States, the average number of samples for 87 locations was 20, and based on the unbiased expected heterozygosity (uHe) value (0.398) and observed heterozygosity value (Ho) (0.444), it was clear that kudzu plant had high genetic diversity and it was explained that this situation was caused by high clonal reproduction (Bentley and Maurıcıo, 2016). In addition, in MLG analysis based on SSR markers in 429 genotypes belonging to 22 different populations of the perennial tree Platanus orientalis living in the Mediterranean region, unbiased expected heterozygosity (uHe) was found between 0.267 and 0.607, and observed heterozygosity (Ho) was found between 0.207 and 0.564, and despite the high number of analysed population, low heterozygosity values observed at the clonal level were attributed to geographic isolation and low gene flow (Rinaldi et al., 2019).
In MLG analysis of our study, it was interestingly revealed that expected heterozygosity (uHe) and observed heterozygosity (Ho) values were quite close to each other in all six populations, and values of both heterozygosities were observed to be 0.620 and higher. This situation reveals the possible genetic variation among MLGs in each population (Harris and DeGiorgio, 2017).
Genetic relationships of fig accessions
As explained in detail later, in this study, 36 synonymous, 22 homonymous and 7 identical fig accessions were identified (Supplementary Tables 4–6).
Homonymous groups
The accessions named ‘Siyah’ (e.g. accessions 105, 106, 214, 215, 251 and 252) and ‘Siyah İncir’ (e.g. accessions 216, 241 and 295) are most likely homonymous. A similar situation can also be seen in the case of ‘Beyaz’ (203) and ‘Beyaz incir’ accessions. It should be noted that the words/adjectives used in accession names such as ‘Siyah’ (meaning ‘black’ in Turkish), ‘Beyaz’ (meaning ‘white’ in Turkish) and ‘Mor’ (meaning ‘purple’ in Turkish) all refer to the colour of the fruit. The accessions called ‘Datça 1’ (145), ‘Datça 2’ (146), ‘Datça 3’ (147), ‘Datça 4’ (148) and ‘Datça 5’ (157) formed a homonymous group with <70% genetic similarity. Despite having the same name, the homonymous group accessions Halebi (298) and Halebi (299) showed only 56.7% similarity to each other whereas Halebi (298) and Halebi (299) showed 86.7% similarity to ‘Armut sapı’ (178) and 66.7% similarity to ‘Mor özer’ (297) accessions, respectively (Supplementary Table 4).
Synonymous groups
The two ‘Kadota’ accessions (134 and 168) originated from Italia and a Turkish accession called ‘Lop Yemiş’ (132) formed a synonymous group. ‘Lop Yemiş’ was not similar to other similarly called accessions (i.e. ‘Lop Figs’) and, therefore, it is likely that ‘Lop Yemiş’ (132) is a ‘Kadota’ accession. Of the fig accessions from the Aydın province, three accessions, namely ‘Bağcılar’ (41), an ‘unnamed’ accession (45) and ‘Sarılop’ (46), were found to be synonymous (Supplementary Table 5). It is likely that ‘Bağcılar’ (41) and the ‘unnamed’ accession (46) may, in fact, be ‘Sarılop’ (46), which is a widely grown fig accession in the Aegean region.
Our results also indicated the synonymous 306 (unnamed) is a ‘Lop’ (229) accession whereas 210 (unnamed) is a ‘Siyah İncir’ (149) accession. ‘Bektaşi’ (40) and ‘Mor İncir’ (107) were found to be synonymous to ‘Mor Güz’ (5) and ‘Mor Güz’ (95) and because of low similarities between ‘Mor İncir’ (107) and other members of the ‘Mor İncir’ accessions, it is likely that ‘Bektaşi’ (40) and ‘Mor İncir’ (107) were misnamed. These accessions are likely to be the same as ‘Mor Güz’ accessions (Supplementary Table 5).
Similarly, since ‘Datça 1’ (145) was found to be synonymous with ‘Siyah Güz’ (9), it is likely that ‘Siyah Güz’ (9) was misnamed. ‘Yediveren’ (30) formed a synonymous group with accessions 1, 28, 33, 223 and 244 but had only 36.7% similarity to another accession also, called ‘Yediveren’ (115), forming a homonymous group with it. This indicates that accession 30 was not ‘Yediveren’ but had the same genetic background with its synonymous accessions.
The synonymous accession ‘unnamed’ (125) seems to be a ‘Izmir Bardacık’ accession and ‘unnamed’ 141 in case 7 is a ‘Mor 4’ accession. Similarly, ‘unnamed’ (262) is an accession of ‘Yediveren’. ‘Unnamed’ synonymous 259 and 260, showing the same similarities to all other accessions, were similar to 104 ‘Aydın İnciri’ and may be originated from 104. Besides, because ‘Mor İncir’ (107) showed low similarities to other members of the ‘Mor İncir’ group, this accession is likely to be the same as ‘Mor Güz’ accessions.
Identical groups
In this study, seven identical groups including ‘Yanako 1’ (60) – ‘Yanako 2’ (61), ‘Siyah’ (215) – ‘Siyah İncir’ (216), ‘Tarak’ (183) – ‘Tarak İnciri’ (191), ‘Morgüz’ (5) – ‘Morgüz’ (95), ‘Kırmızı İncir’ (174) – ‘Kırmızı İncir’ (187), ‘Siyah’ (242) – ‘Siyah İncir’ (295) and ‘Kadota’ (134) – ‘Kadota’ (168) were identified (Supplementary Table 6).
Clonal similarity
As proposed by Ordidge et al. (2018), 16 clonal cases with 90–100% similarity required for clonality were found. Of these, nine accession groups that showed one allelic difference (or 96.9% similarity), three accession groups that showed two allelic differences (or 93.8% similarity) as well as four groups that showed three allelic differences (90.6% similarity) were identified. The number of clones determined in MLL analyzes (Supplementary Table 7) is higher than the number of clones determined by the genetic similarity index (UPGMA). However, it was determined that the accessions belonging to the clone groups in both analyses showed high similarity with each other.
Our analyses also revealed extensive clonal relationships among accession. ‘Devetabanı’ (34) and ‘Sakız’ (35) were found to be 96.7% and 93.3% similar, respectively, to six synonymous accessions (1, 28, 30, 33, 223 and 244). ‘Devetabanı’ (34) differed from these six synonymous accessions by only one allele found at the MFC4 locus and ‘Sakız’ (35) differed by two homozygous alleles at the LMFC25 locus.
Similarly, of the three synonymous fig accessions identified here, ‘Sarılop Kim’ (92) and ‘Ak Sarılop’ (99) from İzmir and another ‘unnamed’ accession (138) from Manisa showed 96.7% similarity to ‘Sarılop’ (46) from Aydın. In MLLs analysis, unnamed accession (138) and ‘Ak Sarılop’ (99) were identified as the clone of ‘Bağcılar’ (41) from the same population. The clonal variation shown by ‘Sarılop’ in the Aegean region is already known (Cabrita et al., 2001) and accordingly it is possible that accessions 41, 92, 99 and 138 are all different ‘Sarılop’ clones. Besides, unknown (309) accession seems to be a ‘Siyah Orak’ (21) clone (Supplementary Table 7).
Unique synonymous-clonal structure and sex distribution of Anatolian figs
In general, the ecotypic variation due to somaclonal variations of fig cultivars appears to be high. Ecotypes here are defined both within and between geographical regions and provinces. Especially in Aegean, Marmara and Mediterranean ecotypes, different accessions were found homonymous (e.g. ‘Datça 1’ (145) – ‘Datça 3’ (147) – ‘Datça 4’ (148) – ‘Datça 5’ (157)), whereas similar accessions (‘Bektaşi’ (40) – ‘Mor Güz’ (95) – ‘Mor İncir’ (107), etc.) were found synonymous (Supplementary Tables 4 and 5).
Clones may be different in MLGs for reasons such as allele scoring error and somatic mutations. Somatic mutations, especially in perennial plants, can lead to differences between individuals with the same clonal genotype (Coughlan et al., 2017). Clonal variations were mostly detected in different varieties that do not form ecotypes within and between geographical regions/provinces. Clonal diversity detected among non-ecotype varieties is thought to be caused either by variations found in each geographical region/province accessions (‘Mor Armudi’ (172-Mediterranean, Adana), ‘Kırmızı İncir’ (174-Mediterranean, Adana), ‘Kırmızı İncir’ (187-Mediterranean, Adana)) or by the emergence of new clones, especially in case of other Aegean and/or Marmara varieties (‘Hamri’ (182-Mediterranean, Adana), ‘Siyah’ (215-Marmara, Balıkesir), ‘Siyah İncir’ (216-Marmara, Balıkesir)) grown in other ecologies (Black Sea, Mediterranean, etc.) (Supplementary Table 7).
In recent years, RPP analyses have been used by various researchers in figs for population structure groupings (Belttar et al., 2017; Teoman et al., 2017; Ikten et al., 2018).
In our study, overall RPP-based groupings showed correlations with genetic similarity relationships of the 310 accessions examined. Regardless of the geographical region/province, almost all 36 synonymous, 7 identical accession cases were included in the same RPP (RPP1 or RPP2) (Supplementary Tables 1, 5 and 6).
In addition, the finding that synonymous, identical accession are grouped with the same RPPs is an indication of their unique structures. Clonal cases except for a few clone groups (unnamed (306) – Sarı Bardak (227); Yediveren (249) – Dumanı Kara (218) and Mor İncir (200) – Kilis inciri (194)) have been found to be in the same RPPs groups (Supplementary Tables 5–7).
Common fig is a gynodioecious species where female and hermaphroditic trees are found together within a population. Male fig trees produce syconia containing both male and female flowers. In contrast, the syconia produced by female fig trees contain only female flowers. Because only male trees can produce pollen, the common fig is considered to be functionally dioecious (Boudchicha et al., 2018).
A total of 45 male accessions from Aegean-Aydın (37) and Aegean-İzmir (8) were included in this study. So far, the number of studies conducted on the structure distribution of male and female accessions in fig accessions has been limited. Teoman et al. (2017) reported that the structure analysis of 47 fig genotypes produced 2 RPPs without any clear male–female separation.
In contrast, in our study, caprifigs showed a distinct structure and mostly located in RPP1, although only five male accessions from the Aegean-Aydin male group (‘Siyah İlek 48’ (48), ‘Kizilay 1’ (58), ‘ Şeytan 1’ (64), ‘Taşlık’ (73), ‘Kızılburun’ (74)) were also found in RRP2.
One of the reasons for these five male accessions to differ from the others could be due to their different genetic structures. Another reason why these five male accessions differed from others would be related to plant genetics as well as gender phenotype. An orthologue of RAN1 gene loci was reported to be associated with sex determination in fig (Mori et al., 2017). Mori et al. (2017) reported that mutational variations of the two SNP regions in RAN1, which is associated with sex determination in figs, caused heterozygous accessions in the 18 male fig accessions. In the current study, five accessions previously reported to be female (Ikten and Yilmaz, 2019) were identified as male based on RAN1-associated cleaved amplified polymorphic sequences (CAPS) marker screenings. These heterozygous genome variations may be another reason for the fact that 5 of the 45 caprifigs accessions were found in different RPPs.
CONCLUSIONS
SSR primers used herein generated a significant number of alleles that enabled genetic characterisation of Anatolian figs and the identification of potentially redundant germplasm. Our findings presented here also suggest that cross-fertilisation might have played a significant role as a source of variability not only in wild fig populations but also in cultivated forms leading to homonymous accessions while the lack of phenotypic descriptions together with misnaming of accessions have resulted in synonymous and identical fig accessions. Another source of variation could be the clonal differences resulting from somaclonal variations among fig accessions. Together, these forces might have led to the development of a rich fig germplasm in Anatolia. Molecular characterisation of this germplasm will facilitate the utilisation and preservation of unique Anatolian fig accessions while generating useful data for future evolutionary studies on global figs populations.
Notes
[8] FUNDING
This study was supported by the Scientific and Technical Research Council of Turkey (TUBITAK) (Grant No. 105 G 078).
[9] Contributed by AUTHOR CONTRIBUTIONS
AE designed and outlined the research. BPB, NA, SSA and CYÖ conducted the experiments. KK, NH, FY, CYÖ and MB analysed the data and drafted and edited the manuscript. NT, MÖ, İK and FÇ provided plant collections. All authors read and approved the manuscript.
[10] Conflicts of interest CONFLICT OF INTEREST
The authors declare no conflict of interest.
SUPPLEMENTARY MATERIALS

Figure S1
The UPGMA tree showing genetic relationships of six fig populations from Anatolia based on Nei's (1972) genetic distance.
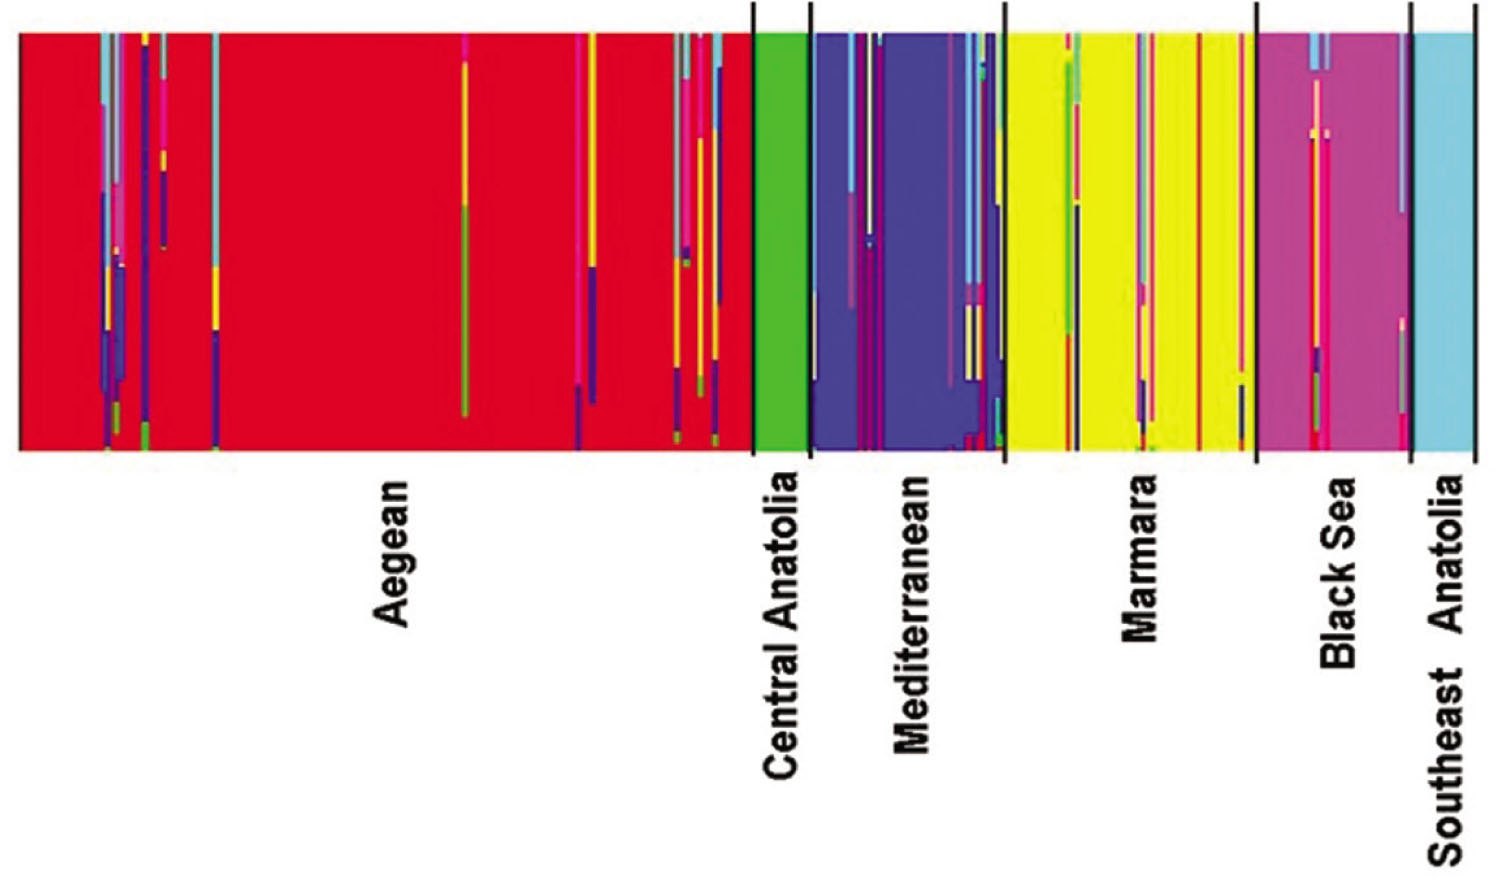
Figure S2
Bayesian analysis of population structure of fig accessions. The structure where fig populations are shown in their heterogeneous, homogeneous or admixtured state is constructed based on their allele frequencies, using the BAPS software. In this figure, vertical bars correspond to individual genotypes. Black vertical lines are used to separate different populations.
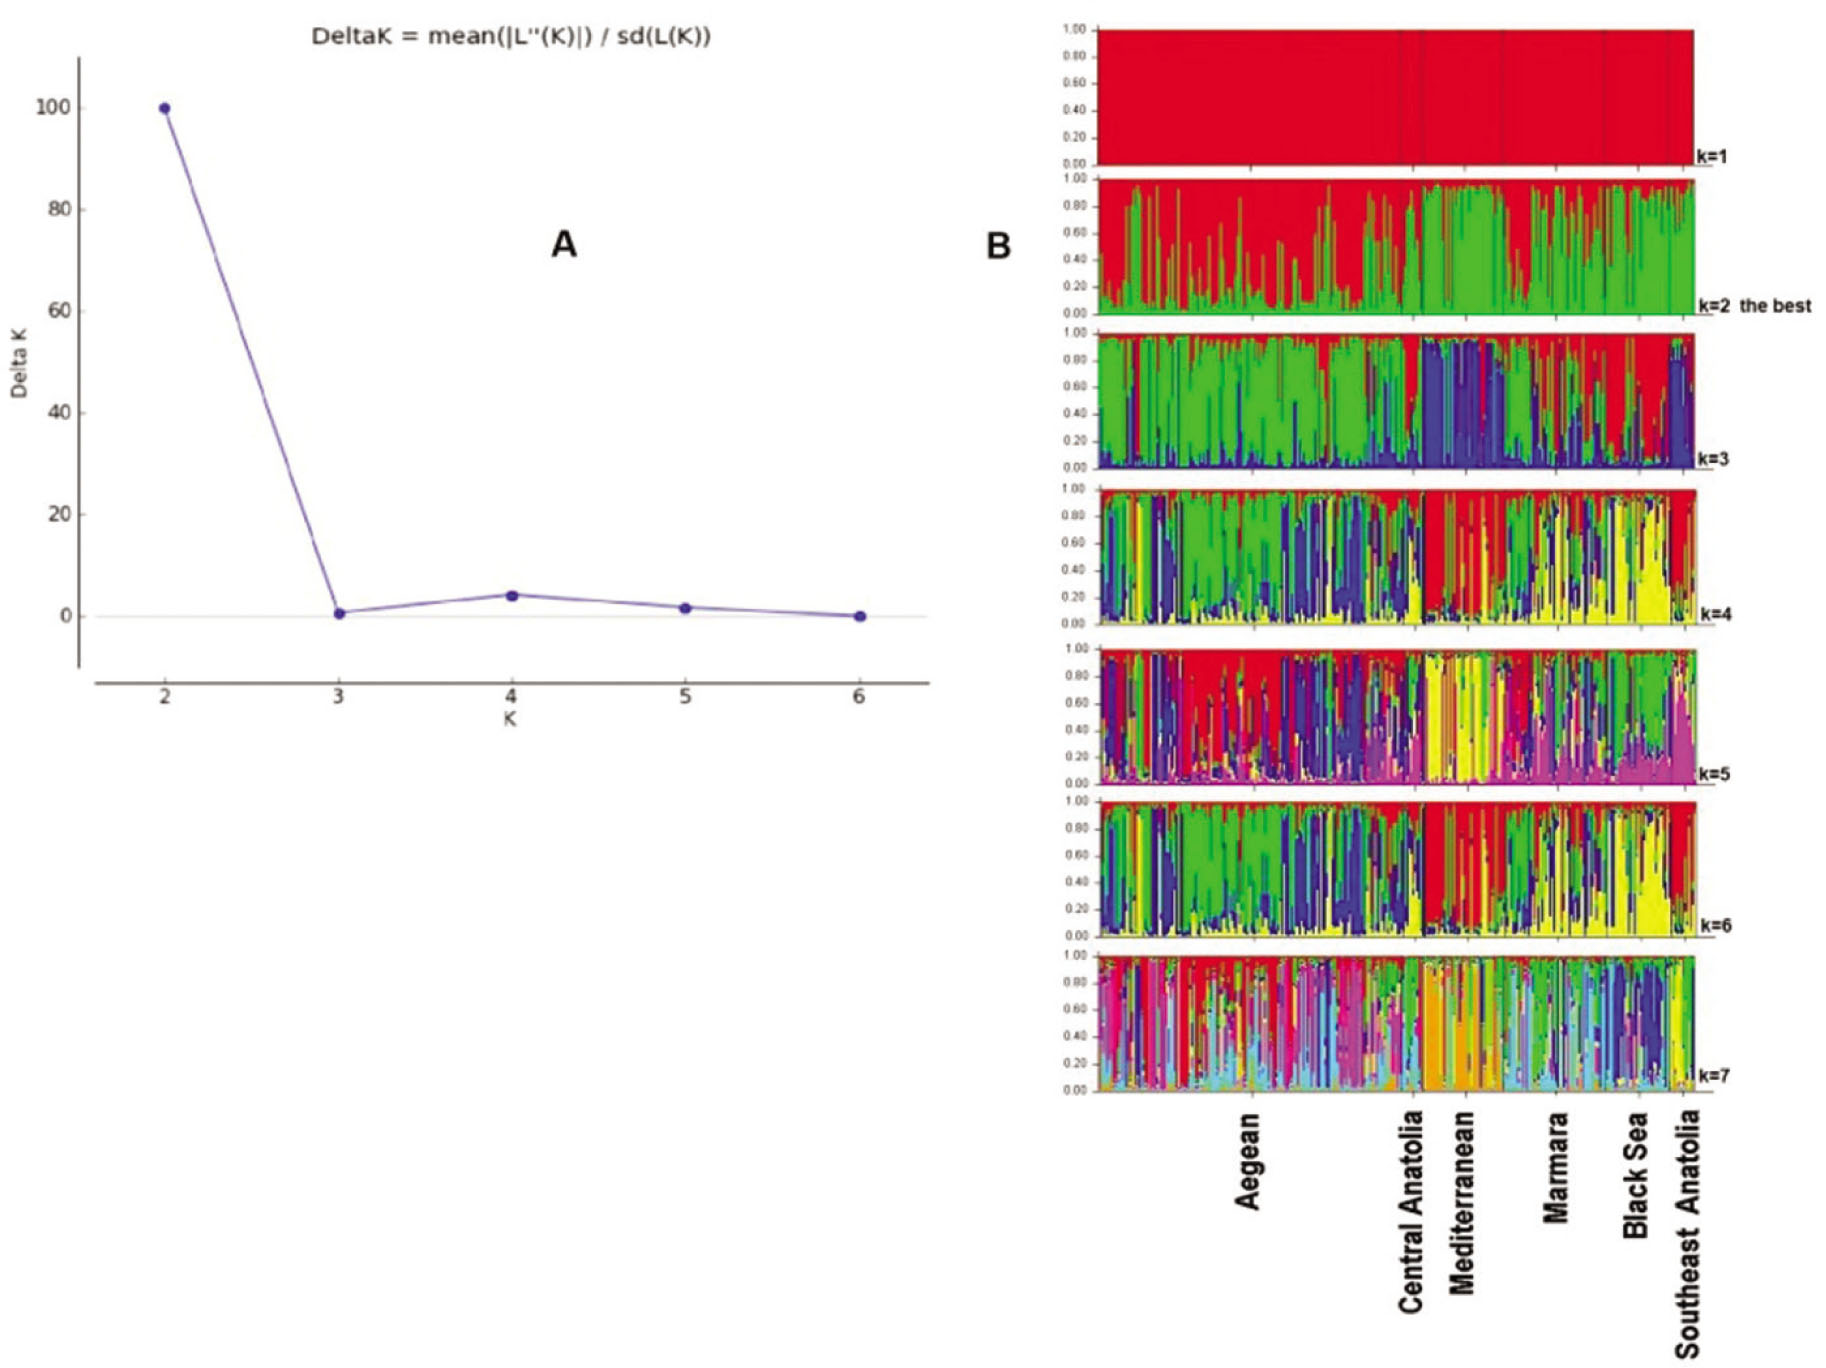
Figure S3
A: The best K value (2) is shown in the graph, B: Population structure of fig populations based on K = 1–8. The best K value was calculated according to Evanno et al. (2005) and was K = 2.
Table S1
Collection cites, accession no, accession name of fig cultivars used in the study.
| Collection cites (Geographical region-Provinces-Fig plant sex) | Accession no | Accession code | Accession name | RPP grouping (red: RPP1) (green: RPP2) |
|---|---|---|---|---|
| Aegean-Aydın-Female | 1 | 1001 | Göklop | |
| 2 | 1002 | Bardakçı | ||
| 3 | 1004 | Kuşadası Bardakçı | ||
| 4 | 1111 | Mor Bardakçı | ||
| 5 | 1006 | Mor Güz | ||
| 6 | 1007 | Beyaz Güz | ||
| 7 | 1106 | Ak Güz | ||
| 8 | 1008 | Yeşil Güz | ||
| 9 | 1039 | Siyah Güz | ||
| 10 | 1009 | Mor 1 | ||
| 11 | 1020 | Mor 2 | ||
| 12 | 1021 | Mor 3 | ||
| 13 | 1022 | Mor 4 | ||
| 14 | 1005 | Şeker inciri | ||
| 15 | 1011 | Kış İnciri | ||
| 16 | 1023 | Kuş İnciri | ||
| 17 | 1026 | Siyah İncir | ||
| 18 | 1003 | Karahönü | ||
| 19 | 1010 | Kara Yaprak | ||
| 20 | 1019 | Karabakunya | ||
| 21 | 1012 | Siyah Orak | ||
| 22 | 1013 | Beyaz Orak | ||
| 23 | 1014 | Akça 1 | ||
| 24 | 1015 | Akça 2 | ||
| 25 | 1016 | Akça 3 | ||
| 26 | 1017 | Bardak | ||
| 27 | 1027 | Asıl Bardak | ||
| 28 | 1036 | Löp | ||
| 29 | 1037 | Lop | ||
| 30 | 1018 | Yediveren | ||
| 31 | 1025 | Şaranpol | ||
| 32 | 1028 | Kaya | ||
| 33 | 1031 | Alaca | ||
| 34 | 1032 | Devetabanı | ||
| 35 | 1034 | Sakız | ||
| 36 | 1038 | Lebi; Uzun | ||
| 37 | 1040 | Siyilli | ||
| 38 | 1041 | Sarı Dizilik | ||
| 39 | 1042 | Koca Ana | ||
| 40 | 1043 | Bektaşi | ||
| 41 | 1044 | Bağcılar | ||
| 42 | 1104 | Patlıcan | ||
| 43 | 1098 | Sarı Zeybek | ||
| 44 | 1118 | Unnamed | ||
| 45 | 1100 | Unnamed | ||
| 46 | 1029 | Sarı Lop | ||
| Aegean-Aydın-Male | 47 | 28 | Kara İlek | |
| 48 | 8 | Siyah İlek | ||
| 49 | 24 | Ak İlek | ||
| 50 | 36 | Mor İlek | ||
| 51 | 54 | Sarı İlek | ||
| 52 | 29 | Kavun İlek | ||
| 53 | 25 | Elma İlek | ||
| 54 | 53 | Kaba İlek(Bozdoğan) | ||
| 55 | 1 | Kabaİlek(Ömerbeyli) | ||
| 56 | 61 | Körpe İlek | ||
| 57 | 16 | Hamza İlek | ||
| 58 | 10 | Kızılay 1 | ||
| 59 | 32 | Kızılay-2 | ||
| 60 | 57 | Yanako 1 | ||
| 61 | 59 | Yanako 2 | ||
| 62 | 34 | Büyük Konkur | ||
| 63 | 38 | Küçük Konkur | ||
| 64 | 18 | Şeytan 1 | ||
| 65 | 19 | Şeytan 2 | ||
| 66 | 21a | Çakın 1 | ||
| 67 | 21b | Çakın 2 | ||
| 68 | 60 | Adalı | ||
| 69 | 23 | Kıbrıslı | ||
| 70 | 13 | Gabalı | ||
| 71 | 15 | Abalı | ||
| 72 | 22 | Damarlı | ||
| 73 | 50 | Taşlık | ||
| 74 | 52 | Kızılburun | ||
| 75 | 56 | Frenk | ||
| 76 | 35 | Afyoncu | ||
| 77 | 37 | Karabulut | ||
| 78 | 17a | Mordemirtaş | ||
| 79 | 17b | Çaçaron | ||
| 80 | 12 | Derviş Ali | ||
| 81 | 14 | Hacı Yusuf | ||
| 82 | 4 | Bostancı | ||
| 83 | 7 | Kuyucak | ||
| Aegean-İzmir-Male | 84 | 39 | Hacı Abdullah | |
| 85 | 40 | Kara Erkek | ||
| 86 | 41 | Ak Erkek 1 | ||
| 87 | 43 | Ak Erkek 2 | ||
| 88 | 42 | Çiçekli 2 | ||
| 89 | 44 | Conkurt | ||
| 90 | 46 | Ayardolduran | ||
| 91 | 49 | Armut İlek | ||
| Aegean-İzmir-Female | 92 | TUR1081 | Sarılop kim | |
| 93 | TUR1082 | Akça kim | ||
| 94 | TUR1047 | Morgüz | ||
| 95 | TUR1045 | Morgüz | ||
| 96 | TUR1035 | Sarı çiçek | ||
| 97 | TUR1046 | Mor | ||
| 98 | TUR1064 | Mor | ||
| 99 | TUR1048 | Ak sarılop | ||
| 100 | TUR1086 | Mor lop | ||
| 101 | TUR1087 | Unnamed | ||
| 102 | TUR1050 | Boğmalı | ||
| 103 | TUR1051 | Langav | ||
| 104 | TUR1053 | Aydın inciri | ||
| 105 | TUR1054 | Siyah | ||
| 106 | TUR1068 | Siyah | ||
| 107 | TUR1055 | Mor incir | ||
| 108 | TUR1056 | Bardak lopu | ||
| 109 | TUR1057 | Unnamed | ||
| 110 | TUR1059 | Unnamed | ||
| 111 | TUR1060 | Sarıca | ||
| 112 | TUR1061 | Bal inciri | ||
| 113 | TUR1062 | Eyyam bahur | ||
| 114 | TUR1065 | Arap inciri | ||
| 115 | TUR1066 | Yediveren | ||
| 116 | TUR1067 | Gökçe | ||
| 117 | TUR1069 | Kızgıt | ||
| 118 | TUR1070 | Kasaba | ||
| 119 | TUR1071 | Karabakunya | ||
| 120 | TUR1073 | Beyaz Karabakunya | ||
| 121 | TUR1072 | Unnamed | ||
| 122 | TUR1074 | Midilli | ||
| 123 | TUR1058 | Yeşil midilli 1 | ||
| 124 | TUR1077 | Yeşil midilli 2 | ||
| 125 | TUR1075 | Unnamed | ||
| 126 | TUR1076 | Unnamed | ||
| 127 | TUR1078 | Dibala | ||
| 128 | TUR1079 | Yörük inciri | ||
| 129 | TUR1080 | İzmir Bardacık 2 | ||
| 130 | TUR1083 | Unnamed | ||
| 131 | TUR1084 | Unnamed | ||
| 132 | TUR1085 | Lop yemiş | ||
| Aegean-Manisa-Female | 133 | TUR1049 | Unnamed | |
| 134 | TUR1107 | Kadota | ||
| 135 | TUR1088 | Siyah kış | ||
| 136 | TUR1089 | Ufak yeşil | ||
| 137 | TUR1090 | Esmer bal | ||
| 138 | TUR1091 | Unnamed | ||
| 139 | TUR1092 | Unnamed | ||
| 140 | TUR1093 | Unnamed | ||
| 141 | TUR1094 | Unnamed | ||
| 142 | TUR1095 | Unnamed | ||
| 143 | TUR1096 | Unnamed | ||
| 144 | TUR1097 | Unnamed | ||
| 145 | TUR1108 | Datça 1 | ||
| 146 | TUR1110 | Datça 2 | ||
| 147 | TUR1112 | Datça 3 | ||
| 148 | TUR1114 | Datça 4 | ||
| 149 | TUR1102 | Siyah incir | ||
| 150 | TUR1103 | Beyaz incir | ||
| 151 | TUR1119 | Unnamed | ||
| 152 | TUR1099 | Unnamed | ||
| 153 | TUR1109 | Şeker | ||
| 154 | TUR1113 | Beyaz incir | ||
| 155 | TUR1115 | Gökçe | ||
| 156 | TUR1116 | Ada | ||
| 157 | TUR1117 | Datça 5 | ||
| Central Anatolia-Eskişehir-Female | 158 | TUR708 | Darpak | |
| 159 | TUR709 | Kızıl mor | ||
| 160 | TUR710 | Ekşi incir | ||
| 161 | TUR711 | Beyaz incir | ||
| 162 | TUR712 | Siyah incir | ||
| 163 | TUR701 | Yabani(Mor) | ||
| 164 | TUR702 | Yabani f | ||
| 165 | TUR704 | Yabani f | ||
| 166 | TUR705 | K.formu | ||
| 167 | TUR706 | Çilci | ||
| 168 | TUR801 | Kadota | ||
| Mediterranean-Adana-Female | 169 | TUR 321 | Mor Seyhan | |
| 170 | TUR 322 | Beyaz Seyhan | ||
| 171 | TUR 318 | Mor İncir | ||
| 172 | TUR 311 | Mor Armudi | ||
| 173 | TUR 312 | Kızıl Mor | ||
| 174 | TUR 313 | Kırmızı İncir | ||
| 175 | TUR 317 | Aşı İnciri | ||
| 176 | TUR 314 | Meyem İnciri | ||
| 177 | TUR 315 | Kış İnciri | ||
| 178 | TUR 310 | Armut Sapı | ||
| 179 | TUR 316 | Yayladağ | ||
| 180 | TUR 323 | Fahli | ||
| 181 | TUR 324 | Şetvi | ||
| 182 | TUR 325 | Hamri | ||
| 183 | TUR 326 | Tarak | ||
| 184 | TUR 327 | Lebi | ||
| 185 | TUR01I-01 | Lop İnciri | ||
| 186 | TUR31-İ-08 | Lop İnciri | ||
| 187 | TUR31-İ-04 | Kırmızı İncir | ||
| 188 | TUR31-İ-02 | Beyaz İncir | ||
| 189 | TUR31-İ-03 | Siyah İncir | ||
| 190 | TUR31-İ-09 | Kışlık İncir | ||
| 191 | TUR31-İ-06 | Tarak İnciri | ||
| 192 | TUR31-İ-07 | Fetike İnciri | ||
| 193 | TUR31-İ-11 | Frenk İnciri | ||
| 194 | TUR31-İ-12 | Kilis İnciri | ||
| 195 | TUR31-İ-10 | Gök İncir | ||
| 196 | TUR31-İ-05 | Kandamik | ||
| Mediterranean-İçel (Mersin)-Female | 197 | TUR33-İ-01 | Gök İncir | |
| 198 | TUR 33-İ-02 | Güzlük Mor İncir | ||
| 199 | TUR33-İ-03 | Haziran İnciri | ||
| 200 | TUR33-İ-04 | Mor İncir | ||
| 201 | TUR 306 | Bodrum İnciri | ||
| 202 | TUR 307 | Kalın Kabuk | ||
| 203 | TUR 308 | Beyaz | ||
| Mediterranean-Osmaniye-Female | 204 | TUR 319 | Osmaniyeli | |
| 205 | TUR 320 | Unnamed | ||
| Mediterranean-Antalya-Female | 206 | TUR 302 | Mor İncir | |
| 207 | TUR 305 | Mor İncir | ||
| 208 | TUR 309 | Mor İncir | ||
| 209 | TUR 301 | Sarı İncir | ||
| 210 | TUR 303 | Unnamed | ||
| Marmara-Adapazarı-Female | 211 | TUR 249 | Kavak | |
| Marmara-Balıkesir-Female | 212 | TUR 209 | Mor İncir | |
| 213 | TUR 210 | Mor İncir | ||
| 214 | TUR 202 | Siyah | ||
| 215 | TUR 255 | Siyah | ||
| 216 | TUR 208 | Siyah İncir | ||
| 217 | TUR 254 | Midilli | ||
| 218 | TUR 220 | Dumanlı Kara | ||
| 219 | TUR 205 | Sarı Dizilik | ||
| 220 | TUR 206 | Boğmalı Dizilik | ||
| 221 | TUR 207 | Yemişi Lop | ||
| 222 | TUR 256 | Yediveren | ||
| 223 | TUR 201 | Istanbul | ||
| Marmara-Bursa-Female | 224 | TUR 237 | Bursa Siyahı | |
| 225 | TUR 236 | Bardak | ||
| 226 | TUR 238 | Beyaz Bardak | ||
| 227 | TUR 242 | Sarı Bardak | ||
| 228 | TUR 241 | Gök Bardak | ||
| 229 | TUR 240 | Lop | ||
| 230 | TUR 245 | Sarı Yemiş | ||
| 231 | TUR 246 | Gelin Yanağı | ||
| 232 | TUR 243 | Susak | ||
| 233 | TUR 244 | Kavak | ||
| 234 | TUR 247 | Mor İncir | ||
| 235 | TUR 248 | Siyah İncir | ||
| 236 | TUR 252 | Löp İnciri | ||
| Marmara-Çanakkale-Female | 237 | TUR 223 | Yediveren | |
| 238 | TUR 222 | Kavak Yediveren | ||
| 239 | TUR 224 | Beyaz İncir | ||
| 240 | TUR 213 | Kara Yemiş | ||
| 241 | TUR 216 | Siyah İncir | ||
| 242 | TUR 218 | Siyah | ||
| 243 | TUR 225 | Kabak Yemişi | ||
| 244 | TUR 212 | Çiçek İncir | ||
| 245 | TUR 215 | Midilli | ||
| 246 | TUR 214 | Unnamed | ||
| 247 | TUR 219 | Unnamed | ||
| Marmara-İstanbul-Female | 248 | TUR 235 | Yediveren | |
| 249 | TUR 250 | Yediveren | ||
| 250 | TUR 227 | Yediveren | ||
| 251 | TUR 234 | Siyah | ||
| 252 | TUR 230 | Siyah | ||
| 253 | TUR 251 | Dereköy | ||
| 254 | TUR 226 | Kasım İnciri | ||
| 255 | TUR 228 | İpek İnciri | ||
| 256 | TUR 231 | Tüylü İncir | ||
| 257 | TUR 232 | Koca Yemiş | ||
| 258 | TUR 253 | Sultan Selim | ||
| 259 | TUR 233 | Unnamed | ||
| 260 | TUR 229 | Unnamed | ||
| 261 | TUR 211 | Unnamed | ||
| 262 | TUR 203 | Unnamed | ||
| 263 | TUR 204 | Unnamed | ||
| Black Sea-Artvin-Female | 264 | TUR 536 | Beyaz İncir | |
| 265 | TUR 542 | Siyah Bukele | ||
| 266 | TUR 541 | Sarı Kilis | ||
| 267 | TUR 540 | Kilis İnciri | ||
| Black Sea-Bartın-Female | 268 | TUR 505 | Kara Sultani | |
| 269 | TUR 506 | Beyaz Sultani | ||
| Black Sea-Giresun-Female | 270 | TUR 530 | İpek İnciri | |
| 271 | TUR 532 | Kepek İnciri | ||
| 272 | TUR 531 | Değirmen İnciri | ||
| 273 | TUR 534 | Sarı İncir | ||
| 274 | TUR 533 | Ağarsak | ||
| Black Sea-Kastamonu-Female | 275 | TUR 507 | Balduzdın | |
| 276 | TUR 508 | Baldıran | ||
| Black Sea-Ordu-Female | 277 | TUR 528 | Kara İncir | |
| 278 | TUR 529 | Könüs İnciri | ||
| 279 | TUR 523 | Dilaver | ||
| 280 | TUR 524 | Ham İncir | ||
| 281 | TUR 525 | Ak İncir 1 | ||
| Black Sea-Sinop-Female | 282 | TUR 511 | Şalgam İnciri | |
| 283 | TUR 512 | Istanbul İnciri | ||
| 284 | TUR 514 | Deniz İnciri | ||
| 285 | TUR 515 | Tabak İnciri | ||
| 286 | TUR 513 | Filestos | ||
| Black Sea-Samsun-Female | 287 | TUR 517 | Mor İncir | |
| 288 | TUR 522 | Turna Boyu | ||
| 289 | TUR 519 | Şeker İnciri | ||
| Black Sea-Trabzon-Female | 290 | TUR 537 | Kara İncir | |
| 291 | TUR 538 | Kabak İnciri | ||
| 292 | TUR 535 | Horasan | ||
| Black Sea-Zonguldak-Female | 293 | TUR 503 | Ak İncir | |
| 294 | TUR 501 | Sarı İncir | ||
| 295 | TUR 504 | Siyah İncir | ||
| 296 | TUR 502 | Istanbul İnciri | ||
| Southeast Anatolia | 297 | TUR 401 | Mor Özer | |
| 298 | TUR 402 | Halebi | ||
| 299 | TUR 407 | Halebi | ||
| 300 | TUR 403 | Sultani | ||
| 301 | TUR 405 | Kalazi | ||
| 302 | TUR 408 | Azezi | ||
| 303 | TUR 404 | Kış Hayrı | ||
| 304 | TUR 221 | Yeşil İncir | ||
| 305 | TUR 217 | Unnamed | ||
| 306 | TUR 239 | Unnamed | ||
| 307 | TUR 304 | Unnamed | ||
| 308 | TUR 07-I-0P5 | Kızıl Yemiş | ||
| 309 | TUR 01-I-04 | Unnamed | ||
| Black Sea-Artvin-Female | 310 | TUR 539 | Beyaz Bukele |
Table S2
SSR loci information (locus no, locus name, primer sequence, repeat motif, expected range (bp), amplification temperatures and GenBank accession number).
| Locus no | Locus name | Primer sequence (5′ to 3′) | Repeat motif | Expected range (bp) | Amplification temperatures (Tm) | GenBank accession numbers |
|---|---|---|---|---|---|---|
| L1 | MFC1 | f: ctagactgaaaaaacattgc, r:tgagattgaaaggaaacgag | (ct)13 | 174–192 | 55 | AF333703 |
| L2 | MFC2 | f: gcttccgatgctgctctta, r:tcggagacttttgttcaat | (ac)18(at)7 | 158–172 | 55 | AF333697 |
| L3 | MFC3 | f:gatattttcatgtttagtttg, r:gaggatagaccaacaacaac | (ac)15(tc)(ac)8(at)7 | 122–136 | 55 | AF333698 |
| L4 | MFC8 | f:gtggcgtcgtctctaataat, r:tattctatgctgtcttatgtca | (ca)9ta(ca)14(ta)6 | 170–174 | 57 | AF333703 |
| L5 | FCUP008-2 | f: catacactttcatggagcacaaa, r: cccagatgtttggtgaagg | (tg)22 | 158–184 | 53 | EF198054 |
| L6 | FCUP027-4 | f: aaccttttagtatgcctttggaa, r: tccaccatcaaatccttctg | (ac)19 | 202–220 | 55 | EF198058 |
| L7 | FCUP038-6 | f:caatgtatcatttcatctcacgaa, r: agttcccatgtttggttactga | (tg)23t(ag)11 | 170–193 | 58 | EF198059 |
| L8 | FCUP066-7 | f: ccctctcgaagaagaagca, r: ctacaggaaatgggcctcaa | (ca)14 | 162–182 | 58 | EF198065 |
| L9 | FCUP068-1 | f:ggaattaccgtccatggcta, r: cgccactctctctctccact | (ag)14(gagagag)4 | 178–206 | 58 | EF198066 |
| L10 | FCUP070-2 | f:ttcaacttcaaccttcaccaa, r:tttgtctaaggaggcttattgtca | (ag)15 | 183–195 | 58 | EF198068 |
| L11 | LMFC23 | f: tttcgtgtctaacgatcaaaaa, r: ctcccatctccaactccatc | (ag)20 | 132 | 53 | AY545936 |
| L12 | LMFC25 | f: gattctgattaaagggtattt, r: gctttccaaatctaaagtaac | (tc)11 | 216 | 55 | AY545938 |
| L13 | LMFC30 | f: ttgtccgtttcttatacaat, r: tctttttaggcagatgttag | (ct)18(ca)6 | 253 | 58 | AY545942 |
| L14 | FM4-70 | f:cagatgaggttgacgatgttattg, r: taaaccctcttcaaattcactctc | (gaa)20−1 | 202–232 | 55 | AJ854076 |
[i] SSR, simple sequence repeat.
Table S3
Genetic distance/genetic similarity (%) between fig populations based on Nei's (1972) genetic distance.
| Populations | Aegean | Central Anatolia | Mediterranean | Marmara | Black Sea |
|---|---|---|---|---|---|
| Aegean | – | ||||
| Central Anatolia | 0.107/89.3 | – | |||
| Mediterranean | 0.149/85.1 | 0.206/79.4 | – | ||
| Marmara | 0.055/94.5 | 0.065/93.5 | 0.126/87.4 | – | |
| Black Sea | 0.175/82.5 | 0.144/85.6 | 0.177/82.3 | 0.099/90.1 | – |
| Southeast Anatolia | 0.181/81.9 | 0.232/76.8 | 0.106/89.4 | 0.149/85.1 | 0.164/83.6 |
Table S4
Reconstructed panmictic population (RPP) grouping of homonymous identified based on SSR analysis.
| No | Homonymous-accession name (accession no-geographical region, provinces) | |
|---|---|---|
| RPP1 | RPP2 | |
| 1 | Kızılay 2 (59-Aegean, Aydın) | Kızılay 1 (58-Aegean, Aydın) |
| 2 | Şeytan 2 (65-Aegean, Aydın) | Şeytan 1 (64-Aegean, Aydın) |
| 3 | Çakın 1 (66-Aegean, Aydın) – Çakın 2 (67-Aegean, Aydın) | – |
| 4 | Datça1 (145-Aegean, Manisa) – Datça 3 (147-Aegean, Manisa) – Datça 4 (148-Aegean, Manisa) – Datça 5 (157-Aegean, Manisa) | Datça 2 (146-Aegean, Manisa) |
| 5 | Ak Erkek 1 (86-Aegean, İzmir) – Ak Erkek 2 (87-Aegean, İzmir) | – |
| 6 | Morgüz (95-Aegean, İzmir) – Morgüz (5-Aegean, Aydın) | Morgüz (94-Aegean, Aydın) |
| 7 | Siyah (105-Aegean, İzmir) – Siyah (106-Aegean, İzmir) – Siyah (214-Marmara, Balıkesir) – Siyah (252-Marmara, İstanbul) – Siyah İncir (17-Aegean, Aydın) – Siyah İncir (241-Marmara, Çanakkale)–Siyah (215-Marmara, Balıkesir) – Siyah İncir (216-Marmara, Balıkesir) | Siyah (251-Marmara, İstanbul) – Siyah İncir (149-Aegean, Manisa) – Siyah İncir (162-Central Anatolia, Eskişehir) – Siyah İncir (189-Mediterranean, Adana) – Siyah İncir (235-Marmara, Balıkesir) – Siyah (242-Marmara, Çanakkale) – Siyah İncir (295-Black Sea, Zonguldak) |
| 8 | Beyaz İncir (154-Aegean, Manisa) – Beyaz İncir (187-Mediterranean, Adana) – Beyaz İncir (238-Marmara, Çanakkale) – Beyaz İncir (263-Marmara, İstanbul) | Beyaz (203-Mediterranean, İçel) – Beyaz İncir (150-Aegean, Manisa) – Beyaz İncir (161-Central Anatolia) |
| 9 | Akça 1 (23-Aegean, Aydın) – Akça 2 (24-Aegean, Aydın) – Akça 3 (25-Aegean, Aydın) | – |
| 10 | Mor 1 (10-Aegean, Aydın) – Mor 2 (11-Aegean, Aydın) – Mor 3 (12-Aegean, Aydın) – Mor 4 (13-Aegean, Aydın) – Mor (97-Aegean, İzmir) – Mor (98-Aegean, İzmir) – Mor İncir (107-Aegean, İzmir) – Mor İncir (206-Mediterranean, Antalya) – Mor İncir (207-Mediterranean, Antalya) – Mor İncir (234-Marmara, Bursa) | Mor İncir (171-Mediterranean, Adana) – Güzlük Mor İncir (198-Mediterranean, İçel) – Mor İncir (200-Mediterranean, İçel) – Mor İncir (208-Mediterranean, Antalya) – Mor İncir (212-Marmara, Balıkesir) – Mor İncir (213-Marmara, Balıkesir) – Mor İncir (287-Black Sea, Samsun) |
| 11 | Midilli (122-Aegean, İzmir) – Midilli (217-Marmara, Balıkesir) – Midilli (245-Marmara, Çanakkale) – Yeşil Midilli 2 (124-Aegean, İzmir) | Yeşil Midilli 1 (123-Aegean, İzmir) |
| 12 | Yabani F (165-Central Anatolia-Eskişehir) | Yabani F (164-Central Anatolia, Eskişehir) – Yabani (Mor) (163-Central Anatolia, Eskişehir) |
| 13 | – | Karabakunya (20-Aegean, Aydın) – Karabakunya (119-Aegean, İzmir) – Beyaz karabakunya (120-Aegean, İzmir) |
| 14 | Bardakçı (2-Aegean, Aydın) – Kuşadası Bardakçı (3-Aegean, Aydın) – Morbardakçı (4-Aegean, Aydın) – Bardak (26-Aegean, Aydın) – Bardak (225-Marmara, Bursa) – Gök Bardak (228-Marmara, Bursa) | Asıl Bardak (27-Aegean, Aydın) – Beyaz Bardak (226-Marmara, Bursa) – Sarı Bardak (227-Marmara, Bursa) |
| 15 | Yediveren (30-Aegean, Aydın) – Yediveren (115-Aegean, İzmir) – Yediveren (222-Marmara, Balıkesir) – Yediveren (248-Marmara, İstanbul) | Yediveren (237-Marmara, Çanakkale) – Kavak Yediveren (238-Marmara, Çanakkale) – Yediveren (249-Marmara, İstanbul) – Yediveren (250-Marmara, İstanbul) |
| 16 | Şeker (153-Aegean, Manisa) – Şeker İnciri (14-Aegean, Aydın) | Şeker İnciri (289-Black Sea, Samsun) |
| 17 | Löp (28-Aegean, Aydın) – Lop (29-Aegean, Aydın) – Löp İnciri (236-Marmara, Bursa) | Lop İnciri (185-Mediterranean, Adana) – Lop İnciri (186-Mediterranean, Adana) – Lop (229-Marmara, Bursa) |
| 18 | Kaba İlek (Bozdoğan) (54-Aegean, Aydın) – Kaba İlek (Ömerbeyli) (55-Aegean, Aydın) | – |
| 19 | Büyük Konkur (62-Aegean, Aydın) – Küçük Konkur (63-Aegean, Aydın) | – |
| 20 | Frenk (75-Aegean, Aydın) | Frenk İnciri (193-Mediterranean, Adana) |
| 21 | – | Kış İnciri (15-Aegean, Aydın) – Kış İnciri (177-Mediterranean, Adana) – Kışlık İncir (190-Mediterranean, Adana) |
| 22 | – | Halebi (298-Southeast Anatolia) – Halebi (299-Southeast Anatolia) |
[i] SSR, simple sequence repeat.
Table S5
RPP grouping of synonymous identified based on SSR analysis.
| No | Synonymous-accession name (accession no-geographical region, provinces) | |
|---|---|---|
| RPP1 | RPP2 | |
| 1 | Gök Lop (1-Aegean, Aydın) – Löp (28-Aegean, Aydın) – Yediveren (30-Aegean, Aydın) – Alaca (33-Aegean, Aydın) – İstanbul (223-Marmara, Balıkesir) – Çiçek İncir (244-Marmara, Çanakkale) | – |
| 2 | Mor (98-Aegean, İzmir) – Dibala (127-Aegean, İzmir) | – |
| 3 | Ada (156-Aegean, Manisa) – Yemişi Lop (221-Marmara, Balıkesir) – Balduzdın (275-Black Sea, Kastamonu) – Könüş İnciri (278-Southeast Anatolia) | – |
| 4 | Bağcılar (41-Aegean, Aydın) – Unnamed (45-Aegean, Aydın) – Sarı Lop (46-Aegean, Aydın) | – |
| 5 | Sarılop Kim (92-Aegean, İzmir) – Ak Sarılop (99-Aegean, İzmir) – Unnamed (138-Aegean, Manisa) | – |
| 6 | Unnamed (126-Aegean, İzmir) – İzmir Bardacık 2 (129-Aegean, İzmir) | – |
| 7 | Mor 4 (13-Aegean, Aydın) – Unnamed (142-Aegean, Manisa) | – |
| 8 | Sarı Zeybek (43-Aegean, Aydın) – Siyah (252-Marmara, İstanbul) | – |
| 9 | Kara İlek (47-Aegean, Aydın) – Kavun İlek (52-Aegean, Aydın) | – |
| 10 | Lop Yemiş (132-Aegean, İzmir) – Kadota (134-Aegean, Manisa) – Kadota (168-Central Anatolia, Eskişehir) | – |
| 11 | Darpak (158-Central Anatolia, Eskişehir) – Löp İncir (236-Marmara, Balıkesir) | – |
| 12 | Beyaz Güz (6-Aegean, Aydın) – Ak Güz (7-Aegean, Aydın) | – |
| 13 | Siyah Güz (9-Aegean, Aydın) – Datça (145-Aegean, Manisa) | – |
| 14 | Yediveren (222-Marmara, Balıkesir) – Unnamed (263-Marmara, İstanbul) | – |
| 15 | Unnamed (259-Marmara, İstanbul) | Unnamed (260-Marmara, İstanbul) |
| 16 | Mor Güz (5-Aegean, Aydın) – Bektaşi (40-Aegean, Aydın) – Mor Güz (95-Aegean, İzmir) – Mor İncir (107-Aegean, İzmir) | – |
| 17 | Lop (29-Aegean, Aydın) – Sarıca (111-Aegean, İzmir) – Unnamed (133-Aegean, Manisa) – Esmer Bal (137-Aegean, Manisa) | – |
| 18 | Gökçe (116-Aegean, İzmir) – Kızgıt (117-Aegean, İzmir) | – |
| 19 | Boğmalı (102-Aegean, İzmir) – Langav (103-Aegean, İzmir) | – |
| 20 | Şeker (153-Aegean, Manisa) – Beyaz İncir (154-Aegean, Manisa) | – |
| 21 | Siyah İncir (17-Aegean, Aydın) – Fahli (180-Mediterranean, Adana) | – |
| 22 | – | Mor Armudi (172-Mediterranean, Adana) – Kırmızı İncir (174-Mediterranean, Adana) – Kırmızı İncir (187-Mediterranean, Adana) |
| 23 | – | Kara Yaprak (19-Aegean, Aydın) – Patlıcan (42-Aegean, Aydın) |
| 24 | – | Beyaz (203-Mediterranean, İçel) – Unnamed (205-Mediterranean, Osmaniye) – Kara Yemiş (240-Marmara, Çanakkale) – Kış Hayrı (303-Southeast Anatolia) |
| 25 | – | Asıl Bardak (27-Aegean, Aydın) – Gök İncir (197-Mediterranean, Adana) |
| 26 | – | Beyaz İncir (188-Mediterranean, Adana) – Mor İncir (200-Mediterranean, İçel) |
| 27 | – | Meyem İncir (176-Mediterranean, Adana) – Fetike İnciri (192-Mediterranean, Adana) |
| 28 | – | Kışlık İncir (190-Mediterranean, Adana) – Kandamik (196-Mediterranean, Adana) |
| 29 | – | Lop (229-Marmara, Balıkesir) – Unnamed (306-Southeast Anatolia) |
| 30 | – | İpek İnciri (270-Black Sea, Giresun) – Sarı İncir (273-Black Sea, Giresun) |
| 31 | Siyah (242-Marmara, Çanakkale) | Beyaz İncir (239-Marmara, Çanakkale)-Siyah İncir (295-Black Sea, Zonguldak) |
| 32 | Ekşi İncir (160-Central Anatolia, Eskişehir) – Dereköy (253-Marmara, İstanbul) – Sarı Kilis (266-Black Sea, Artvin) – Kilis İnciri (267-Black Sea, Artvin) | – |
| 33 | – | Siyah İncir (149-Aegean, Manisa) – Unnamed (210-Mediterranean, Antalya) |
| 34 | Yediveren (115-Aegean, İzmir) – Karabakunya (119-Aegean, İzmir) | Kış İnciri (15-Aegean, Aydın) |
| 35 | – | Haziran İnciri (199-Mediterranean, İçel) – Beyaz Sultani (269-Black Sea, Bartın) |
| 36 | – | Lop İnciri (185-Mediterranean, Adana) – Kilis İnciri (194-Mediterranean, Adana) |
[i] SSR, simple sequence repeat.
Table S6
RPP grouping of identical identified based on SSR analysis.
| No | Identical-accession name (accession no-geographical region, provinces) | |
|---|---|---|
| RPP1 | RPP2 | |
| 1 | Yanako 1 (60-Aegean, Aydın) – Yanako 2 (61-Aegean, Aydın) | – |
| 2 | Siyah (215-Marmara, Balıkesir) – Siyah İncir (216-Marmara, Balıkesir) | – |
| 3 | – | Tarak (183-Mediterranean, Adana) – Tarak İnciri (191-Mediterranean, Adana) |
| 4 | Morgüz (5-Aegean, Aydın) – Morgüz (95-Aegean, İzmir) | – |
| 5 | – | Kırmızı İncir (174-Mediterranean, Adana) – Kırmızı İncir (187-Mediterranean, Adana) |
| 6 | – | Siyah (242-Marmara Çanakkale) – Siyah İncir (295-Black Sea, Zonguldak) |
| 7 | Kadota (134-Aegean, Manisa) – Kadota (168-Central Anatolia, Eskişehir) | – |
[i] SSR, simple sequence repeat.
Table S7
Accessions and individuals assigned to different accession at T = 2 threshold value based on MLLs analyses.
| Matched number | Accession name (accession no-geographical region, province) | Matches at T = 2 (accession no-geographical region, province) |
|---|---|---|
| 1 | Ak Güz (7-Aegean-Aydın) | Beyaz Güz (6-Aegean-Aydın) |
| 2 | Karabakunya (20-Aegean-Aydın), Yediveren (115-Aegean-İzmir), Karabakunya (119-Aegean), | Kış İnciri (15 Aegean-Aydın) |
| 3 | Löp (28 Aegean-Aydın), Yediveren (30-Aegean-Aydın), Alaca (33-Aegean-Aydın), Devetabanı (34-Aegean-Aydın), Istanbul (223-Marmara-Balıkesir), Çiçek İncir (244-Marmara-Bursa) | Göklop (1-Aegean-Aydın) |
| 4 | Sakız (35-Aegean-Aydın) | Göklop (1-Aegean-Aydın) |
| 5 | Bektaşi (40-Aegean-Aydın), Morgüz (95-Aegean-İzmir) | Mor Güz (5-Aegean-Aydın) |
| 6 | Patlıcan (42-Aegean-Aydın) | Karayaprak (19-Aegean-Aydın) |
| 7 | Unnamed (45-Aegean-Aydın), Unnamed (46-Aegean-Aydın) | Bektaşi (41-Aegean-Aydın) |
| 8 | Kavun İlek (52-Aegean-Aydın) | Kara İlek (47-Aegean-Aydın) |
| 9 | Yanako 2 (61-Aegean-Aydın) | Yanako 1 (60-Aegean-Aydın) |
| 10 | Ak sarılop (99-Aegean-İzmir), Unnamed (138-Aegean-Manisa) | Bağcılar (41-Aegean-Aydın) |
| 11 | Boğmalı (102-Aegean,İzmir), Langav (103-Aegean,İzmir) | Siyilli (37-Aegean-Aydın) |
| 12 | Mor İncir (107-Aegean-İzmir) | Mor Güz (5-Aegean-Aydın) |
| 13 | Sarıca (111-Aegean-İzmir), Unnamed (133-Aegean-Manisa), Esmer Bal (137-Aegean-Manisa) | Lop (29-Aegean-Aydın) |
| 14 | Kızgıt (117-Aegean-İzmir) | Gökçe (116-Aegean-İzmir) |
| 15 | Beyaz Karabakunya (120-Aegean-İzmir) | Beyaz Orak (22-Aegean-Aydın) |
| 16 | Dibala (127-Aegean-İzmir) | Beyaz Orak (22-Aegean-Aydın) |
| 17 | İzmir Bardacık 2 (129-Aegean-İzmir) | Unnamed (126-Aegean-İzmir) |
| 18 | Kadota (134-Aegean-Manisa) | Lop Yemiş (132-Aegean-İzmir) |
| 19 | Unnamed (142-Aegean-Manisa) | Mor 4 (13-Aegean-Aydın) |
| 20 | Datça 1 (145-Aegean-Manisa) | Siyah Güz (9-Aegean-Aydın) |
| 21 | Beyaz İncir (154-Aegean-Manisa) | Şeker (153-Aegean-Manisa) |
| 22 | Şeker (153-Aegean, Manisa) | Kadota (134-Aegean-Manisa) |
| 23 | Kırmızı İncir (174-Mediterranean-Adana), Kırmızı İncir (187-Mediterranean-Adana) | Mor Armudi (172-Mediterranean-Adana) |
| 24 | Fahli (180-Mediterranean-Adana) | Siyah İncir (17-Aegean-Aydın) |
| 25 | Tarak inciri (191-Mediterranean-Adana) | Tarak (15-Mediterranean-Adana) |
| 26 | Fetike İnciri (192-Mediterranean-Adana) | Meyem İnciri (176-Mediterranean-Adana) |
| 27 | Kilis İnciri (194-Mediterranean-Adana) | Lop İnciri (185-Mediterranean-Adana) |
| 28 | Kandamik (196-Mediterranean-Adana) | Kışlık İncir (190-Mediterranean-Adana) |
| 29 | Gök İncir (197-Mediterranean-İçel) | Asıl Bardak (27-Aegean-Aydın) |
| 30 | Mor İncir (200-Mediterranean-İçel) | Kilis inciri (194-Mediterranean-Adana) |
| 31 | Unnamed (205-Mediterranean-Osmaniye) | Beyaz (203-Mediterranean-İçel) |
| 32 | Unnamed (210-Mediterranean-Antalya) | Siyah incir (149-Aegean-Manisa) |
| 33 | Sarı Kilis (266-Black Sea-Artvin), Kilis İnciri (267-Black Sea-Artvin), Dereköy (253-Marmara-İstanbul) | Asıl Bardak (27-Aegean-Aydın) |
| 34 | Beyaz Sultani (269-Black Sea-Bartın) | Dumanı Kara (218-Marmara-Balıkesir) |
| 35 | Sarı İncir (273-Black Sea-Giresun) | İpek İnciri (270-Black Sea-Giresun) |
| 36 | Siyah (242-Marmara Çanakkale) | Siyah İncir (295-Black Sea, Zonguldak) |
| 37 | İpek İnciri (270-Black Sea, Giresun) | Sarı İncir (273-Black Sea, Giresun) |
| 38 | Yemişi Lop (221-Marmara, Balıkesir) | Balduzdın (275-Black Sea, Kastamonu) |
| 39 | Balduzdın (275-Black Sea-Kastamonu), Könüs İnciri (278-Black Sea-Ordu) | Ada (156-Aegean-Manisa) |
| 40 | Siyah İncir (295-Black Sea-Zonguldak) | Beyaz İncir (239-Marmara-Çanakkale) |
| 41 | Siyah (215-Marmara-Balıkesir), Siyah İncir (216-Marmara-Balıkesir) | Hamri (182-Mediterranean-Adana) |
| 42 | Yemişi Lop (11-Aegean-Aydın) | Ada (156-Aegean-Manisa) |
| 43 | Kara Yemiş (240-Marmara-Çanakkale) | Dumanı Kara (218-Marmara-Balıkesir) |
| 44 | Löp İnciri (236-Marmara-Bursa) | Siyah Orak (21-Aegean-Aydın) |
| 45 | Yediveren (249-Marmara-İstanbul) | Dumanı Kara (218-Marmara-Balıkesir) |
| 46 | Siyah (252-Marmara-İstanbul) | Sarı Zeybek (43-Aegean-Aydın) |
| 47 | İpek İnciri (255-Marmara-İstanbul) | Siyah Orak (21-Aegean-Aydın) |
| 48 | Unnamed (260-Marmara-İstanbul) | Unnamed (259-Marmara-İstanbul) |
| 49 | Unnamed (261-Marmara-İstanbul) | Beyaz Karabakunya (120-Aegean-İzmir) |
| 50 | Unnamed (263-Marmara-İstanbul) | Yediveren (222-Marmara-Balıkesir) |
| 51 | Kalazi (301-Southeast Anatolia) | Mor Özer (297-Southeast Anatolia) |
| 52 | Kış Hayrı (303-Southeast Anatolia) | Unnamed (205-Mediterranean-Osmaniye) |
| 53 | Unnamed (306-Southeast Anatolia) | Sarı Bardak (227-Marmara-Bursa) |
| 54 | Unnamed (309-Southeast Anatolia) | Siyah Orak (21-Aegean-Aydın) |
[i] MLLs, multilocus lineages.