
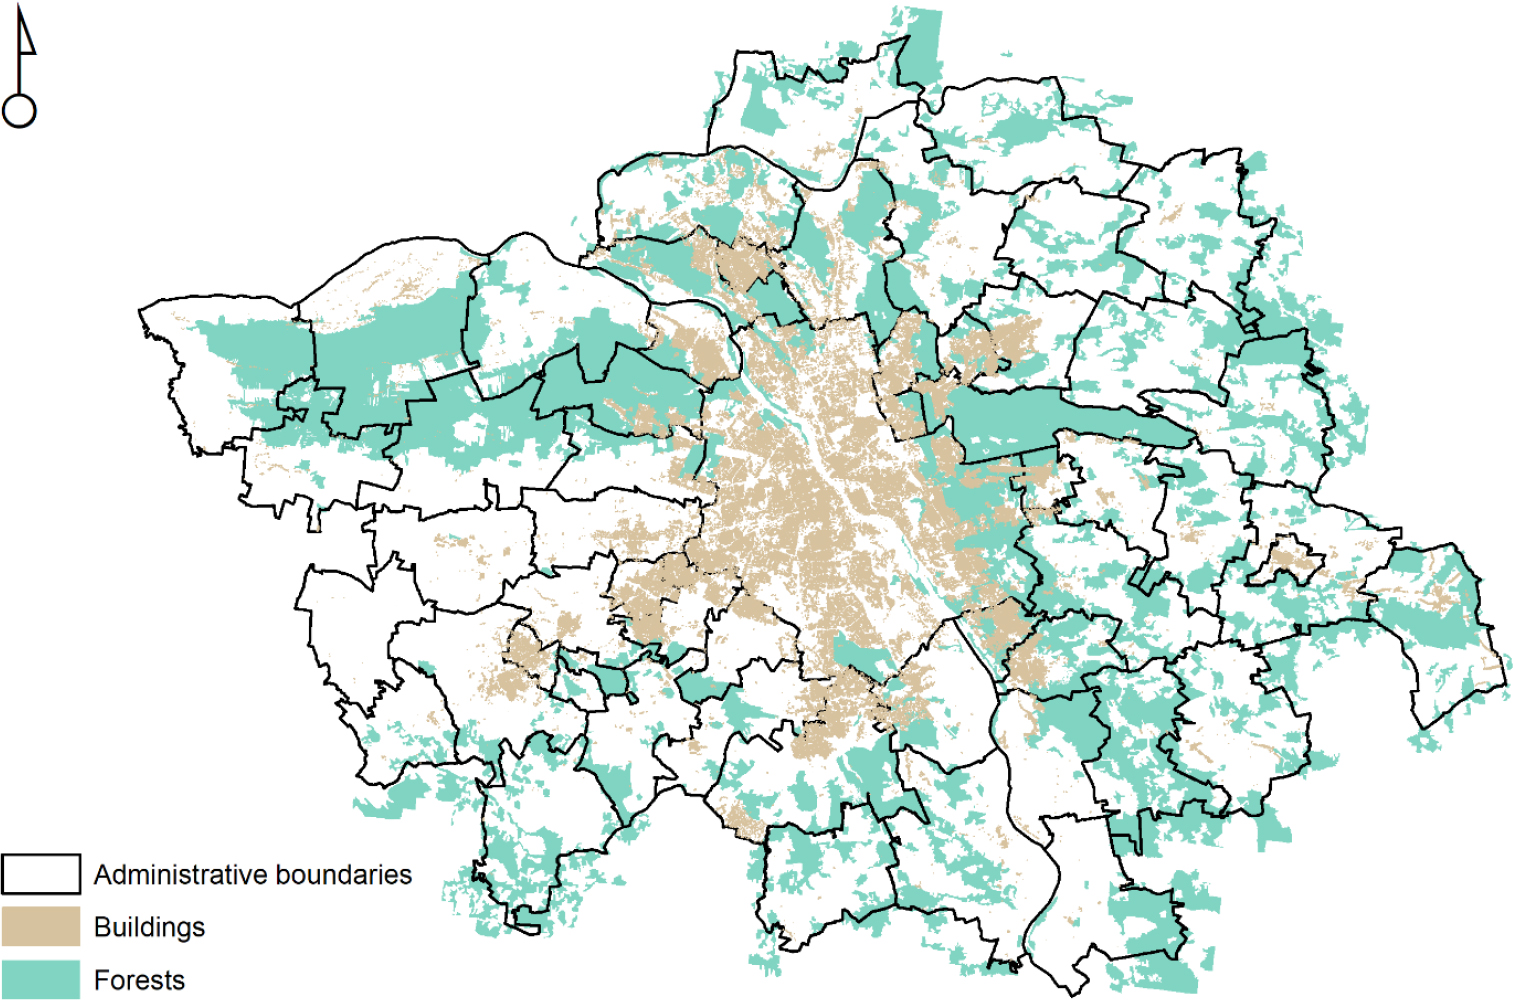
Figure 1.
Study area
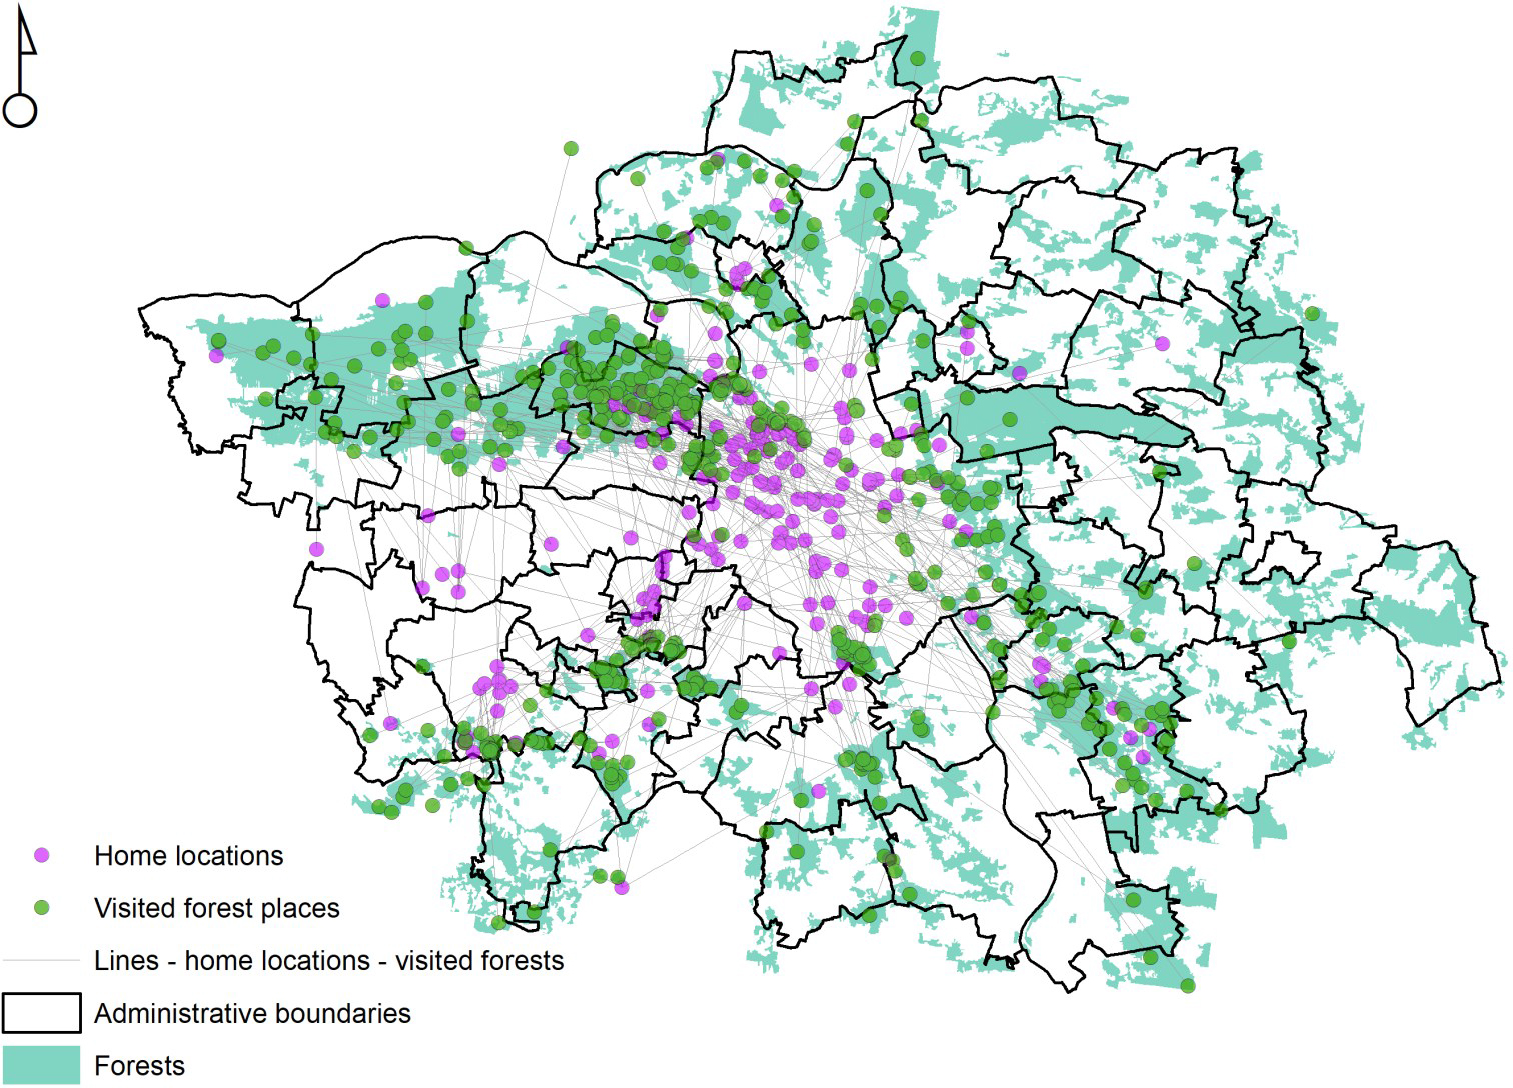
Figure. 2.
Distribution of respondents’ places of residence and the forest areas visited within the Warsaw metropolitan area
Table 1.
Categories of cultural ecosystem services and their definitions used in participatory mapping
| CES category | Definitions | CES category | Definitions |
|---|---|---|---|
| Recreation value | Areas important for outdoor recreation (e.g. camping, walking, running, cycling, horse riding) | Social relations | Support for social activities and strengthening the sense of community (e.g. forest trips with friends, family activities, joint environmental education activities, etc.) |
| Landscape aesthetics | Areas important due to their natural beauty and/or landscapes. | Emotional value | Emotional attachment to forest areas (a personal bond with a specific forest area or place in the forest) |
| Environmental awareness | Promotion of environmental awareness and knowledge about nature through forest visits. | Cultural heritage | Preservation of cultural traditions and historical values |
| Health and therapeutic value | Promotion of physical and mental health and well-being | Spiritual and religious value | Preservation of religious and spiritual values of forest areas or specific sites within forests |
Table 2.
Main characteristics of the research sample
| Gender | Income per capita in household per month | ||
|---|---|---|---|
| Men | 44% | Below 3,000 PLN | 3.7% |
| Women | 56% | 3,000–5,000 PLN | 31.2% |
| Education | 5,000–10,000 PLN | 49.5% | |
| Primary | 0.5% | Above 10,000 PLN | 15.6% |
| Secondary or vocational | 7.8% | Standard of living | |
| Higher | 91.7% | Average | 21.6% |
| Place of living | Good | 53.7% | |
| Rural areas | 27.1% | Very Good | 24.7% |
| City with fewer than 25,000 inhabitants | 5.5% | ||
| City with a population between 25,000 and 100,000 | 13.7% | ||
| City with more than 100,000 inhabitants, | 53.7% | ||
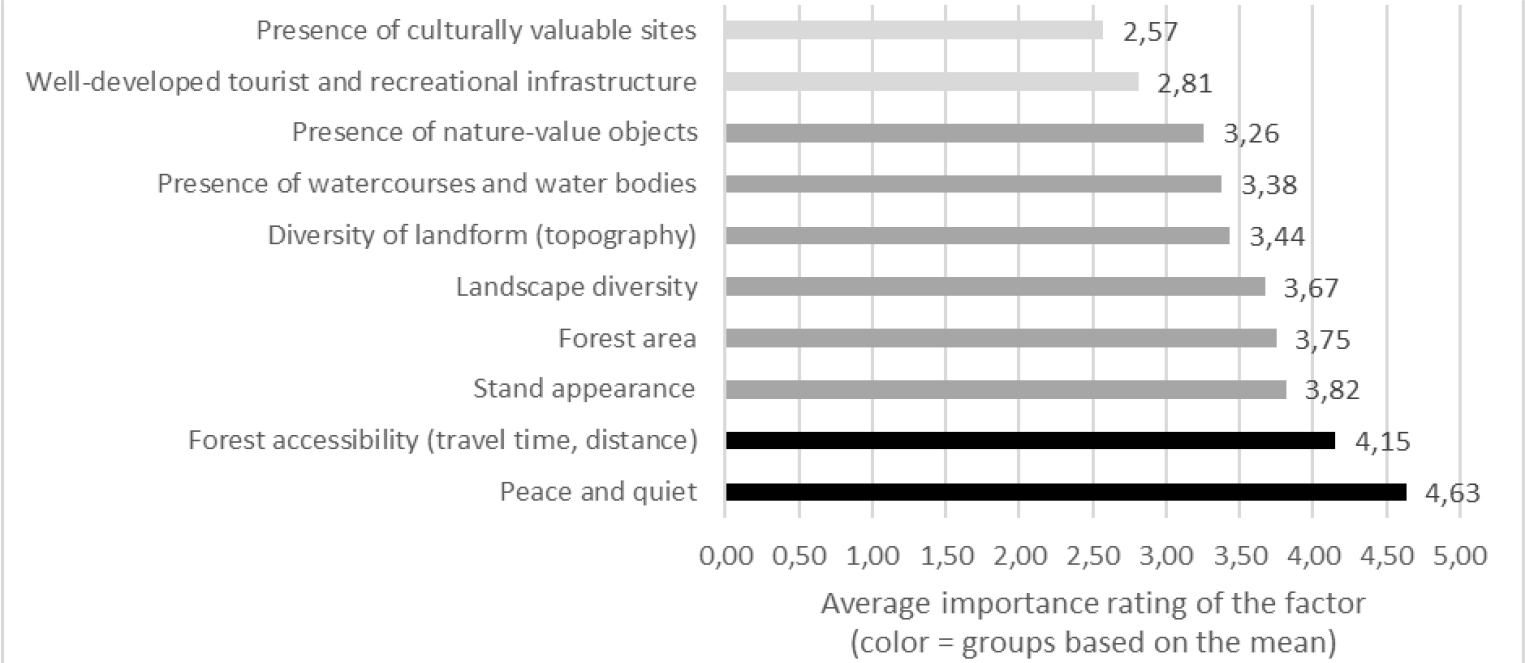
Figure 3.
Average importance rating of selected factors influencing the choice of recreation sites in forests
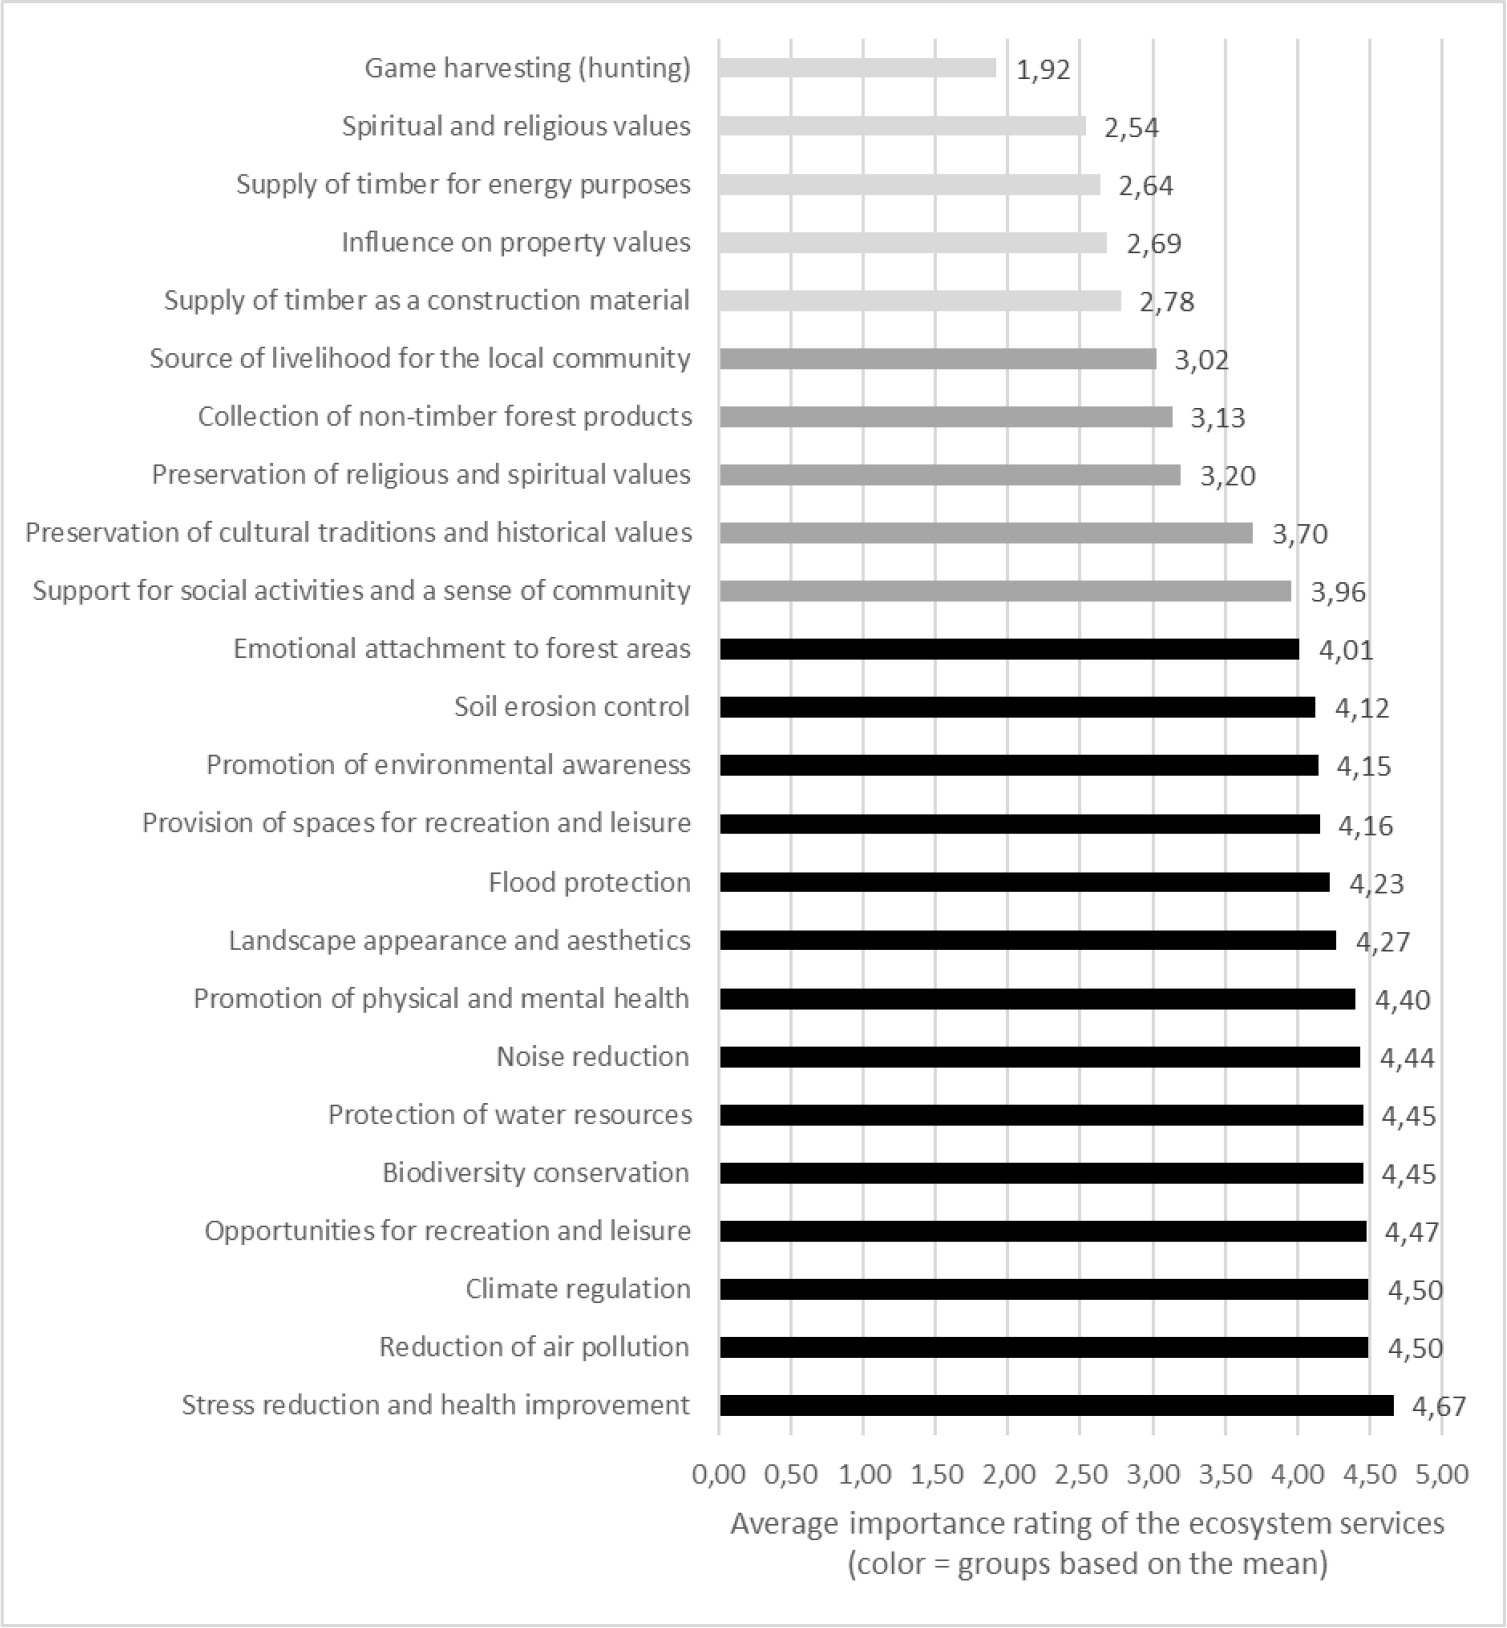
Figure 4.
Average importance rating of selected ecosystem services for respondents
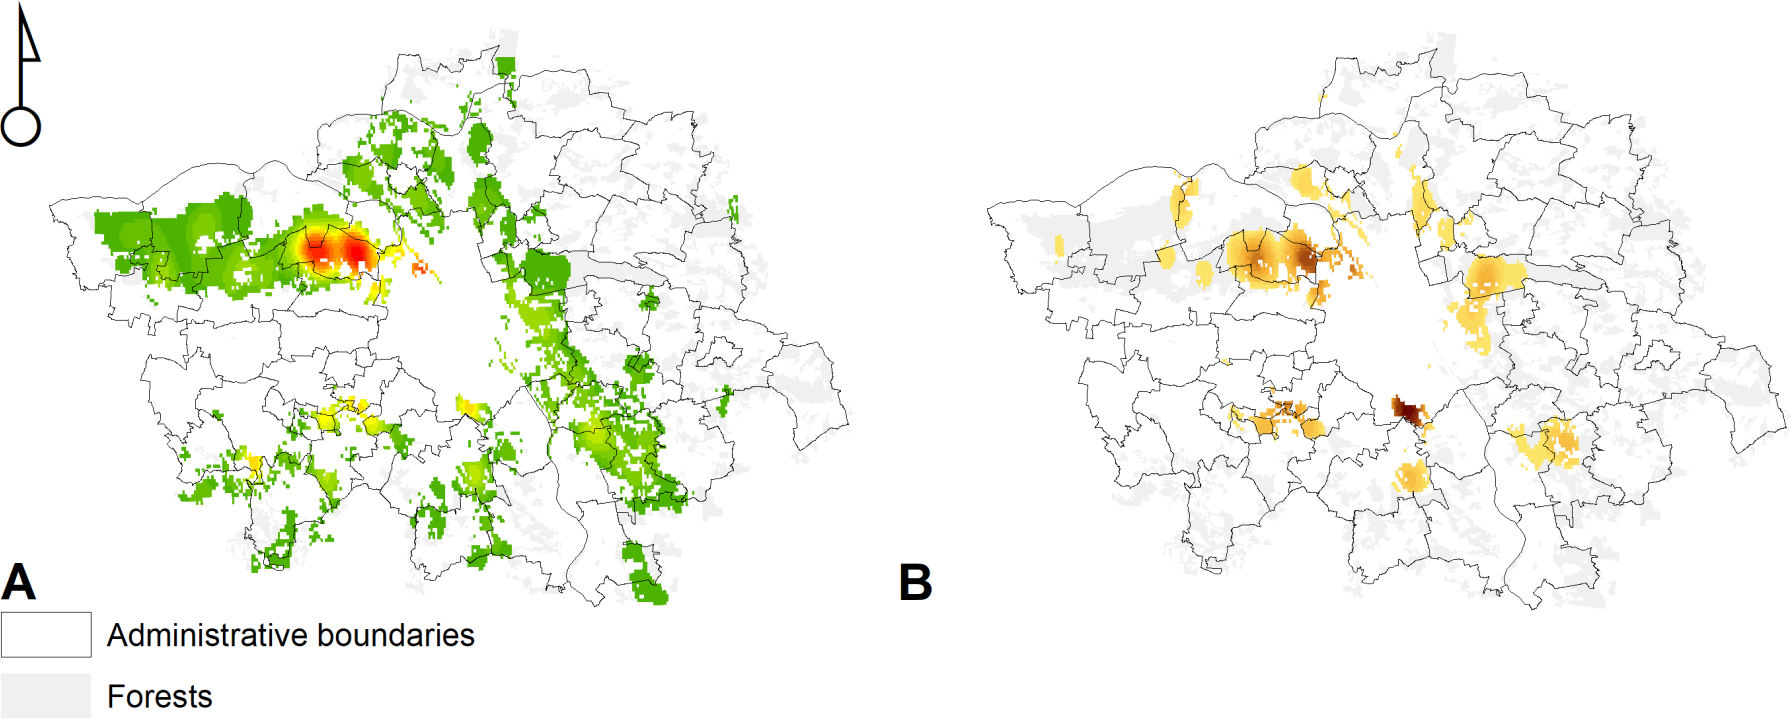
Figure 5.
Hotspots of urban and suburban forest recreation services (upper map) and disservices (lower map), using kernel density estimates for point features. Red color indicates hotspots, whereas point density gradually decreases from red to light green/yellow colors.
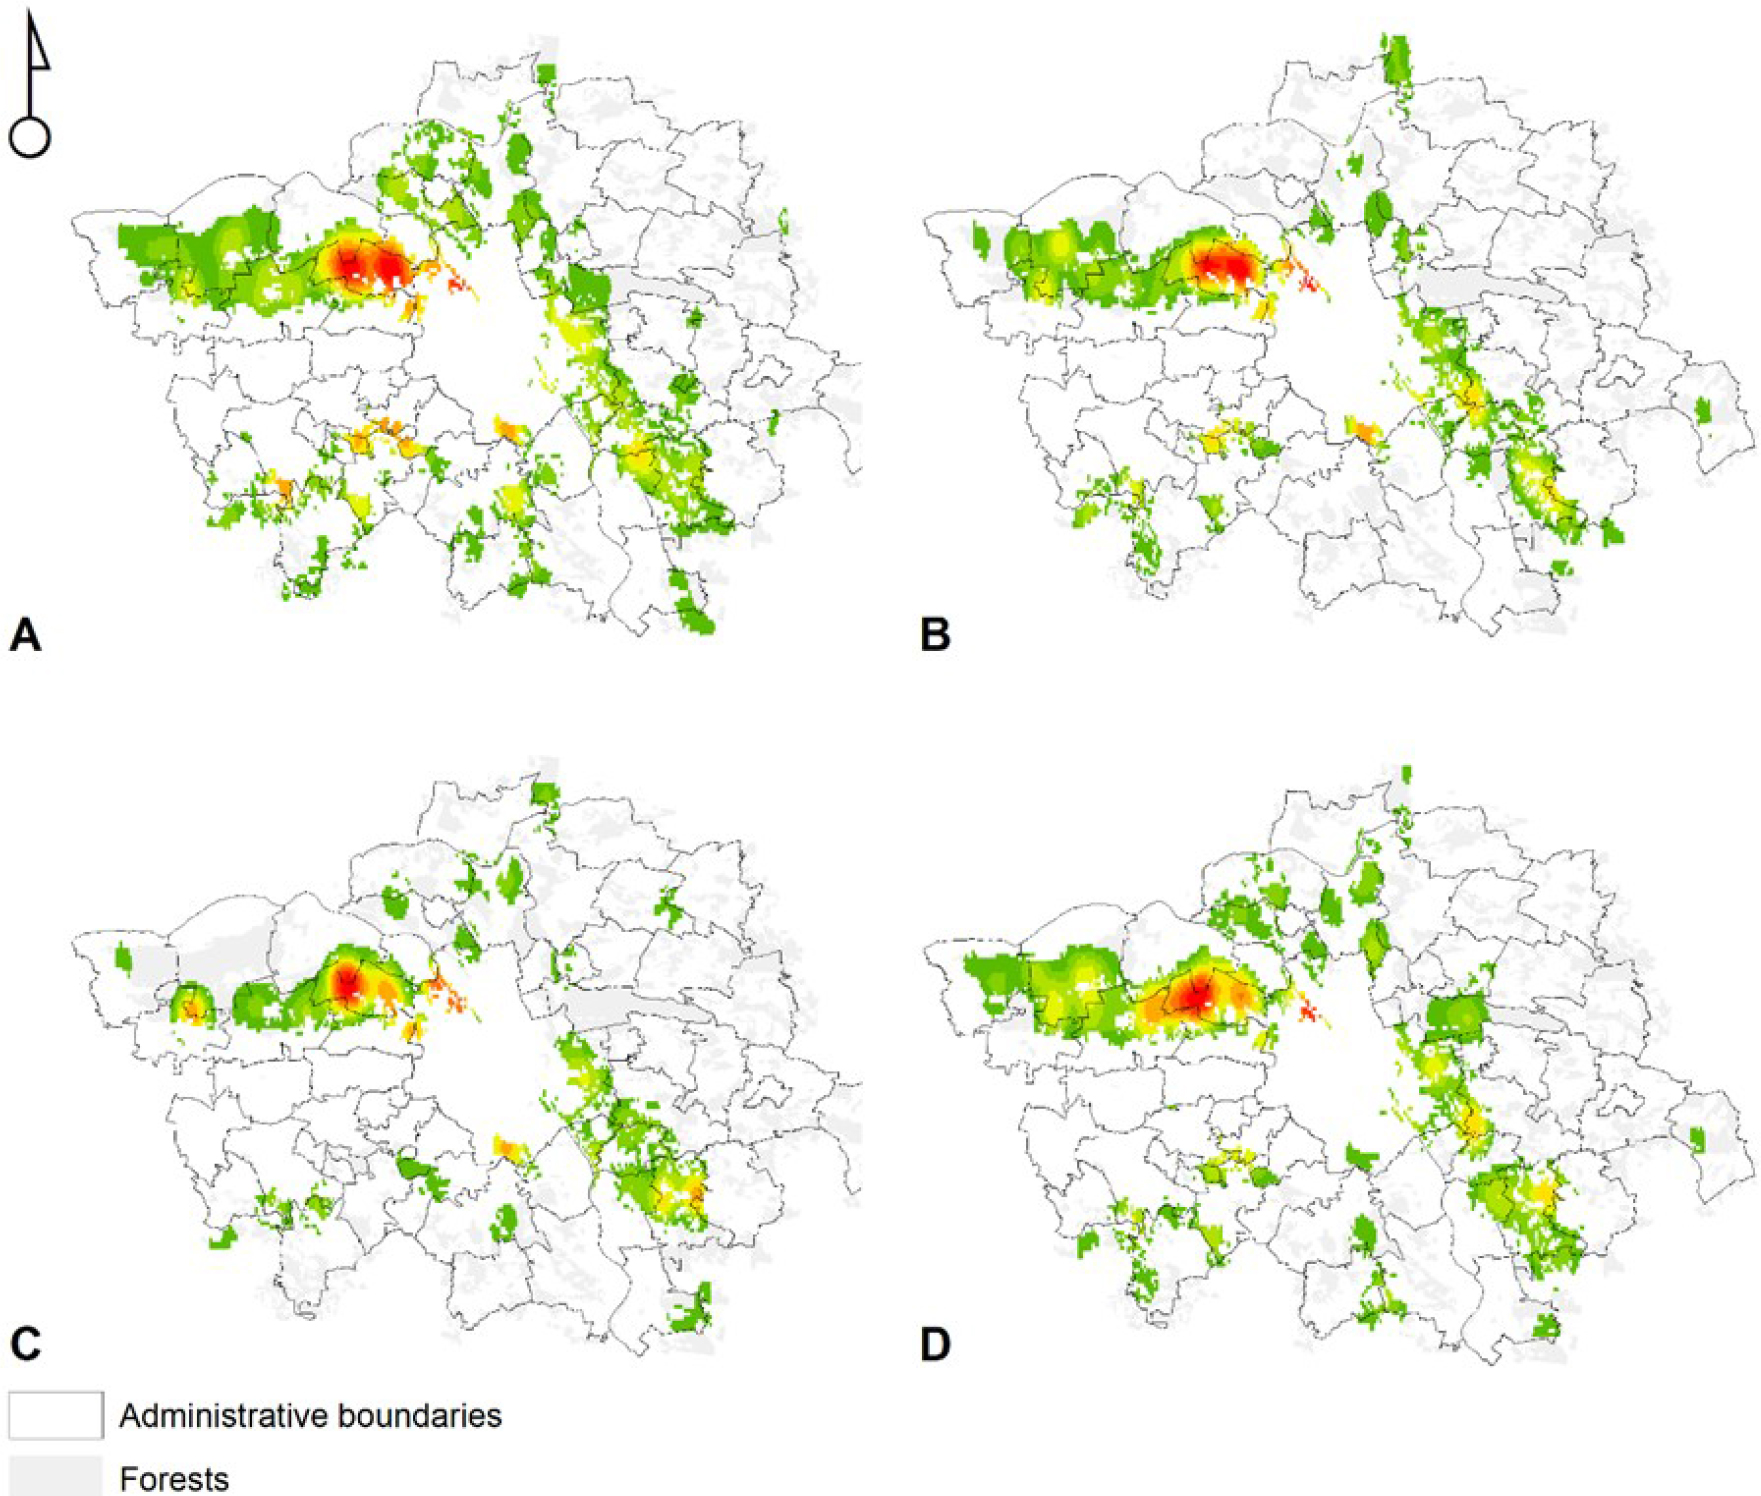
Figure 6.
Hotspots of urban and suburban cultural ecosystem services a) recreation, b) health, c) social, d) landscape, using kernel density estimates for point features. Red color indicates hotspots, whereas point density gradually decreases from red to light green colors.