
Introduction
The concept of ecosystem services in Polish forestry is only beginning to emerge as a subject of research and public debate. Due to historical circumstances, the concept of forest functions remains widely used in Poland (Kaliszewski et al. 2024). However in the 2024 Forest Management Instruction introduced provisions concerning the identification of selected ecosystem services provided by forests (Instruction 2024). The ecosystem services framework highlights that forests provide both direct and indirect material and non-material benefits to society (Costanza et al., 1997; Brodrechtova 2024). Ecosystem services are typically divided into four main categories (Maes et al. 2016): provisioning services (e.g., timber production, collection of forest fruits), regulating services (e.g., local climate regulation, water retention), supporting services (e.g., soil productivity support), and cultural services (e.g., recreation, leisure) (CES). The concept of ecosystem services has already been incorporated into key strategic and planning documents at both the European Union level and in Poland (Kaliszewski et al. 2024).
Understanding which ecosystem services are valued most by different social groups is of key importance. As numerous studies indicate, for residents of highly urbanized areas the most important are regulating and cultural ecosystem services (Hegetschweiler et al. 2022; Nastran et al. 2022; Hochmalová et al. 2022). This results from the specific conditions of living in urban environments, such as high levels of air pollution, limited availability of green spaces, urban development pressure, and the manner in which public spaces are designed and maintained. These factors lead urban residents to place particular emphasis on ecosystem services that can mitigate environmental impacts and improve overall quality of life. Research also points to a strong need for contact with nature among people living in large metropolitan areas (Pearlmutter et al. 2017). Forest areas serve as spaces for everyday recreation, restoration, and enhancement of physical and mental well-being (Gołos 2018). Consequently, CES take on particular importance for this group.
An important area of research on CES involves identifying social preferences, mapping the spatial distribution of services, and quantifying forest areas in terms of both their potential and the demand for the CES they provide. To date, the most commonly used research methods include surveys and interviews, which allow researchers to capture respondents’ subjective perceptions and the values they assign to individual services (Ciesielski et al. 2024). Remote sensing data (e.g., satellite imagery) are primarily used to assess the spatial potential of forests to provide CES and to identify areas with high recreational suitability (Vaz et al. 2019). In contrast, mobile phone data and volunteered geographic information (VGI) have been used to analyse the spatiotemporal distribution of recreational activity in forested areas (Heikinheimo et al. 2020; Grzyb et al. 2021). Additionally, the use of machine learning methods to analyse user-generated content has enabled indirect inference about the motivations behind visits and the values attributed to specific ecosystem services. Increasing attention is also being paid to combining declarative data (e.g., survey data) with observational (quantitative) data, which provides for a more holistic understanding of CES-related issues and helps to reduce the limitations of relying on a single method (Vilalta Capdevila et al. 2024). In recent years, us erengagement methods such as Public Participation Geographic Information Systems (PPGIS), which actively involve various stakeholder groups, have become increasingly prominent (Brown and Fagerholm 2015). PPGIS is applied in many research areas, including spatial planning (Kantola et al. 2023), green–blue infrastructure management (Heikinheimo et al. 2020), and smart cities (Pérez-del Hoyo and Mora 2019). PPGIS is also widely used in various forestry-related fields (Gerstenberg et al. 2020; Tolvanen et al. 2020). In the context of ecosystem services, PPGIS is used to identify hotspots of CES, that is, areas of particular importance for communities in terms of recreation, leisure, landscape values, or spiritual significance (Baumeister et al. 2020; Korpilo et al. 2023). PPGIS not only enables the assessment of demand for selected ecosystem services but also helps explain why some areas have greater service-provision potential than others. The use of PPGIS allows the collection of spatial data and provides insights into ecosystem services from the perspectives of different user groups (landowners, decision-makers, and the general public) and supports the identification of potential conflicts (Brown and Fagerholm 2015; Karimi and Adams 2019).
In Poland, previous studies on CES have used a variety of methodological approaches (e.g., Janeczko et al. 2023; Ciesielski and Kaminska 2023; Ciesielski et al. 2024). However, surveys incorporating a PPGIS module have been applied in the forestry context only sporadically. Considering the growing importance of ecosystem services for society (Grzyb et al. 2021; Vos et al. 2022; Janeczko et al. 2023), as well as the intensifying public debate in recent years concerning the functions and management of forests, we decided to apply the PPGIS method in the present study. The aim of this questionnairebased study, conducted using the PPGIS module, was to identify the factors determining the choice of forest areas in the Warsaw metropolitan area as places for recreation, as well as factors discouraging the use of forests for recreational purposes. In addition, the study aimed to assess the importance of ecosystem services provided by forests and to spatially map not only locations preferred for recreation and those avoided by respondents, but also areas considered valuable in terms of CES. The study should be regarded as a pilot investigation conducted on a nonrepresentative sample of residents of the Warsaw metropolitan area.
Material and methods
Study area
The forests examined in this study are located within the Warsaw metropolitan area, which is inhabited by more than 3.3 million people (GUS 2024a) (Fig. 1). According to the administrative division of the State Forests, the vast majority of these forest areas fall within the jurisdiction of the Regional Directorate of State Forests in Warsaw and include areas managed by the following forest districts: Celestynów, Chojnów, Drewnica, Jabłonna, and Minsk. Only the southern part of the analyzed area lies within the territorial range of the Grójec Forest District, which is subordinated to the Regional Directorate of State Forests in Radom. The scope of the study also includes forests of other ownership forms, including private forests, forests managed by the Municipal Forests of Warsaw, as well as areas within Kampinos National Park. The total forest area within the study region amounts to 1,148 km2, representing 19.8% of its total area. The ownership structure indicates a slight predominance of public forests (56%) over private forests (44%) (GUS 2024b).
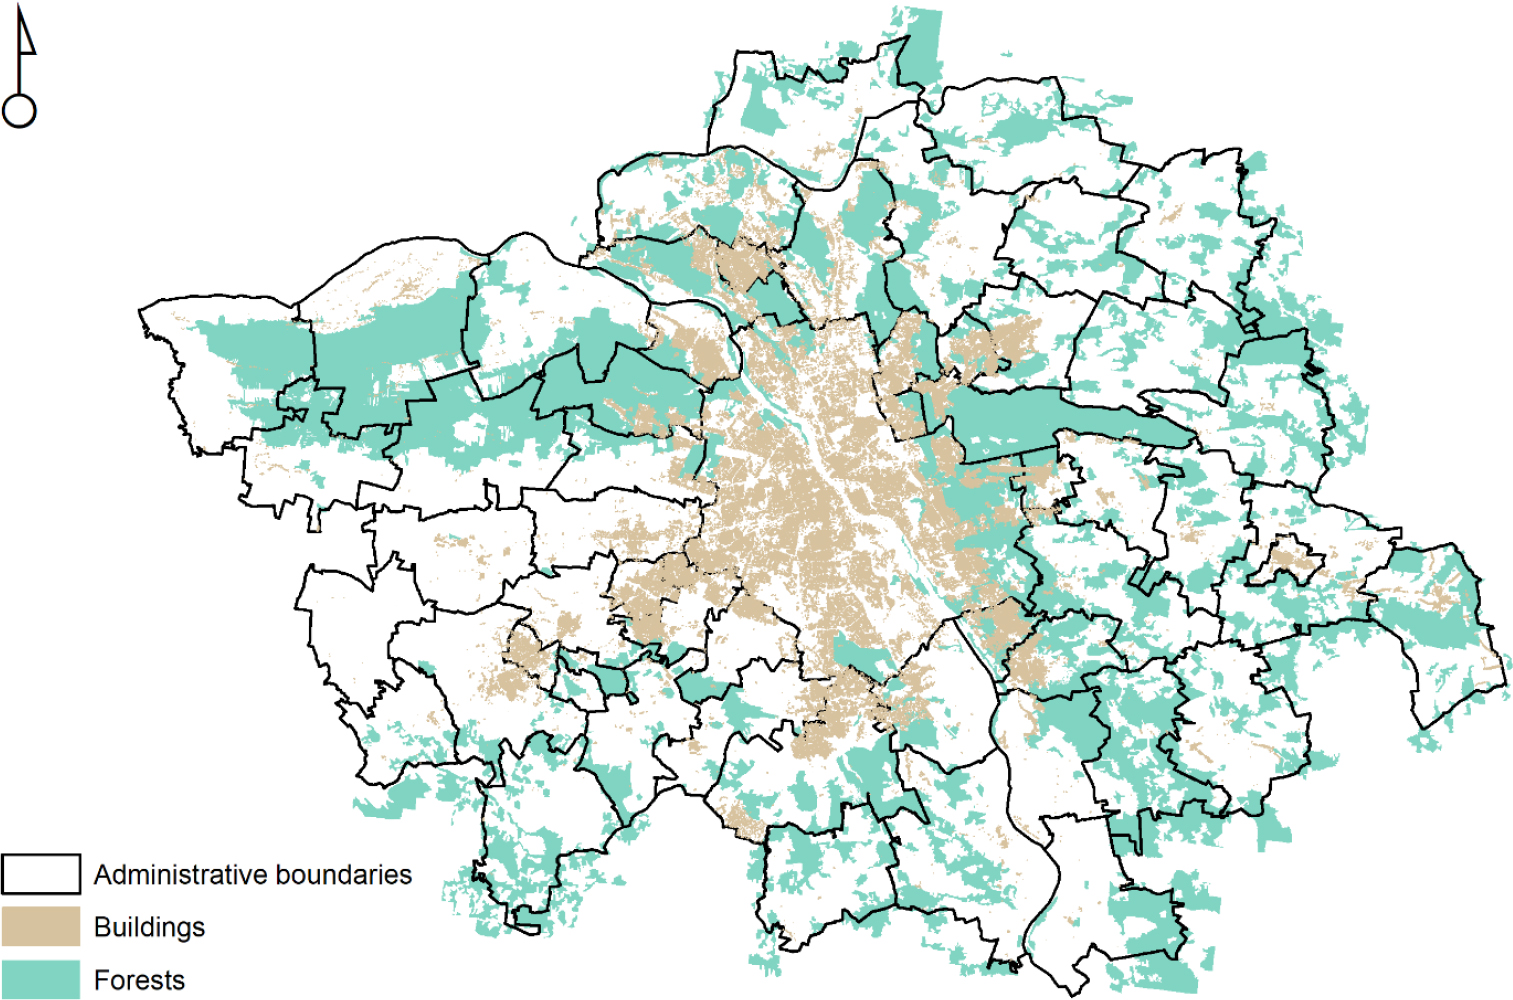
Figure 1.
Study area
Due to the high population of the Warsaw metropolitan area, which is projected to continue growing, dynamic urbanization processes, and a forest cover index lower than the national average, forest areas provide the local community with numerous and diverse ecosystem services. As early as the 1980s, these forests were classified as areas of primary recreational importance (Jaszczak 2008). Their social function is also reflected in numerous bottom-up initiatives and conflicts related to their use, management, and development (Niedziałkowski and Chmielewski 2023).
Online survey
The survey was conducted between 24 February and 23 March 2025. The questionnaire was distributed via social media platforms, including Facebook and LinkedIn. On Facebook, the survey link was posted on the project’s official page and subsequently shared on forums and in groups of residents from municipalities within the Warsaw metropolitan area. In addition, information about the study was disseminated a total of 19 times by private individuals and non-governmental organizations (e.g. Zapuszczeni, Europa i My). According to available data, the information about the survey reached 7,773 Facebook users. In the case of LinkedIn, the post announcing the study reached 564 users. In order to extend the outreach to all municipalities within the Warsaw metropolitan area, requests were also sent to local authorities to publish the survey on their official websites and social media channels.
The questionnaire was designed using the Maptionnaire tool, which is widely applied in studies employing participatory mapping (Brown and Fagerholm 2015; Müller et al. 2019). It enables not only the collection of responses to various types of survey questions but also the acquisition of spatial information through respondents marking relevant elements on a map. Previous studies employing the Maptionnaire platform indicate that these tools are user-friendly and intuitive (Kahila-Tani et al. 2015). However, given the relatively limited popularity of this type of survey in Poland, a tutorial explaining how to complete the mapping component was provided to respondents. This tutorial included instructions on navigating the interface and on adding and removing mapbased responses. The questionnaire consisted of 12 pages and included a total of 28 closed-ended single- and multiple-choice questions, as well as four questions incorporating the mapping component.
All questions, with the exception of the map-based questions, were mandatory. The structure of the questionnaire comprised the following thematic sections:
I) Demographic profile – including questions on gender, age, level of education, income, marital status, and subjective assessment of standard of living;
II) Characteristics of place of residence - covering housing type and the availability of green spaces in the immediate surroundings;
III) Visits to forest areas - addressing visit frequency, time of day and season, motivating factors, and barriers limiting the use of forest areas;
IV) Ecosystem services - including a brief conceptual introduction and questions examining the importance of selected ecosystem services from the respondents’ perspective. In this section, the order of answer options was randomized;
V) Environmental education - referring to prior participation in educational activities as well as selfassessment of knowledge in the fields of ecology and forestry;
VI) Map-based questions - in the mapping section, respondents were asked to indicate on the map up to five forest locations they visited most frequently (Fig. 2). Additionally, they could assign up to three activities undertaken during visits to each selected location. In the subsequent question, participants were asked to mark up to five locations they avoid as recreational sites, with the possibility of indicating up to three reasons for avoiding these areas from a predefined list. The final map-based question concerned the identification of up to five locations considered by respondents to be particularly valuable in the context of each category of CES. Definitions of individual CES categories were provided to respondents within the question text (Tab. 1).
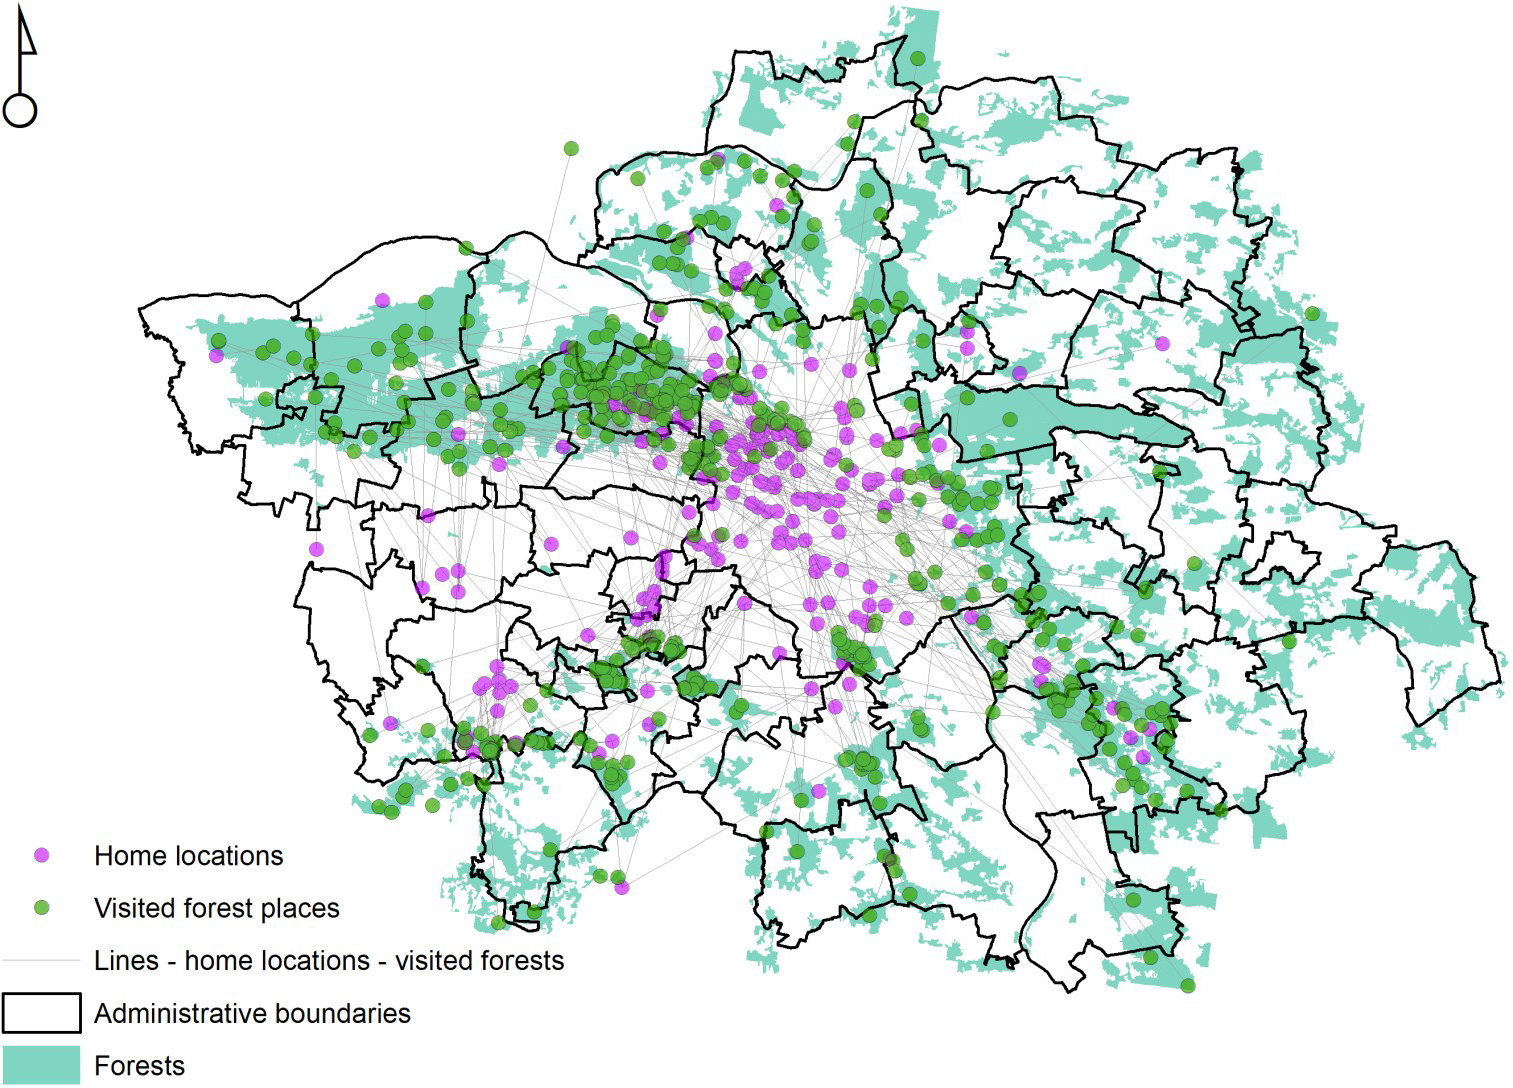
Figure. 2.
Distribution of respondents’ places of residence and the forest areas visited within the Warsaw metropolitan area
Table 1.
Categories of cultural ecosystem services and their definitions used in participatory mapping
| CES category | Definitions | CES category | Definitions |
|---|---|---|---|
| Recreation value | Areas important for outdoor recreation (e.g. camping, walking, running, cycling, horse riding) | Social relations | Support for social activities and strengthening the sense of community (e.g. forest trips with friends, family activities, joint environmental education activities, etc.) |
| Landscape aesthetics | Areas important due to their natural beauty and/or landscapes. | Emotional value | Emotional attachment to forest areas (a personal bond with a specific forest area or place in the forest) |
| Environmental awareness | Promotion of environmental awareness and knowledge about nature through forest visits. | Cultural heritage | Preservation of cultural traditions and historical values |
| Health and therapeutic value | Promotion of physical and mental health and well-being | Spiritual and religious value | Preservation of religious and spiritual values of forest areas or specific sites within forests |
The mapping component was prepared using an OpenStreetMap base layer, supplemented with the forest areas included in the study and a locational grid referring to respondents’ place of residence. Participation in the study was restricted to respondents who confirmed that they had visited forests located within the Warsaw metropolitan area during the previous 12 months. Only these individuals were allowed to proceed to the subsequentsections of the questionnaire. In total, 220 respondents participated in the study. All respondents provided informed consent in accordance with the General Data Protection Regulation (GDPR) (Ustawa 2018). All collected data, including spatial information, were anonymized prior to analysis and stored in a form that prevents the identification of individual participants.
Characteristics of respondents
In the survey, 56.0% of respondents were women and 44.0% were men (Tab. 2). The mean age of participants was 45.5 years, with the youngest respondent being 18 years old and the oldest 76 years old. The vast majority of respondents reported having higher education (91.7%). Secondary or vocational education was declared by 7.8% of participants, while only one individual (0.5%) reported primary education. Among fields of education, the most frequently indicated was the natural sciences profile (26.1%), followed by technical (21.6%) and humanities (20.6%). With respect to place of residence, 53.7% of respondents lived in a city with more than 100,000 inhabitants, 27.1% in rural areas, 13.7% in a city with a population between 25,000 and 100,000, and 5.5% in acity with fewer than 25,000 inhabitants. Additionally, 54.6% of respondents lived in multi-family housing, whereas 31.2% resided in detached single-family housing. Nearly half of the participants (49.5%) reported that the per capita income in their household ranged from 5,000 to 10,000 PLN per month, and 31.2% indicated an income between 3,000 and 5,000 PLN. The standard of living was assessed as “good” by 53.7% of respondents, “very good” by 24.7%, and “average” by 21.6%. The sample is characterized by a high share of respondents with higher education and relatively high-income levels, indicating that the results should be interpreted with caution in terms of representativeness.
Table 2.
Main characteristics of the research sample
| Gender | Income per capita in household per month | ||
|---|---|---|---|
| Men | 44% | Below 3,000 PLN | 3.7% |
| Women | 56% | 3,000–5,000 PLN | 31.2% |
| Education | 5,000–10,000 PLN | 49.5% | |
| Primary | 0.5% | Above 10,000 PLN | 15.6% |
| Secondary or vocational | 7.8% | Standard of living | |
| Higher | 91.7% | Average | 21.6% |
| Place of living | Good | 53.7% | |
| Rural areas | 27.1% | Very Good | 24.7% |
| City with fewer than 25,000 inhabitants | 5.5% | ||
| City with a population between 25,000 and 100,000 | 13.7% | ||
| City with more than 100,000 inhabitants, | 53.7% | ||
Statistical analyses
Respondents’ answers concerning the importance of ecosystem services were transformed into a Likert scale, in which the responses not important, slightly important, moderately important, important, and very important were assigned values of 1, 2, 3, 4, and 5, respectively. Subsequently, the mean value of responses from completed questionnaires was calculated for each ecosystem service.
Differences among ecosystem services were analysed using the Kruskal-Wallis test (α < 0.05). When statistically significant differences between services were identified, Dunn’s post hoc test with Holm correction was applied. This procedure resulted in a matrix of statistical significance for each pair of ecosystem services. Based on the resulting matrix of pairwise significance, statistically homogeneous groups of ecosystem services were identified. Services that did not differ significantly were grouped into three priority categories (high, medium, and low).
A similar procedure was applied to group factors influencing the choice of recreational sites as well as factors leading to the avoidance of recreational areas. In that case, the only modification concerned the reclassification of responses into numerical form, where the responses very strongly, strongly, moderately, slightly, and very slightly were assigned values from 5 to 1, respectively.
The spatial mapping of the distribution of recreational sites, locations avoided by respondents for recreational purposes, selected CES, as well as the identification of areas with the highest intensity of these phenomena, was conducted using the kernel density tool, which is designed for point-based analyses (ArcGIS version 10.5). A search radius of 5,000 m was defined for the calculation of the density maps. The choice of a 5,000 m search radius follows previous studies, although it implies a generalized representation of spatial patterns. A similar mapping approach was applied by Baumeister et al. (2022).
Results
Forest visits
Most frequently season chosen by respondents for leisure activities in forest areas was spring (42.2%), followed by summer (32.6%) and autumn (17.4%). Winter was the least popular, with only 7.8% visiting forests during this season. More than 80% of respondents indicated Saturday and Sunday as the days on which they most often visit the forest. The most commonly reported visit frequency was 1–2 times per week (41.3%), while 12.8% of respondents declared daily visits.
Respondents also evaluated the influence of ten factors on their decisions regarding the choice of recreational site. The highest-rated factors were the opportunity to find peace and quiet (mean score 4.63 on a five-point scale) and forest accessibility, understood as travel time and distance (mean score 4.15) (Fig. 3). These factors formed the first homogeneous group. The second group consisted of factors with mean scores ranging from 3.26 to 3.82, namely: stand appearance, forest area, landscape diversity, variation in landform, and the presence of watercourses and water bodies, as well as nature-value objects. The third homogeneous group comprised two factors: well-developed tourist and recreational infrastructure and the presence of culturally valuable sites.
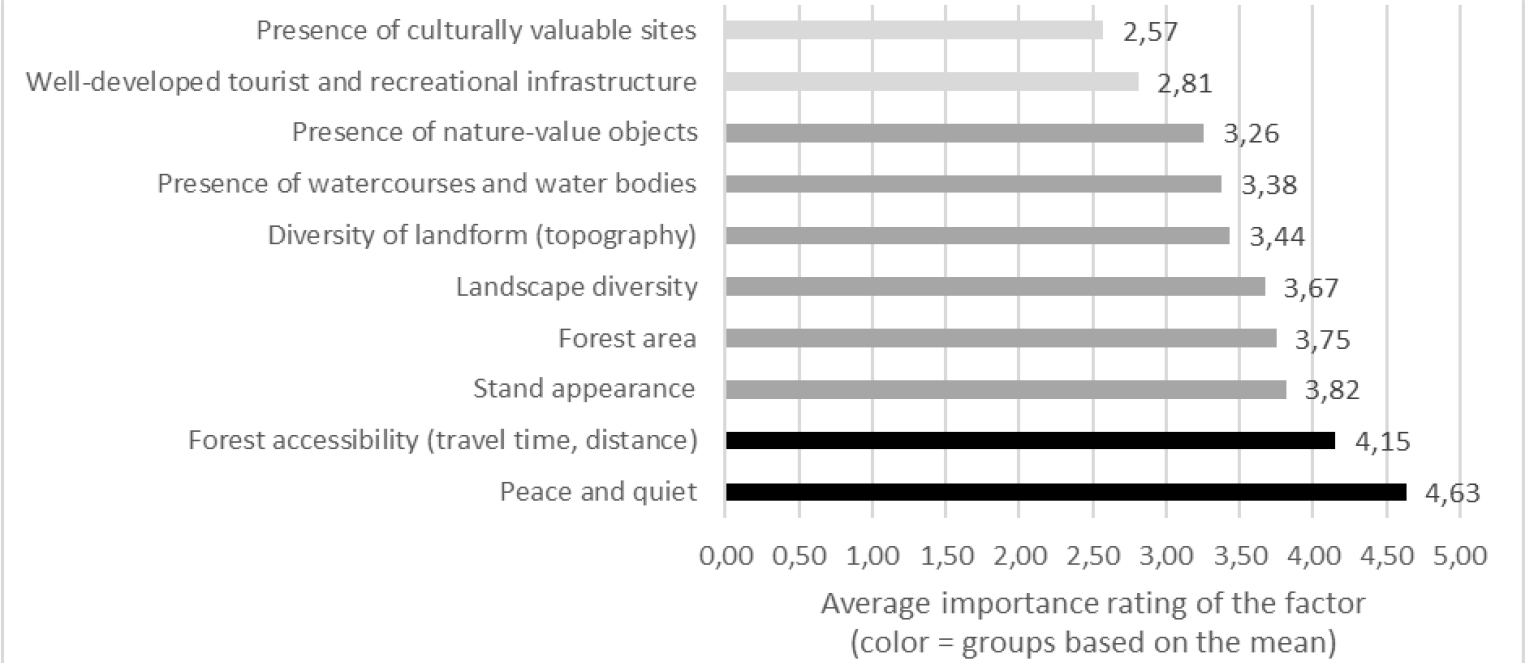
Figure 3.
Average importance rating of selected factors influencing the choice of recreation sites in forests
Among the factors discouraging respondents from choosing the forest as a place for recreation, the most important were noise (4.07), acts of vandalism (3.97), the presence of stray dogs or dogs off-leash (3.72), and the risk of theft or assault (3.59). These are therefore primarily factors that disturb tranquility and reduce the sense of safety. The same homogeneous group also included: forest management activities, including timber harvesting; the presence of hunting stands; the presence of other people; fire hazard; excessive distance from the forest; limited access to public transportation; and the occurrence of insects (mainly mosquitoes and ticks). The factors with the least influence on the decision to avoid forests were the quality of tourist and recreational infrastructure (2.86) and an insufficient number of such facilities (2.70). Only these two factors were classified into the second homogeneous group. The results therefore indicate that issues related to safety and psychological comfort are considerably more important for visitors than infrastructural factors.
Respondents also evaluated the importance of 24 ecosystem services provided by forests (Fig. 4). Based on the results, three homogeneous groups were distinguished, differing in the scope and perceived significance of the individual service categories. The first group (mean scores ranging from 4.12 to 4.67) comprised exclusively regulating and cultural services, which exert the greatest influence on society’s perception of forest value. The highest-rated service was stress reduction and health improvement (4.67), underscoring the essential role of forests as spaces that support psychophysical restoration. Air pollution reduction and climate regulation were also highly rated (both 4.50). The second homogeneous group was dominated by cultural services and included a single provisioning service, namely the collection of non-timber forest products (3.13). The third homogeneous group encompassed five ecosystem services, three of which were provisioning services: game harvesting, the supply of timber for energy purposes, and the supply of timber as a construction material.
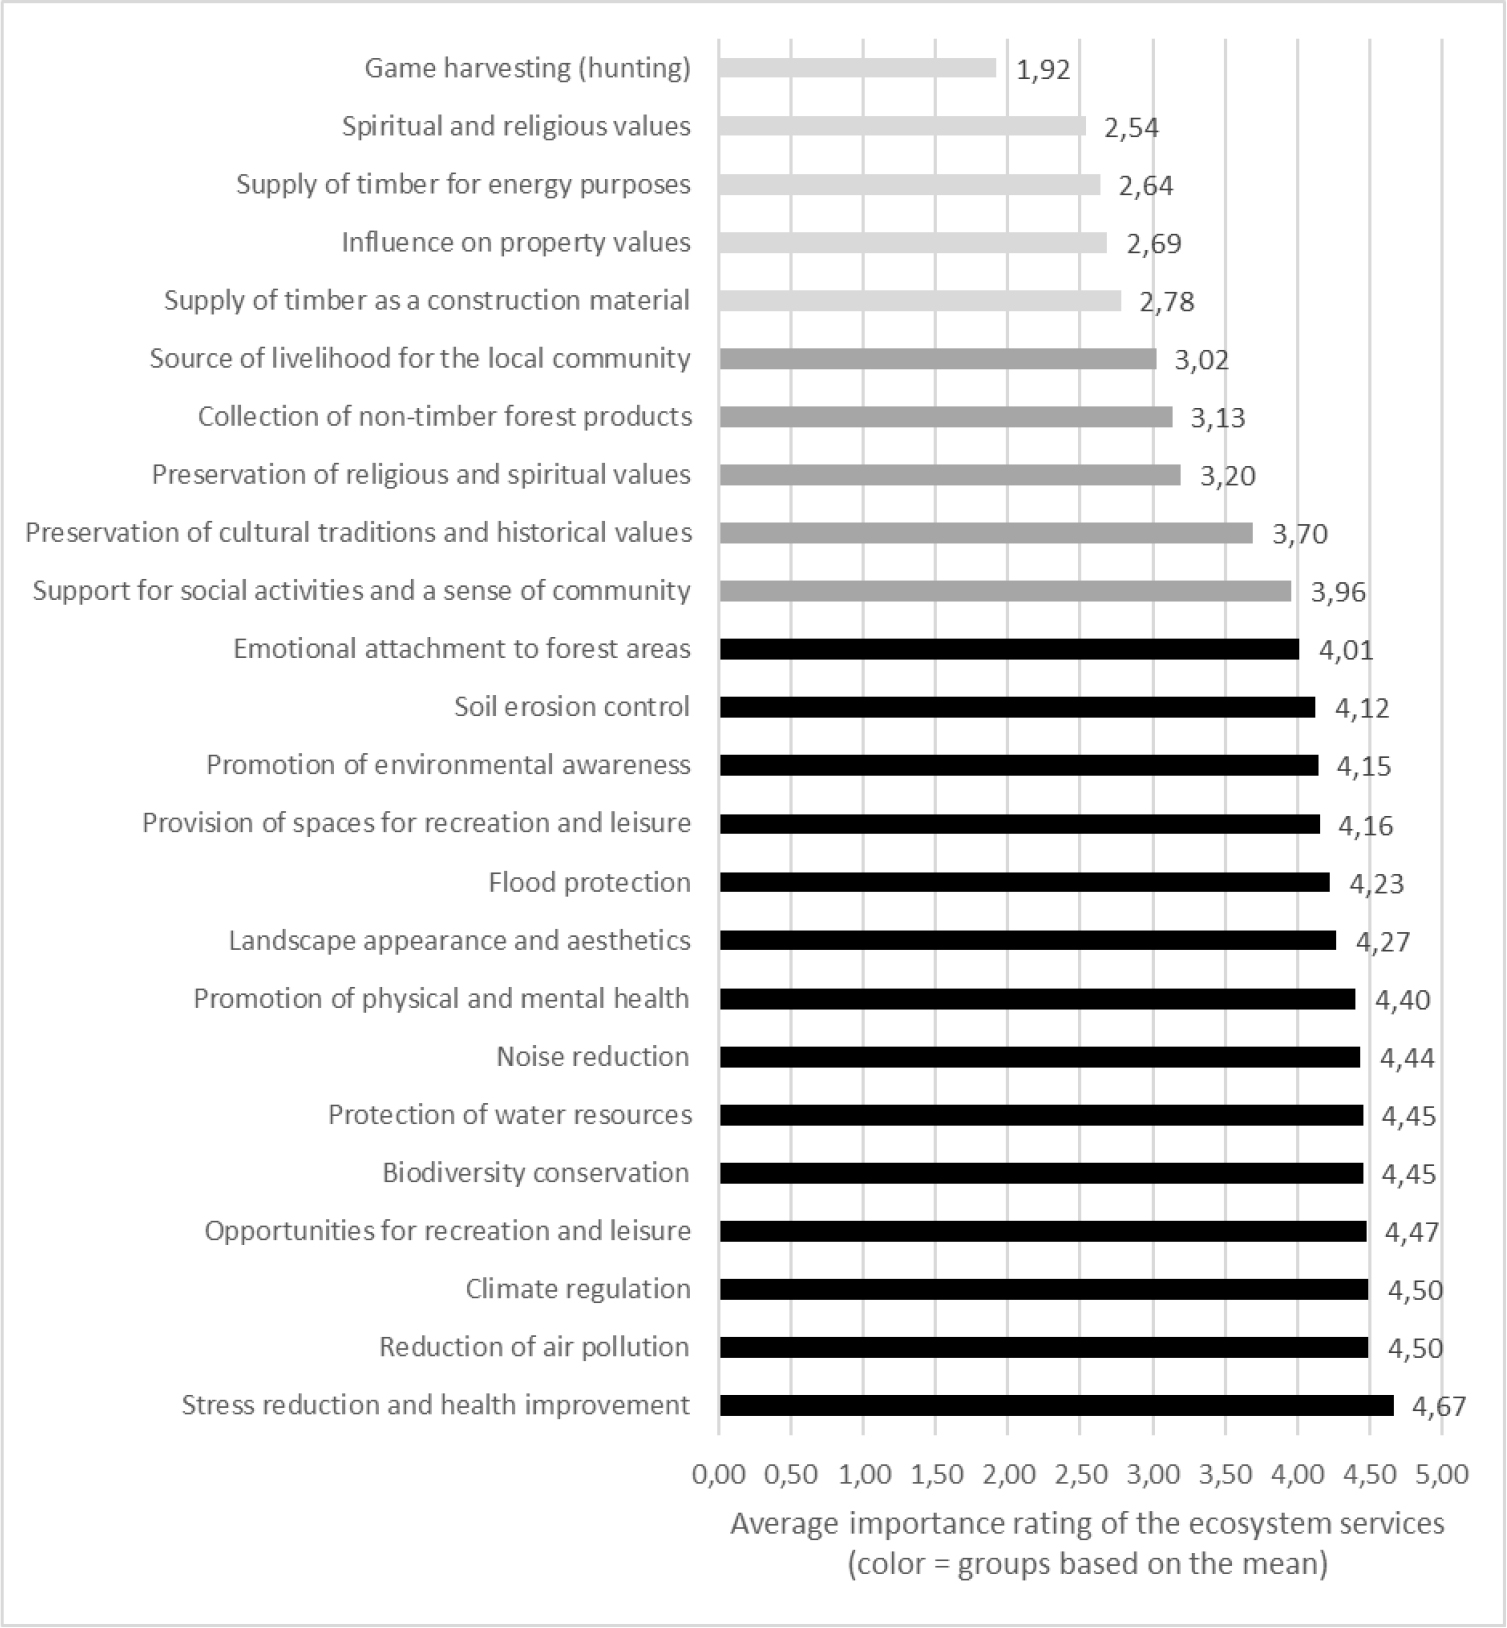
Figure 4.
Average importance rating of selected ecosystem services for respondents
Due to the non-mandatory nature of the questions in the PPGIS section, not all respondents chose to complete them. In total, 176 participants marked recreationally visited locations on the map. Altogether, 546 locations were identified, with the largest group of respondents (64 individuals) indicating five locations each. In the analysis of activities undertaken at the designated locations, physical activity was indicated most frequently (333 responses), followed by relaxation and leisure (225), nature observation (218), and contemplation of nature (215). Less popular activities included meetings with family and friends (104), walking a dog (97), mushroom picking (35), and seeking inspiration (14). For each location, a maximum of three activities could be selected. Locations avoided for recreational purposes were marked by 60 respondents, who to gether indicated 127 locations. Similarly, up to three reasons for avoidance could be assigned to each location. The most frequently indicated category was crowding (66), followed by a low sense of safety (31), traces of forest management activities related to timber harvesting (e.g. clear-cuts) (24), and the presence of vandalism and littering (24) (Fig. 5). The mean distance of the mapped points from the respondents’ declared place of residence varied, amounting to 1,991 m for recreational locations and 939 m for locations avoided by respondents.
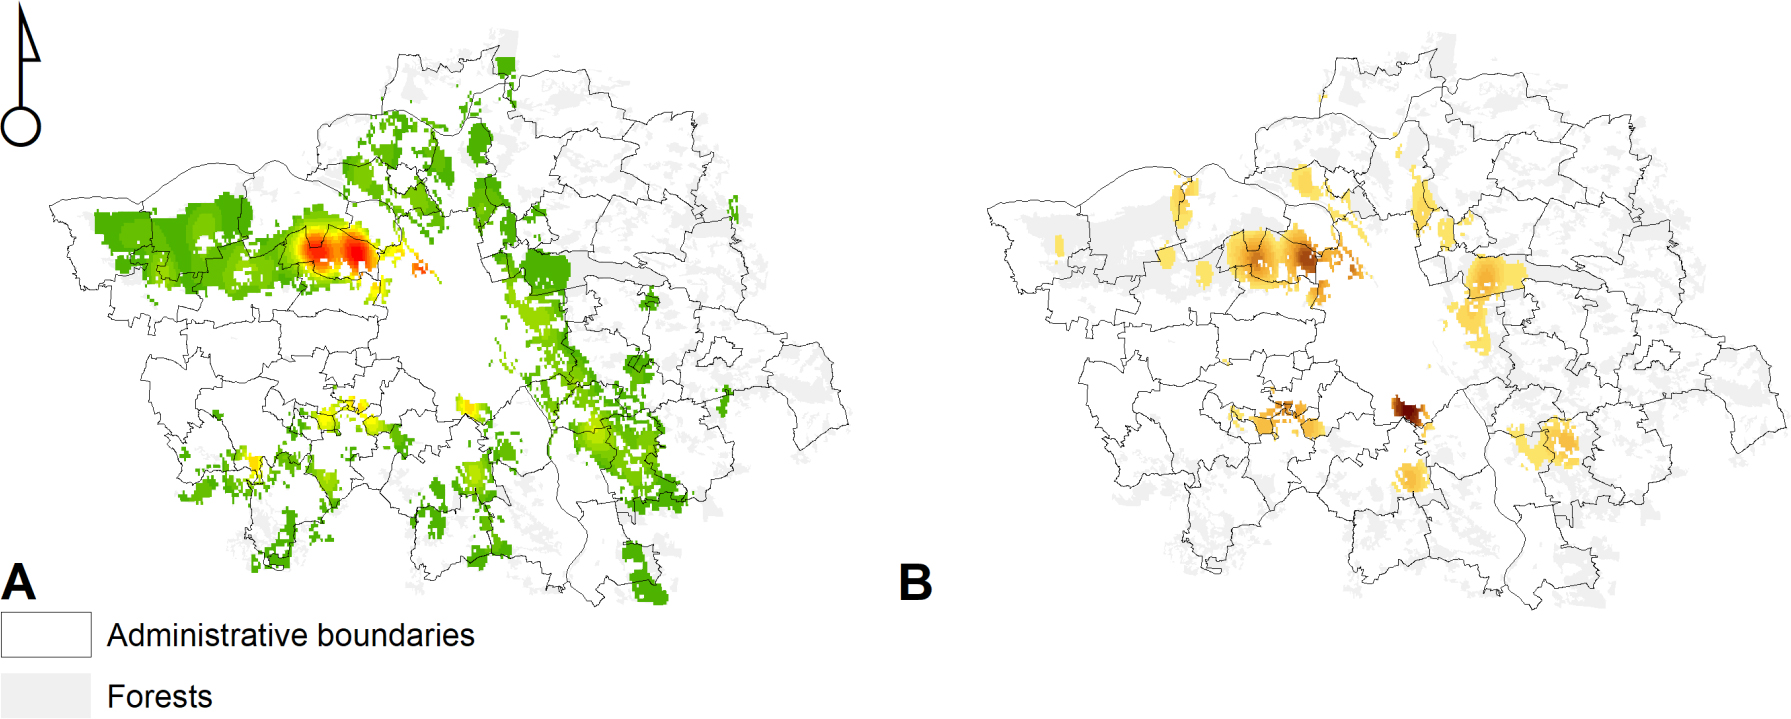
Figure 5.
Hotspots of urban and suburban forest recreation services (upper map) and disservices (lower map), using kernel density estimates for point features. Red color indicates hotspots, whereas point density gradually decreases from red to light green/yellow colors.
When analyzing individual ecosystem services, recreation was the most frequently mapped category (257 locations). This was followed by areas distinguished by landscape aesthetics (211 locations) and areas valued for health -related benefits (151 locations). Respondents relatively less often indicated places associated with environmental awareness (138 locations) or emotional attachment (124 locations). The least frequently mapped services were areas valued for social relations (114 locations) and cultural heritage (102 locations).
The spatial distribution of four selected ecosystem services is presented in Fig. 6. The analysis of the distribution of recreational sites indicated by respondents shows that the forest areas most frequently used for this purpose are the eastern part of Kampinos National Park, Kabacki Forest, and the forests of the Chojnów Forest District. A partial overlap is observed between hotspots of recreational activity and areas identified by respondents as places they tend to avoid. Hotspots of all analysed ecosystem services are concentrated in the eastern part of Kampinos National Park. Cultural services, such as health-related and social values, also exhibit distinct hotspots in Kabacki Forest. Depending on the type of service, areas of high value for the selected ecosystem services are also found in the Masovian Landscape Park and in the western part of the study area, within the Chojnów Forest District.
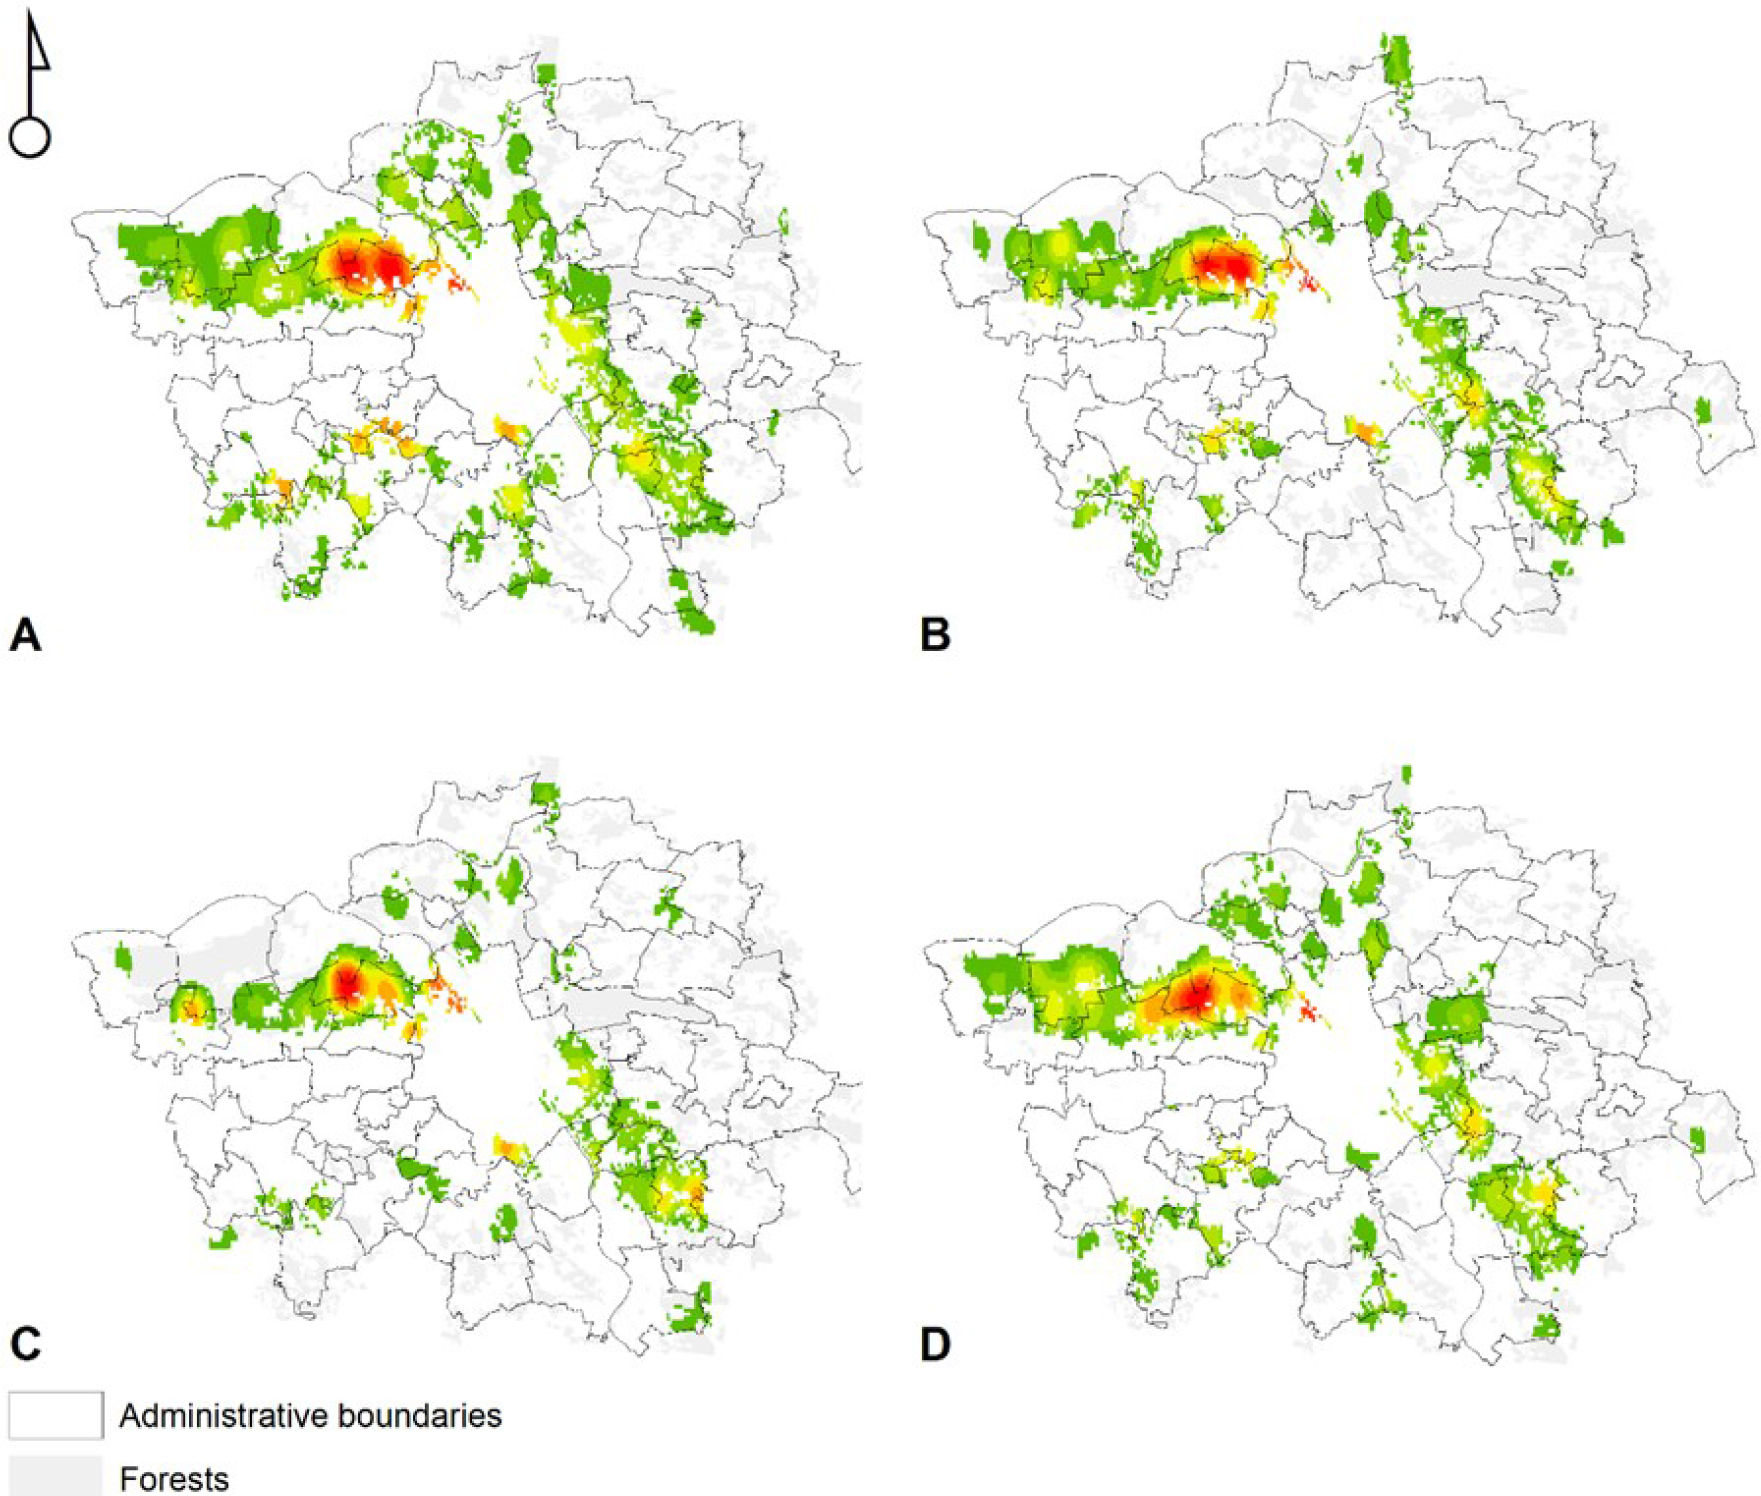
Figure 6.
Hotspots of urban and suburban cultural ecosystem services a) recreation, b) health, c) social, d) landscape, using kernel density estimates for point features. Red color indicates hotspots, whereas point density gradually decreases from red to light green colors.
Discussion
This online survey study conducted among residents of the metropolitan area enabled the identification of factors influencing the choice of recreational sites as well as factors determining the avoidance of specific areas. In addition, the importance of 24 ecosystem services for the studied community was assessed. An added value of the study was the application of the PPGIS module, which has so far been used very rarely in research conducted in Poland and, for the first time, was applied in the context of ecosystem services analysis.
Respondents identified peace and quiet as well as forest accessibility as the two most significant factors influencing the choice of forest areas for recreation and leisure. In survey studies concerning the Warsaw metropolitan area conducted by Korcz et al. (2024), distance from the place of residence to forest areas was one of the key factors affecting visit frequency. This phenomenon is related to the character of visits to urban and peri-urban forests, which tend to be associated with everyday recreation, requiring less time than trips to more distant destinations. In studies conducted in less urbanized areas, Sławski and Sławska (2009) demonstrated that respondents most often chose forests located within the municipality of their residence. Skłodowski et al. (2013) indicated that the average distance respondents in Poland declared as acceptable to travel in order to reach a forest was approximately 6.9 km. Peace and quiet are closely linked to the need for contact with nature and to the effects of forest recreation on stress reduction, improved concentration, and overall psychological restoration (Gołos, 2018). Consequently, when asked about factors discouraging them from visiting particular forests, respondents most frequently pointed to phenomena that disturb tranquility (e.g. noise) and reduce the sense of safety (acts of vandalism, the presence of stray dogs or dogs off-leash, as well as the risk of theft or assault). The results of the present study are consistent in this respect with earlier research, in which similar factors disrupting forest recreation were identified by Sławski and Sławska (2009), Gołos (2013), and Skłodowski et al. (2013). An advantage of the present study is the possibility of spatially visualizing the occurrence of these factors, which may constitute a useful tool for planning measures aimed at improving recreational comfort in forest areas.
Previous studies have typically focused on a relatively narrow range of ecosystem services. For example, in research conducted in the Warsaw metropolitan area, Ciesielski et al. (2024) identified the importance of seven ecosystem services, whereas Janeczko et al. (2023) indicated twelve services. In turn, Baumsteiner et al. (2020) identified the significance of eight cultural ecosystem services in three cities in Germany, while Hegetschweiler et al. (2022) assessed the importance of twenty-one ecosystem services among adults and adolescents in Switzerland. The present study adopts a more comprehensive approach, encompassing 24 ecosystem services. At the same time, it should be emphasized that some of these services are intuitive in nature, and for individuals encountering the ecosystem services concept for the first time, certain categories may be perceived as overlapping in scope. The analysis of the results indicates that respondents rated regulating services the highest, including the shaping of atmospheric quality and climate regulation, water resource protection, flood mitigation, and soil erosion control. Cultural services were also attributed comparable importance. Within the category of cultural services, particular value was assigned to those associated with the positive effects of contact with nature, especially in the context of stress reduction, improved health, and opportunities for both passive and active recreation in forest environments. These services are closely linked to individual lifestyles and the fulfillment of fundamental human needs.
The obtained results are consistent with findings from previous studies conducted in Poland and other European countries. This convergence is evident in studies examining the significance of forest functions (Tyrväinen 2001; Janusz and Piszczek 2008; Gołos 2013), in which respondents indicated that regulating and social functions were more important to them than productive functions. Similar conclusions were reported by Varela et al. (2017), who found that respondents considered protective functions (e.g. biodiversity conservation) and recreational opportunities to be more important than productive forest functions. Studies examining the importance of ecosystem services, including those by Hegetschweiler et al. (2022), Nastran et al. (2022), and Bruzzese et al. (2022), revealed a hierarchy of ecosystem services that closely corresponds to the pattern identified in the present study. However, the perceived importance of individual ecosystem services is not uniform and may vary depending on demographic characteristics such as gender, age, education, and place of residence (Hegetschweiler et al. 2022; Janeczko et al. 2023). Due to the non-representative sample in our study, we decided not to conduct analyses across different demographic groups.
Consequently, forest management planning at different governance levels should be grounded in a systematic recognition of the diverse expectations and needs of various stakeholder groups. Incorporating these social dimensions into planning frameworks can play a crucial role in advancing a more sustainable forestry paradigm, one that emphasizes multifunctionality and enhances the ability of forests to deliver a broad spectrum of ecosystem services (Aguilar et al. 2017).
A comparative analysis over a period of nearly a quarter of a century demonstrates that the hierarchy of the importance of forest functions, now increasingly conceptualized in terms of ecosystem services, has remained essentially stable. What has changed is the intensity of the assigned evaluations, as reflected, among others, in measurements using Likert scales (Janeczko et al. 2023). It may be assumed that this phenomenon results from a number of factors, including experiences related to the COVID-19 pandemic (Derks et al. 2020), broadly understood social transformations (e.g. shifts in value hierarchies and life priorities), as well as increasing environmental awareness and a better understanding of the role of forests in the context of contemporary challenges such as climate change and mental health (Korcz et al. 2024).
Among the limitations of the present study are the relatively small number of respondents and their nonrepresentative distribution (i.e. people with higher education constitute as much as 91.7% of the sample) (Ramirez Aranda et al. 2023). For this reason, the obtained results cannot be generalized to the entire population of residents of the Warsaw metropolitan area and should instead be treated as reflecting the opinions of the surveyed group only. This limitation is characteristic of many survey studies conducted online, particularly when respondents do not receive remuneration for participation. The lack of support from external research companies, which maintain their own respondent panels and are able to ensure participation in exchange for financial incentives, further hampers the achievement of sample representativeness. As a consequence, studies of this type may be subject to the risk of overrepresentation of certain groups (e.g. individuals who are more active online, possess higher digital competences, or show a particular interest in the study topic), while other social groups may be underrepresented (Brown 2017). The issue of digital accessibility and online presence among older individuals (over 55 years of age) was highlighted by Janeczko et al. (2023), who referred to CBOS research indicating that nearly half of people in this age group do not use the Internet.
Another aspect related to the use of online surveys is the significant difference between results obtained with this method and those derived from surveys conducted in the field. Taczanowska et al. (2023) pointed out that the dissemination of questionnaires via social media should be approached with caution due to the potential for uncontrolled attempts to influence respondents’ opinions, particularly in the case of complex management-related issues. Nevertheless, as demonstrated by the results of the present study, findings from online survey research may be consistent with those obtained using other methodological approaches (Gołos 2013b; Ciesielski et al. 2024).
In survey studies using PPGIS, maintaining representativeness in terms of respondents’ place of residence (e.g., municipality) is important to avoid biases resulting from uneven spatial distribution. In this study, a random sample of respondents was used. In the future, the proposed method could be applied not only in online surveys but also in face-to-face interviews and in teams preparing forest-related analyses. It may also be useful to include additional ecosystem services in the mapping process. However, mapping regulating and supporting services requires more advanced knowledge and a deeper understanding of ecological processes (Brown and Fagerholm 2015). Therefore, mapping these services is recommended to be carried out by experts, preferably working in small groups.
A relatively large proportion of respondents chose not to complete the questions containing the mapping component. This may have been due, on the one hand, to the length of the questionnaire and, on the other, to difficulties related to map navigation and interface usability, especially on mobile devices. This constitutes a typical challenge in PPGIS-based studies conducted without the support of a person assisting respondents during questionnaire completion. It should also be emphasized that this type of research is still conducted relatively rarely in Poland, which means that a substantial proportion of respondents may have had no prior experience with such tasks. In future studies, greater attention should be paid to providing clear and concise instructions for respondents regarding the completion of the questionnaire, as well as to highlighting common errors that may lead to survey interruption.
Among the unquestionable advantages of PPGIS is the possibility for respondents to precisely indicate locations they consider valuable in terms of ecosystem services, as well as areas that, due to a variety of factors, are less attractive to them and therefore avoided. Locating specific sites on a map helps to avoid vague descriptions of recreational areas, such as “a forest near Legionowo” (Gołos 2013b). Moreover, point data can be aggregated using appropriate methods into density maps, enabling the spatial representation of so-called hotspots. This is particularly important when forest managers, in planning forest management, must integrate multiple functions and services within the same area. It should be noted that the accuracy of the mapping may be influenced by respondents’ spatial orientation, their memory of locations, and their ability to use the interface.
In the context of the practical application of the PPGIS method in forestry, it is worth emphasizing that it serves not only to identify the spatial distribution of CES, but above all can constitute an important tool for public participation in planning processes, such as the preparation of forest management plans or other strategic documents related to forest land management. With appropriate legal provisions in place, the use of PPGIS in public consultations is feasible, as is already evident in Poland, for example in processes related to the preparation of spatial planning instruments. According to the Act on Spatial Planning and Development, one of the forms of public consultation may include surveys or geo-surveys (Ustawa, 2023). The incorporation of new forms of public consultation into forest management planning would strengthen the role of society in decision-making concerning forest spaces.
Conclusions
The present study presents a relatively new approach in Poland to investigating social preferences and expectations regarding recreation and leisure in forest areas, as well as to mapping areas valuable in terms of the cultural ecosystem services they provide. The article demonstrates the potential applications of the PPGIS method while also highlighting its strengths and limitations. It should be emphasized that the presented method can be used not only in scientific research but may also constitute an important element of public consultation processes. This is particularly relevant in the context of spatial management, local development planning, and forest management. In these fields, taking into account the opinions and needs of local communities is crucial for making decisions that are durable and widely socially acceptable. Globally, this type of approach is already widely applied, whereas in Poland it is only beginning to gain importance, both in academic research and in planning practice, for example in the preparation of revitalization plans, municipal development strategies, or local spatial development plans.
Acknowledgements
Funded by the National Science Centre, Poland under the OPUS call in the Weave programme (project No. 2021/43/I/HS4/01451). This research was funded in part by the Austrian Science Fund (FWF) (grant DOI 10.55776/I6083). GPT-5 (ChatGPT) was used for the linguistic proofreading of the article.