
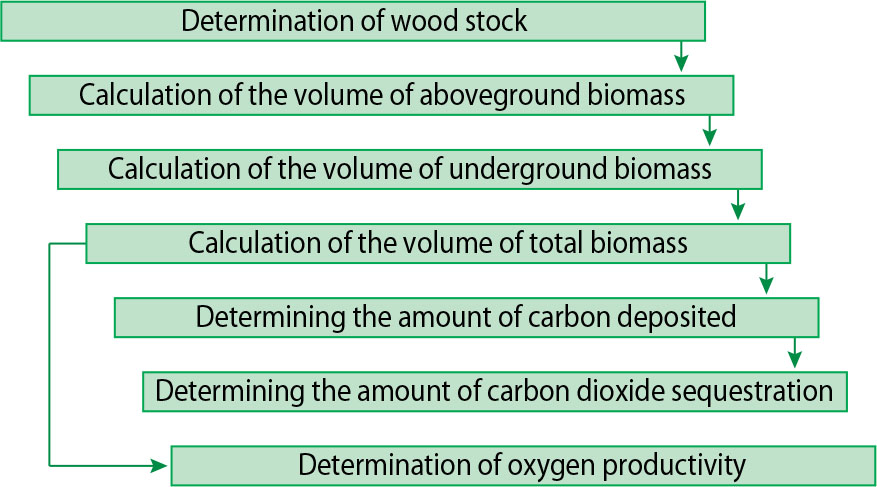
Figure 1.
Stages of assessing the carbon-sequestration potential and oxygen productivity of poplar cultivars (Hayda et al. 2024)
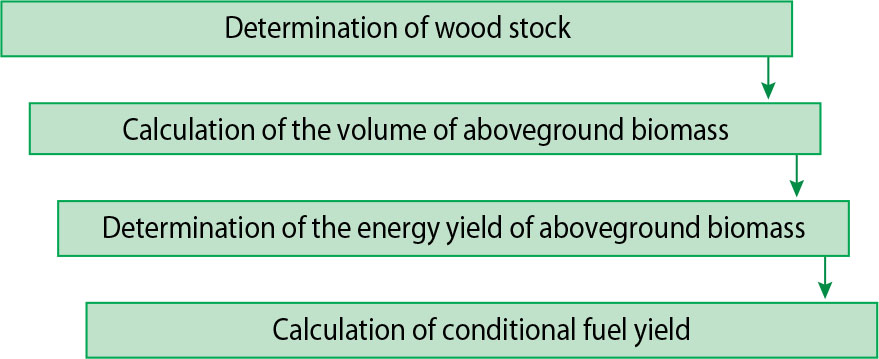
Figure 2.
Stages of assessment of bioenergetic productivity of poplar cultivars (Hayda et al. 2024)
Table 1.
Dynamics of growth and productivity of poplar cultivars
| Cultivars | Number of trees, pcs.·ha−1 | Survival, % | Height (Н), m | Diameter at breast height (DBH), cm | Wood stock, m3∙ha−1 | Annual stock change, m3∙ha−1∙year−1 |
|---|---|---|---|---|---|---|
| 7 years | ||||||
| ‘Strilopodibna’ | 5125 | 82 | 9.6±0.46 | 6.5±0.27 | 93 | 13.3 |
| ‘Druzhba’ | 5375 | 86 | 10.3±0.33 | 6.8±0.32 | 122 | 17.4 |
| ‘Canadian-Balsamic’ | 4875 | 78 | 9.8±0.36 | 7.4±0.33 | 113 | 16.1 |
| ‘Tronko’ | 5500 | 88 | 9.5±0.46 | 6.6±0.27 | 105 | 15.0 |
| 9 years | ||||||
| ‘Strilopodibna’ | 4875 | 78 | 11.3±0.27 | 7.7±0.30 | 117 | 13.0 |
| ‘Druzhba’ | 5000 | 80 | 11.8±0.21 | 8.1±0.31 | 139 | 15.4 |
| ‘Canadian-Balsamic’ | 3250 | 52 | 11.2±0.53 | 9.1±0.46 | 111 | 12.3 |
| ‘Tronko’ | 3750 | 60 | 11.3±0.34 | 8.2±0.33 | 102 | 11.3 |
| 15 years | ||||||
| ‘Strilopodibna’ | 3675 | 59 | 15.5±0.53 | 10.6±0.22 | 171 | 11.4 |
| ‘Druzhba’ | 2225 | 36 | 14.4±0.42 | 10.5±0.20 | 134 | 8.9 |
| ‘Canadian-Balsamic’ | 900 | 14 | 15.8±0.72 | 14.5±0.58 | 122 | 8.1 |
| ‘Tronko’ | 1300 | 21 | 15.7±0.49 | 11.9±0.26 | 111 | 7.4 |
Table 2.
Results of one-way ANOVA analysis of variance for the height and diameter of poplar cultivars
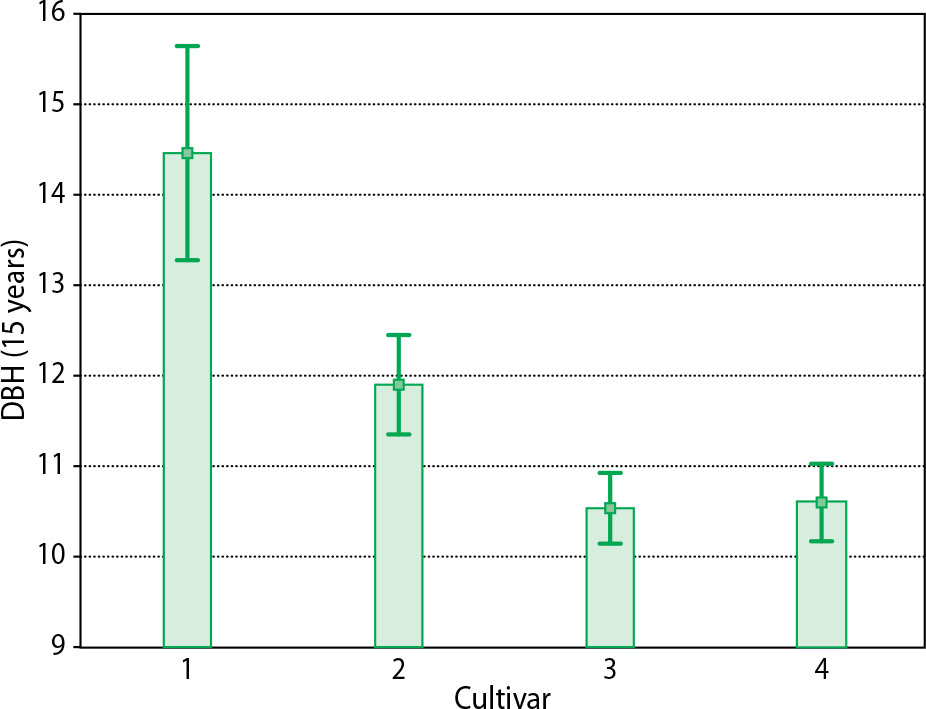
Figure 3.
Mean plot of poplar cultivars diameters at breast height and mean±0.95 CI (1,–‘Canadian-Balsamic’; 2,–‘Tronko’; 3,–‘Druzhba’; 4,–‘Strilopodibna’)
Table 3.
Results of pairwise comparisons of the poplar cultivars average diameter at breast height (Fisher LSD test)
| Cultivar | ‘Canadian-Balsamic’ | ‘Tronko’ | ‘Druzhba’ | ‘Strilopodibna’ |
|---|---|---|---|---|
| ‘Canadian-Balsamic’ | <0.0001 | <0.0001 | <0.0001 | |
| ‘Tronko’ | <0.0001 | 0.0020 | 0.0015 | |
| ‘Druzhba’ | <0.0001 | 0.0020 | 0.8482 | |
| ‘Strilopodibna’ | <0.0001 | 0.0015 | 0.8482 |
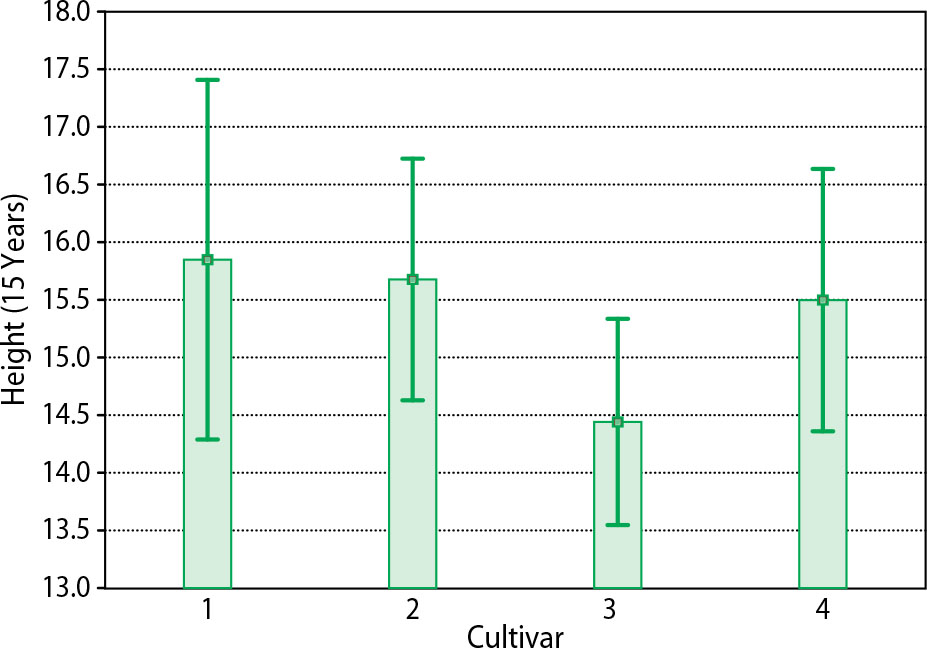
Figure 4.
Mean plot of poplar cultivars heights and mean±0.95 CI (1,–‘Canadian-Balsamic’; 2,–‘Tronko’; 3,–‘Druzhba’; 4,–‘Strilopodibna’)
Table 4.
Results of pair-wise comparisons of the poplar cultivars average height (Fisher LSD test)
| Cultivar | ‘Canadian-Balsamic’ | ‘Tronko’ | ‘Druzhba’ | ‘Strilopodibna’ |
|---|---|---|---|---|
| ‘Canadian-Balsamic’ | 0.8262 | 0.0758 | 0.6539 | |
| ‘Tronko’ | 0.8262 | 0.1115 | 0.8157 | |
| ‘Druzhba’ | 0.0758 | 0.1115 | 0.1722 | |
| ‘Strilopodibna’ | 0.6539 | 0.8157 | 0.1722 |
Table 5.
Dynamics of carbon and CO2-sequestration capacity of poplar cultivars
| Age | Traits | Cultivars | |||
|---|---|---|---|---|---|
| ‘Strilopodibna’ | ‘Druzhba’ | ‘Canadian-Balsamic’ | ‘Tronko’ | ||
| 7 years | stock of stemwood, m3·ha−1 | 93 | 122 | 113 | 105 |
| total biomass, t·ha−1 | 70.1 | 91.9 | 85.1 | 79.1 | |
| sequestered carbon, t·ha−1 | 35.0 | 46.0 | 42.6 | 39.6 | |
| CO2 sequestration, t·ha−1 | 128.5 | 168.5 | 156.1 | 145.0 | |
| annual CO2 sequestration, t·ha−1 | 18.4 | 24.1 | 22.3 | 20.7 | |
| 9 years | stock of stemwood, m3·ha−1 | 117 | 139 | 111 | 102 |
| total biomass, t·ha−1 | 88.2 | 104.7 | 83.6 | 76.9 | |
| sequestered carbon, t·ha−1 | 44.1 | 52.4 | 41.8 | 38.4 | |
| CO2 sequestration, t·ha−1 | 161.6 | 192.0 | 153.3 | 140.9 | |
| annual CO2 sequestration, t·ha−1 | 18.0 | 21.3 | 17.0 | 15.7 | |
| current change in CO2 sequestration, t·ha−1 | 16.6 | 11.7 | –1.4 | –2.1 | |
| 15 years | stock of stemwood, m3·ha−1 | 171 | 134 | 122 | 111 |
| total biomass, t·ha−1 | 128.8 | 101.0 | 91.9 | 83.6 | |
| sequestered carbon, t·ha−1 | 64.4 | 50.5 | 46.0 | 41.8 | |
| CO2 sequestration, t·ha−1 | 236.2 | 185.1 | 168.5 | 153.3 | |
| annual CO2 sequestration, t·ha−1 | 15.7 | 12.3 | 11.2 | 10.2 | |
| current change in CO2 sequestration, t·ha−1 | 12.4 | –1.2 | 2.5 | 2.1 | |
Table 6.
Dynamics of oxygen productivity of poplar cultivars
| Age | Traits | Cultivars | |||
|---|---|---|---|---|---|
| ‘Strilopodibna’ | ‘Druzhba’ | ‘Canadian-Balsamic’ | ‘Tronko’ | ||
| 7 years | total biomass, t·ha−1 | 70.1 | 91.9 | 85.1 | 79.1 |
| oxygen productivity, t·ha−1 | 84.1 | 110.3 | 102.1 | 94.9 | |
| annual oxygen productivity, t·ha−1 | 12.0 | 15.8 | 14.6 | 13.6 | |
| 9 years | total biomass, t·ha−1 | 88.2 | 104.7 | 83.6 | 76.9 |
| oxygen productivity, t·ha−1 | 105.8 | 125.6 | 100.3 | 92.3 | |
| annual oxygen productivity, t·ha−1 | 11.8 | 14.0 | 11.1 | 10.3 | |
| current change in oxygen productivity, t·ha−1 | 10.9 | 7.7 | –0.9 | –1.3 | |
| 15 years | total biomass, t·ha−1 | 128.8 | 101.0 | 91.9 | 83.6 |
| oxygen productivity, t·ha−1 | 154.6 | 121.2 | 110.3 | 100.3 | |
| annual oxygen productivity, t·ha−1 | 10.3 | 8.1 | 7.4 | 6.7 | |
| current change in oxygen productivity, t·ha−1 | 8.1 | –0.7 | 1.7 | 1.3 | |
Table 7.
Dynamics of total, average, and current bioenergetic productivity of poplar cultivars
| Age | Traits | Poplar cultivars | |||
|---|---|---|---|---|---|
| ‘Strilopodibna’ | ‘Druzhba’ | ‘Canadian-Balsamic’ | ‘Tronko’ | ||
| 7 years | stock of stemwood, m3·ha−1 | 93 | 122 | 113 | 105 |
| aboveground biomass, t·ha−1 | 56.1 | 73.5 | 68.1 | 63.3 | |
| energy yield, GJ·ha−1 | 1038.8 | 1362.7 | 1262.2 | 1172.8 | |
| yield of standard fuel, t·ha−1 | 35.4 | 46.5 | 43.0 | 40.0 | |
| annual energy yield, GJ·ha−1 | 148.4 | 194.7 | 180.3 | 167.5 | |
| 9 years | stock of stemwood, m3·ha−1 | 117 | 139 | 111 | 102 |
| aboveground biomass, t·ha−1 | 70.5 | 83.8 | 66.9 | 61.5 | |
| energy yield, GJ·ha−1 | 1306.9 | 1552.6 | 1239.9 | 1139.3 | |
| yield of standard fuel, t·ha−1 | 44.6 | 52.9 | 42.3 | 38.8 | |
| annual energy yield, GJ·ha−1 | 145.2 | 172.5 | 137.8 | 126.6 | |
| current change in energy yield, GJ·ha−1 | 134.0 | 94.9 | −11.2 | −16.8 | |
| 15 years | stock of stemwood, m3·ha−1 | 171 | 134 | 122 | 111 |
| aboveground biomass, t·ha−1 | 103.1 | 80.8 | 73.5 | 66.9 | |
| energy yield, GJ·ha−1 | 1910.1 | 1496.8 | 1362.7 | 1239.9 | |
| yield of standard fuel, t·ha−1 | 65.1 | 51.0 | 46.5 | 42.3 | |
| annual energy yield, GJ·ha−1 | 127.3 | 99.8 | 90.8 | 82.7 | |
| current change in energy yield, GJ·ha−1 | 100.5 | −9.3 | 20.5 | 16.8 | |