
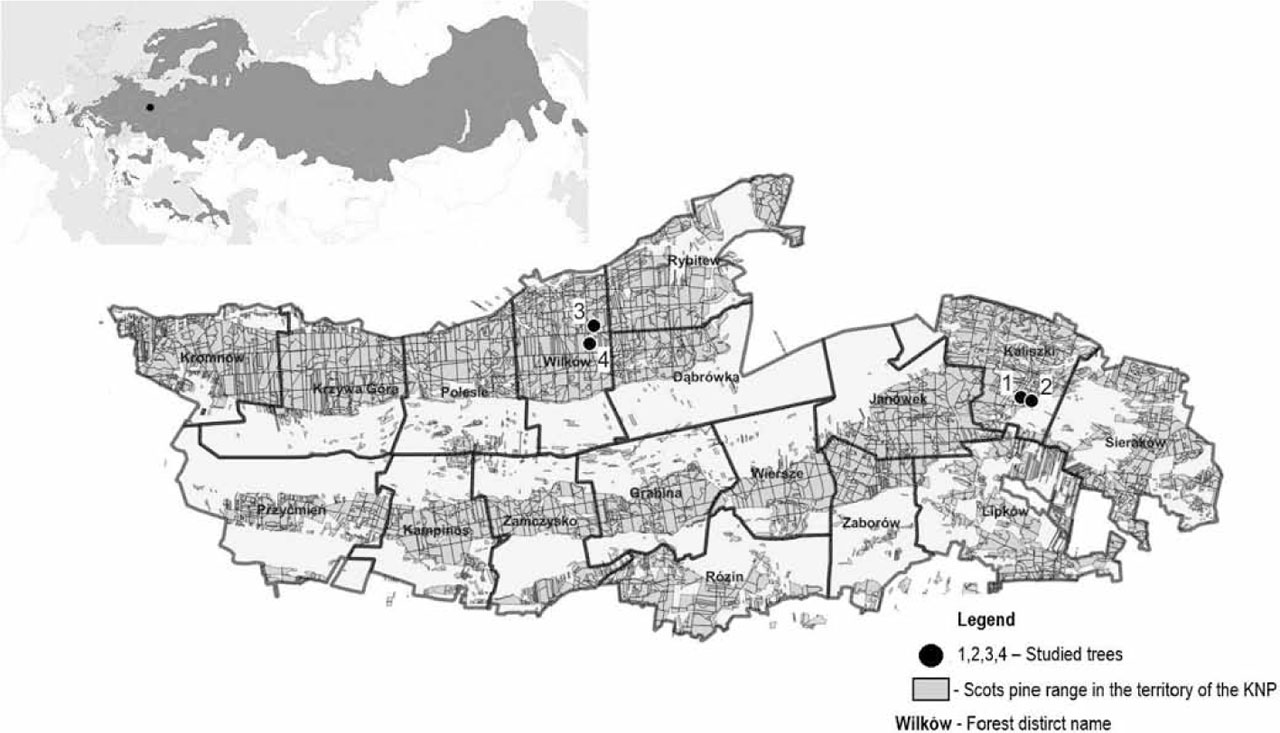
Figure 1.
Distribution range of Scots pine in the world (internal map – Caudullo et al. 2017) and in Kampinos National Park
Table 1.
Dendrometric data and defoliation results of the studied trees during the research period, and location of the analysed trees in Kampinos National Park
| Designation of the examined tree | 1 | 2 | 3 | 4 | |
|---|---|---|---|---|---|
| Height | 22.5 | 25.5 | 34.5 | 32 | |
| Diameter at breast height (DBH) [cm] | 60.5 | 45.9 | 81.5 | 62.7 | |
| Defoliation (%) | 2019 | 30 | 30 | 50 | 40 |
| 2022 | 40 | 30 | 70 | 40 | |
| Average number of grades of needles in 2019–2022 | 2 | 2–2.5 | 1 | 2–2.5 | |
| Geographical coordinates (WGS84) | north | 52.336661 | 52.335374 | 52.363492 | 52.357919 |
| east | 20.773351 | 20.778967 | 20.544093 | 50.541685 | |
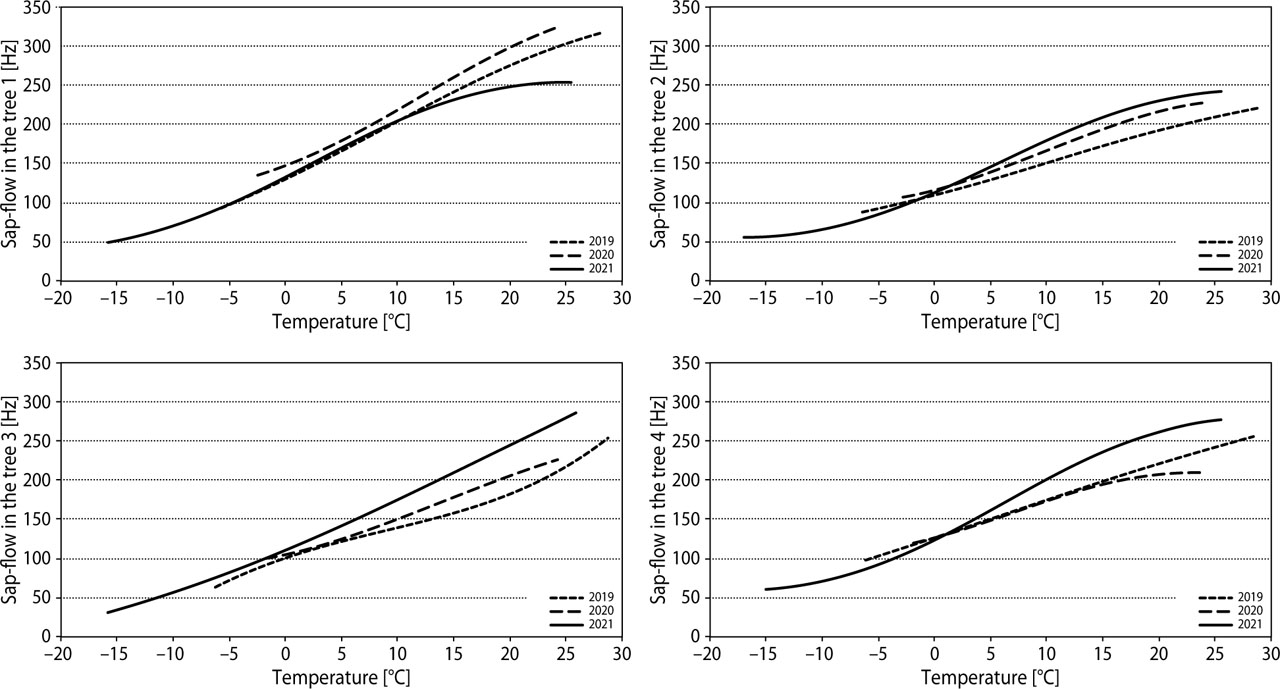
Figure 2.
Estimated sap flow regression functions depending on the temperature in the studied trees in the years 2019–2021 according to model 1
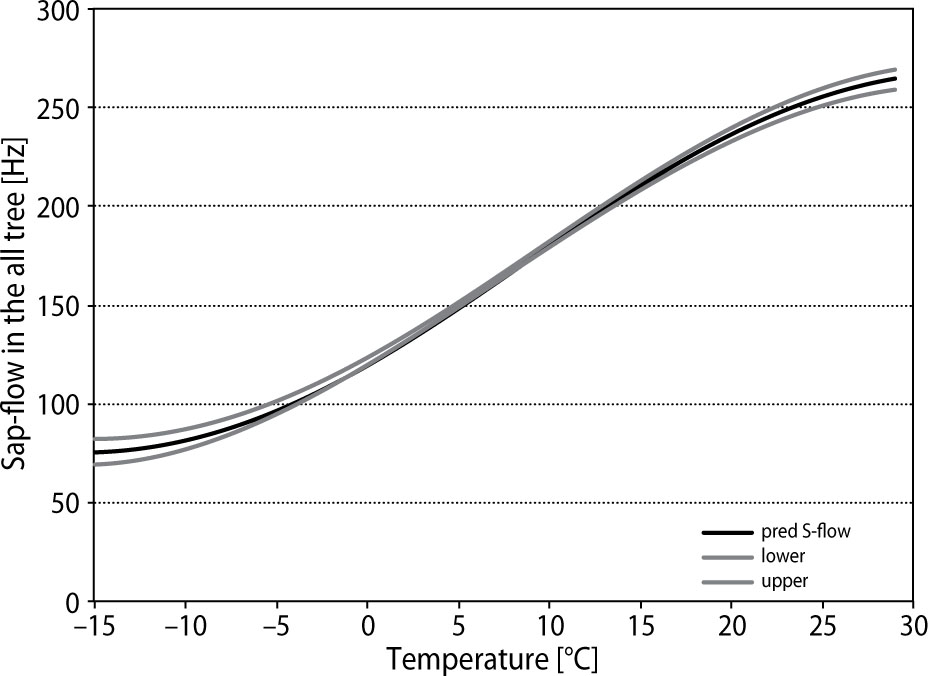
Figure 3.
General sap flow in the pine trunk for four analysed trees in the Kampinos National Park in the years 2019–2021, according to model 1, taking into account dispersion of the analysed data. The confidence intervals are marked in the graph with the lower and upper lines
Table 2.
Characteristics of the sap flow dynamics for the minimum and maximum temperatures for the examined trees in particular years
| No. tree | Year | Tmin (CF/1°C) CF | Tmax (CF/1°C) CF | CF/1°C max (T) CF | Rccc |
|---|---|---|---|---|---|
| Tree 1 | 2019 | −5.80 (5.80) 93.54 | 28.46 (3.97) 319.69 | 7.53 (8.28) 191.55 | 0.963 |
| 2020 | −2.48 (3.68) 136.13 | 24.49 (5.44) 326.99 | 8.38 (12.57) 238.77 | 0.964 | |
| 2021 | −15.79 (2.42) 48.91 | 25.46 (0.00) 254.14 | 7.07 (2.33) 160.33 | 0.956 | |
| Tree 2 | 2019 | −6.43 (2.27) 88.81 | 28.84 (2.03) 219.40 | 4.48 (10.75) 153.13 | 0.911 |
| 2020 | −2.72 (2.60) 106.99 | 24.47 (1.85) 230.23 | 5.70 (10.14) 166.97 | 0.892 | |
| 2021 | −16.97 (0.00) 55.31 | 25.55 (0.74) 241.98 | 6.50 (5.22) 179.83 | 0.903 | |
| Tree 3 | 2019 | −6.34 (7.66) 64.59 | 28.72 (11.09) 252.29 | 8.69 (3.22) 135.27 | 0.672 |
| 2020 | −1.88 (2.34) 100.90 | 24.10 (4.66) 225.67 | 5.63 (14.96) 177.20 | 0.775 | |
| 2021 | −15.93 (5.37) 30.58 | 25.81 (4.77) 285.62 | 5.58 (18.72) 236.75 | 0.898 | |
| Tree 4 | 2019 | −6.30 (4.44) 97.59 | 28.63 (4.37) 257.79 | 4.68 (10.03) 172.70 | 0.900 |
| 2020 | −1.80 (3.75) 120.01 | 24.02 (0.00) 209.47 | 4.89 (6.20) 156.08 | 0.852 | |
| 2021 | −15.05 (0.62) 60.15 | 25.53 (1.24) 276.82 | 7.55 (5.72) 168.93 | 0.890 | |
| All | All | −16.09 (0.00) 75.37 | 31.81 (0.00) 266.69 | 6.12 (8.36) 171.03 | 0.913 |
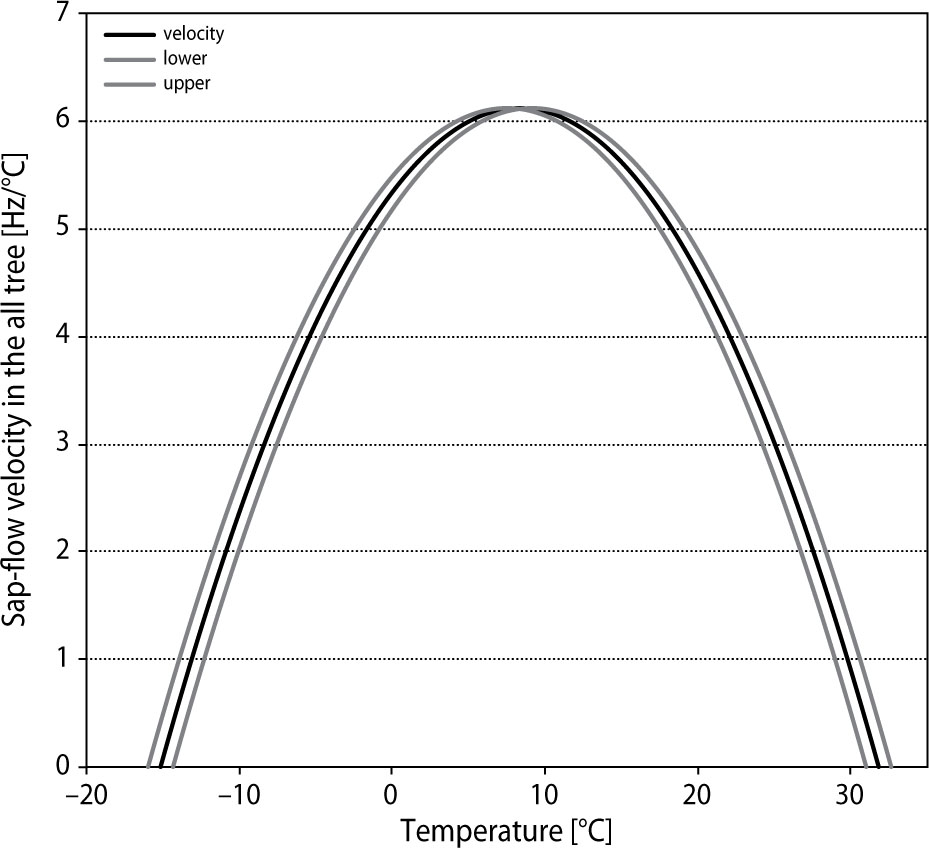
Figure 4.
Dynamic function of sap flow in a pine trunk for four analysed trees in the Kampinos National Park depending on the temperature
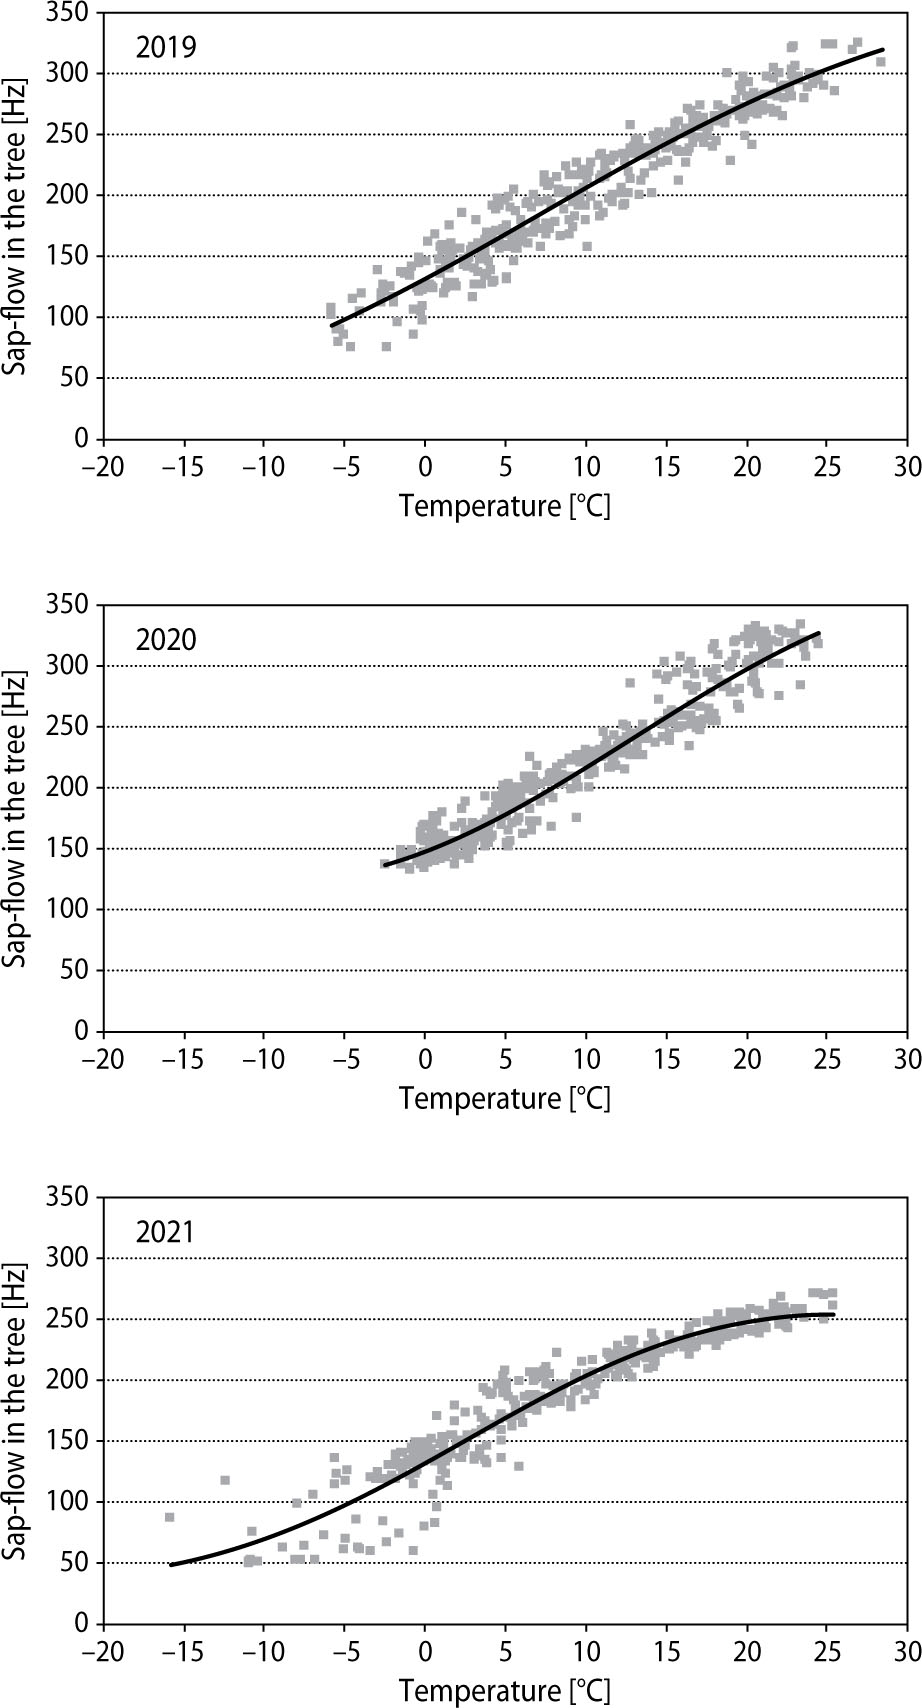
Sap flow in tree no. 1 in 2019–2021
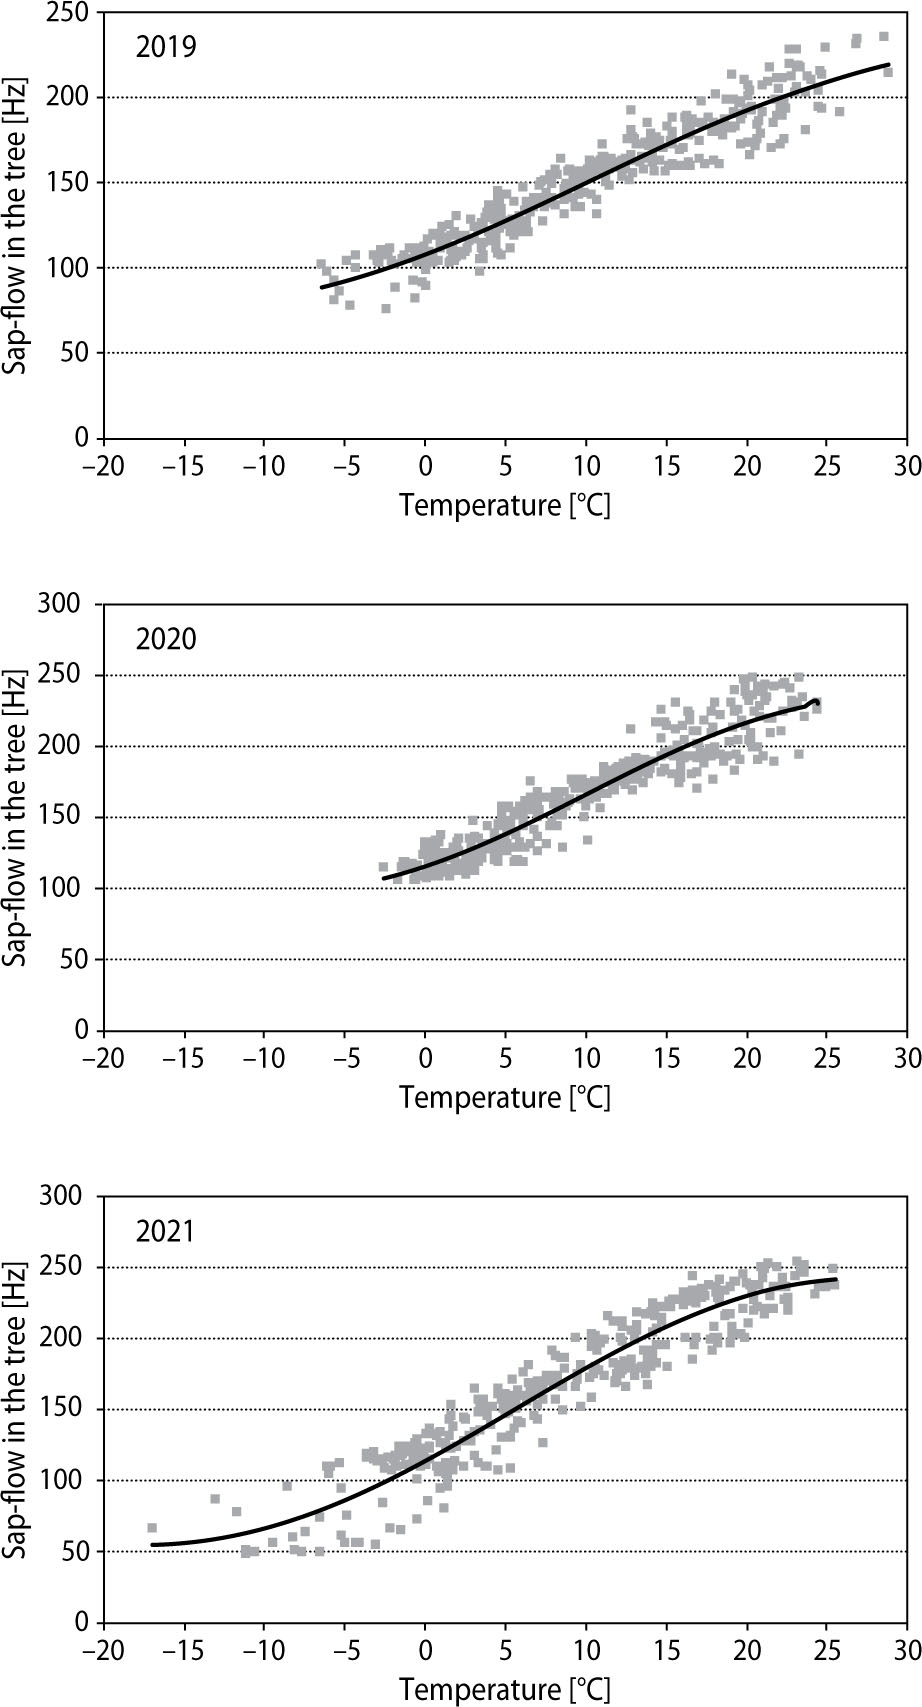
Sap flow in tree no. 2 in 2019–2021
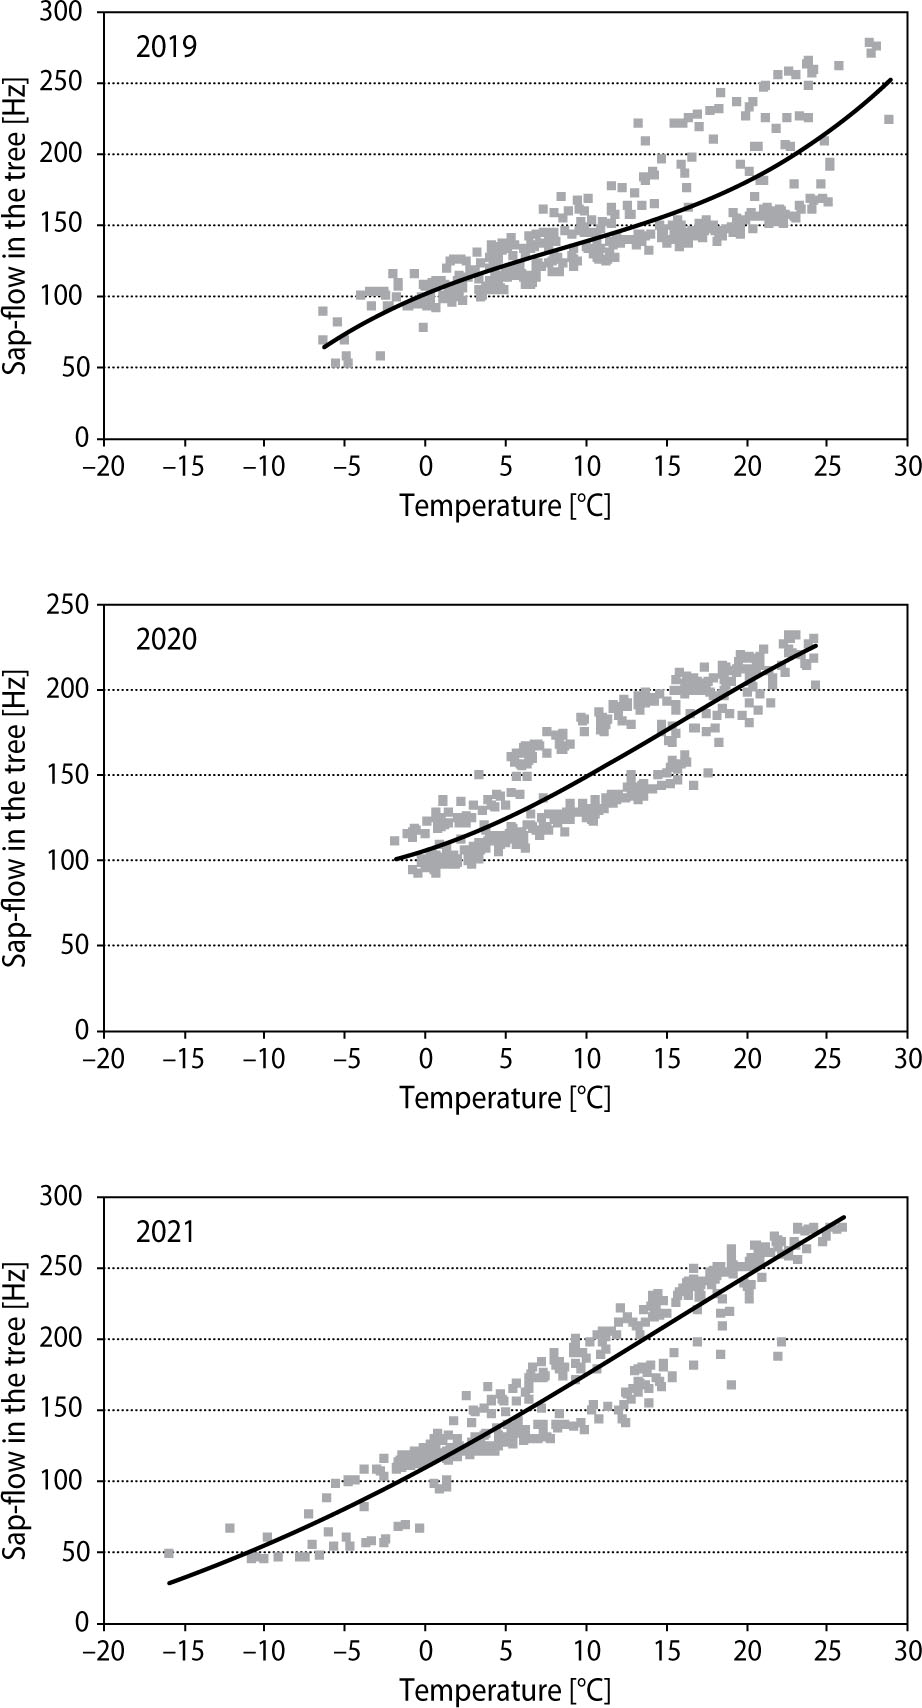
Sap flow in tree no. 3 in 2019–2021
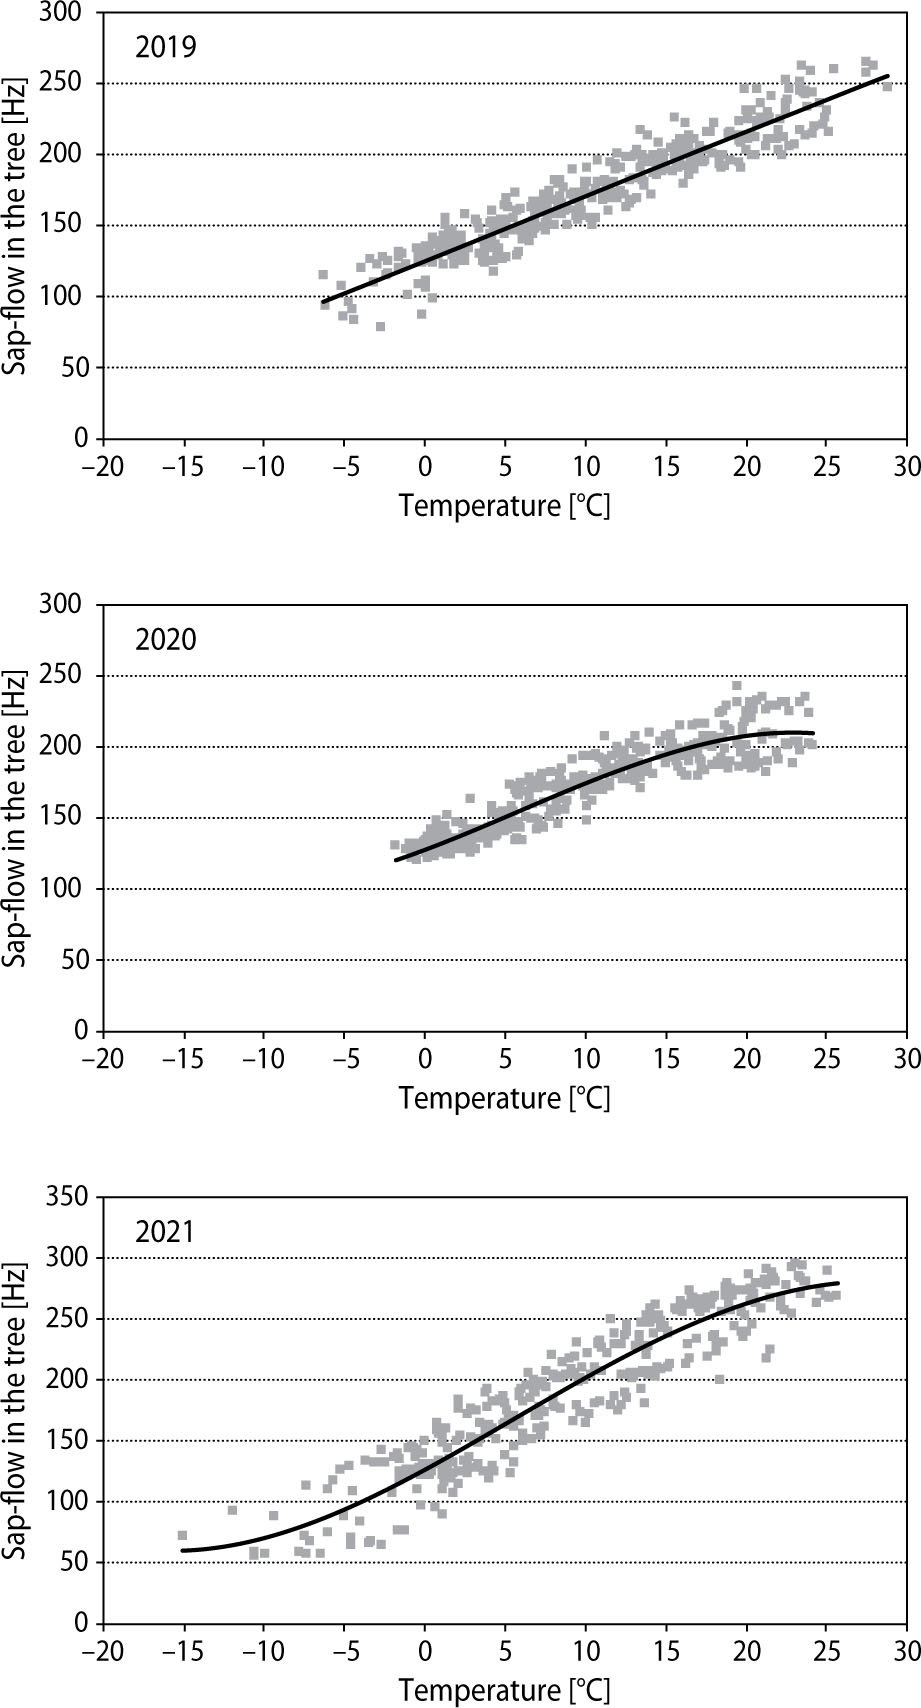
Sap flow in tree no. 4 in 2019–2021