Scots pine (Pinus sylvestris L.) has a wide distribution across the whole Eurasian continent, ranging in latitude from 37°N to 70°20′N (Mátyás 2004). It is also an important species in economic terms, which has been the subject of numerous studies on its breeding and ecological importance for decades (Kowalczyk 2013; Krakau UK et al. 2013; Koivula et al. 2020; Czacharowski and Drozdowski 2021; Przybylski et al. 2022), and also has its place in social and cultural terms. In Poland, Scots pine occupies 58.6% of the forest area of all ownership types, 60.8% of the area in the State Forest National Forest Holding and 55.3% in private forests (Zajączkowski et al. 2022). So far, research on pines has focused, among other things, on identifying optimal breeding conditions for the following factors: frost sensitivity (Nilsson and Andersson 1987), growth characteristics (Haapanen et al. 1997), disease resistance (Martinsson 1987) and selection traits favouring the achievement of quality planting material (Chmura et al. 2021). The development of technology in the recent past has allowed an even more detailed understanding of the physiological responses of trees to environmental changes. Dynamic wood analyses make it possible to evaluate the types of incremental responses in response to external stressors (Klisz et al. 2023). The possibility of using modern measurement sensors allows to obtain information on the variations of sap flow in the trunk of a tree, which is a response to the physiological reactions of the plant. The article deals with the question of sap flow in Scots pine trunks as a function of changes in air temperature. The research was carried out in a stand in the old-growth phase in a strict protection area.
The flow of water and assimilates in plants is a necessary phenomenon that enables the smooth functioning of the plant. Water plays a major role in almost all aspects of plant life, including cell differentiation (Hejnowicz 2002). In metabolically active tissues, it can make up 70%–95% of their weight, it is a solvent for biologically active substances and is involved in many chemical reactions. In addition, it maintains the turgor of cells and the whole plant, allows the plant to grow and allows the temperature to be lowered by transpiration. The polar properties of the water molecule cause phenomena such as cohesion, adhesion and surface tension, which are responsible for the movement of water in the capillary tubes and in the cell walls of plants (Kacperska 2005a). Assimilates are organic substances that are formed in the process of photosynthesis. They are formed in the main photosynthetic organs (leaves, needles) of the so-called donors and are used or stored in organs that have a need for these substances, the so-called acceptors (tissues and organs) that do not perform photosynthesis (e.g. roots, flowers, fruits, tubers, stems). Transport between organs, especially in trees, is long and takes place, for example, through the phloem, where sucrose, which has no reducing properties, is transported (chemically neutral compound – does not undergo chemical reactions during transport) (Krzywański and Wójcik-Wojtkowiak 2002).
Disturbances related to sap flow in the stem can lead to physiological processes not working properly, weakening the plant’s resistance over a long period of time and increasing its susceptibility to unfavourable abiotic and biotic factors (Andreieva and Goychuk 2020; Gawęda and Grodzki 2020), which in turn can lead to the death of the individual. Droughts, which occur systematically as a result of climate change, are one of the main reasons why pine (Poland’s most important forest tree species) is categorised as a ‘loser’ (Dyderski et al. 2018). The aspect of understanding the plant’s response to systematic stress factors, including drought and temperature extremes, is therefore particularly important. The real-time sap flow measurement proposed in this article is a new method to learn more about the physiological response of trees. The method was developed by a team of scientists from the Faculty of Forestry in Poznań (Rutkowski et al. 2020a).
Scots pine studies mainly focus on production stands (Banach et al. 2021; Jakubowski et al. 2020). Few studies have been conducted on stands classified as old-growth forests (over 100 years old). The reason for the lack of research on old trees is their limited number. Pine, as the most important economic tree species in Poland, is cut down in the mature phase of the stands, when the technical value of the wood is highest. In Poland, the oldest pine stands have been preserved mainly in nature reserves and national parks. One of these places is the Kampinos National Park (KNP), where over 100-year-old tree stands cover an area of around 6,000 ha (Tyburski 2015), which accounts for 21% of the national park’s forest area. The oldest pine stands were, for example, the subject of the research project ‘Genetic characterization of stands with Scots pine (Pinus sylvestris) in the Kampinos National Park’ (Przybylski et al. 2021; Konatowska et al. 2021). The project included activities aimed at determining the genetic distance between the studied stands and assessing the condition of the tree crowns intended for research. The uniqueness of the stands and the multidisciplinary nature of the observations made formed the basis for the use of an innovative technique to measure sap flow in the subcortical region. This was a pioneering work that had not been done before in old stands in Poland. The use of sensors described in the methodology, which had not been used in pine research before, is innovative. This type of construction of a measuring device was first used in the pilot studies described by Rutkowski et al. (2019) and Rutkowski et al. (2020a).
The main objective of the study was to determine the changes in sap flow in the pine trunk in correlation with the temperature fluctuations measured under the canopy of the stand. Based on this main objective, specific targets were formulated for the analysis of sap flow in correlation with temperature in minimum and maximum values.
The presented analysis describes in detail the temperature values at which the pine reaches the maximum flow values, taking into account the mechanisms protecting the species from stress associated with high temperatures. However, it characterises the smooth transition of the pine into winter dormancy and analyses the dynamics of the process.
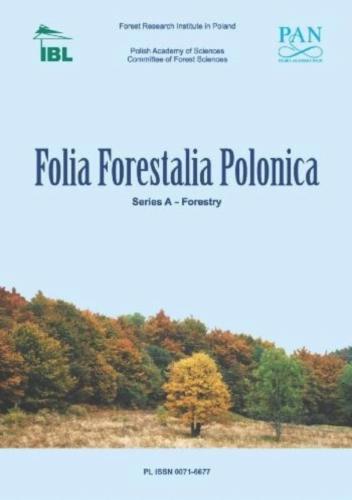
KNP is the second largest national park in Poland. It is located near Warsaw, the biggest Polish city. The highly urbanised area is located in the east and southeast of the park. In 2000, KNP was included in the UNESCO list of world biosphere reserves. Among its many natural values, the most preserved, at the European scale, complex of inland dunes deserves special attention (Rutkowski et al. 2020b). The study was conducted in KNP, a location dominated by Scots pine stands in the upper layer, which are located in four strictly protected areas and are excluded from forest management (Przybylski et al. 2021). The characteristics of the study locations are presented in Figure 1 and Table 1. The research was carried out in stands in the old-growth phase, in the plant community, Querco roboris-Pinetum. The examined trees are located in a stand which, according to the Forest Management Plan for KNP, had an average age of 190–195 years (Przybylski et al. 2021).

Distribution range of Scots pine in the world (internal map – Caudullo et al. 2017) and in Kampinos National Park
Dendrometric data and defoliation results of the studied trees during the research period, and location of the analysed trees in Kampinos National Park
| Designation of the examined tree | 1 | 2 | 3 | 4 | |
|---|---|---|---|---|---|
| Height | 22.5 | 25.5 | 34.5 | 32 | |
| Diameter at breast height (DBH) [cm] | 60.5 | 45.9 | 81.5 | 62.7 | |
| Defoliation (%) | 2019 | 30 | 30 | 50 | 40 |
| 2022 | 40 | 30 | 70 | 40 | |
| Average number of grades of needles in 2019–2022 | 2 | 2–2.5 | 1 | 2–2.5 | |
| Geographical coordinates (WGS84) | north | 52.336661 | 52.335374 | 52.363492 | 52.357919 |
| east | 20.773351 | 20.778967 | 20.544093 | 50.541685 | |
Dendrometric measurements were conducted to determine tree height and diameter at breast height. The height was measured with a Suunto optical altimeter, while the diameter was assessed using a manual caliper. Defoliation was estimated using a method commonly applied in Poland for assessing crown health (Lech et al. 2023) (Tab. 1). The methodology is detailed in the article by Przybylski et al. (2021).
Four trees from the dominant canopy layer were selected for the study. In 2018, the devices were attached to each tree at a height of 2 m above the ground. The measurements began in 2019, when the measured values stabilised. The fluctuations in the measured values are due to a natural mechanism that occurs in pine trees and are related to the flooding of the measuring diodes with resin. The device used in the study is a compact data logger that comprehensively monitors microhabitat factors such as temperature, relative humidity and light intensity. The sensor is also equipped with an innovative system for measuring the physiological activity of trees, which analyses the electrical properties of their living tissue based on electrical conductivity. The device records the changes in a tree’s electrical conductivity between the probes placed in its trunk. The control processor activates a generator at each specified time interval, which sends a current pulse with changing properties to the probes (to avoid electrolysis). Depending on the conductivity of the system (probe–tissue–tree–probe), a signal with a unique frequency measuring the conductivity of the tree is returned to the microcontroller.
Due to the constant transport and movement of the sap flow in the tree, the dielectric properties of the system (probe–wood–probe) depend on the amount of sap flow in the pores (vessels) of the wood. The micro-controller uses a generator to send a small electrical alternating field pulse to the device probes every hour. The variability of the current flowing, which reflects the activity of the trees and is expressed in Hertz, influences the frequency of the generator. Since cell chemistry and transpiration rate vary over a 24-h period and also annually, this measurement indicates the activity of the tree at a given time. When the activity decreases, the measurement drops to a minimum of 50 Hz as recorded by the device (equivalent to about 20 pF), indicating a lack of conductivity and the cessation of the processes responsible for the transport and active changes in the chemical composition of the sap. The device also records the microclimatic parameters such as air temperature and relative humidity (Rutkowski et al. 2020a). Sap flow in the subcortical region was measured in this study at a depth of 3 cm towards the inside of the stem. The measurement was made once an hour. Measurements were carried out for three calendar years (2019–2021).
A structural model was used, which can be expressed as
– the sap flow in the trunk for ith tree in the year (i = 1, 2, …, 12), – the regression coefficients, – the subject (tree in the year)-specific random effects assumed to be iid N(0, ψ) and ϵij͠∼N(0, σ2), –the temperature measured under the tree canopy in the jth year (j = 1, 2, …, 365 – except 2020; –ended on 366).
Maximum likelihood estimates of the model parameters can be obtained using SAS procedure NLMIXED SAS/STAT® v. 14.3 (SAS Institute Inc. 2017). The SAS macro %GOF (standard goodness-of-fit) was used to identify alternative measures of R2 fit useful for assessing model fit (Vonesh et al. 1996; Vonesh and Chinchilli 1997). The paper provides values for the conditional adjusted concordance correlation of fit, denoted as Rccc.
The statistical methodology used made it possible to estimate the derivative of the regression function of sap flow in the trunk; the dynamics of sap flow were determined and used in the results and conclusions.
During the research period (2019–2021), detailed data on sap flow in the trunk and atmospheric temperature in the stand at 2 m height were collected for four selected trees (Appendix). For each parameter, 8760 measurements were carried out on a single tree over the course of the year. A total of 52,560 results were obtained for a tree during the research period (3 years) for two measured parameters (air temperature, sap flow) (Appendix). The graphs presented show the estimated regression functions of the third-degree polynomial according to model 1. For better readability, Figure 2 shows a summary of the estimated regression functions for each tree, which allows an analysis of the changes in the individual trees during the research period. In the analysis carried out for all trees, it was found that sap flow dynamics in the pine trunk is an individual characteristic. The flow dynamics analysed for the tree studied showed variability between years due to changing temperatures between the daily periods studied.

Estimated sap flow regression functions depending on the temperature in the studied trees in the years 2019–2021 according to model 1
The sap flow in pine trunks occurred in a wide range of temperature amplitudes (Fig. 3). At positive temperatures, the flow occurred regardless of the duration of the high temperatures. At the lowest negative temperatures, the flow was recorded only during short-term temperature drops. With a systematic drop in temperature and the process of wood hardening to low temperatures, the flow at temperatures below −5°C approached zero and physiological processes were inhibited. The visible increase in the scatter of the data results from the fact that the number of measurements at minimum and maximum temperatures was lower than the number of measurements at temperatures in the 0–15°C range.

General sap flow in the pine trunk for four analysed trees in the Kampinos National Park in the years 2019–2021, according to model 1, taking into account dispersion of the analysed data. The confidence intervals are marked in the graph with the lower and upper lines
Table 2 shows the flow dynamics for all trees. Flows at minimum and maximum temperatures recorded in the individual years and the maximum flow dynamics were taken into account. The third-degree polynomial was adjusted for the value Adj. The Rccc of the individual trees ranged from 0.672 to 0.964. The summary part of the table shows that at temperatures below −16.09°C, no changes in flow dynamics inside the trunk were recorded. Lack of dynamics was also observed at values above +24.02°C (tree no. 4 in 2020). The maximum flow rate was estimated to be 6.12 (cumulative frequency/1°C) at a temperature of 8.36°C, corresponding to a flow rate of 171.03 Hz. Below and above this point, the flow dynamics decrease.
Characteristics of the sap flow dynamics for the minimum and maximum temperatures for the examined trees in particular years
| No. tree | Year | Tmin (CF/1°C) CF | Tmax (CF/1°C) CF | CF/1°C max (T) CF | Rccc |
|---|---|---|---|---|---|
| Tree 1 | 2019 | −5.80 (5.80) 93.54 | 28.46 (3.97) 319.69 | 7.53 (8.28) 191.55 | 0.963 |
| 2020 | −2.48 (3.68) 136.13 | 24.49 (5.44) 326.99 | 8.38 (12.57) 238.77 | 0.964 | |
| 2021 | −15.79 (2.42) 48.91 | 25.46 (0.00) 254.14 | 7.07 (2.33) 160.33 | 0.956 | |
| Tree 2 | 2019 | −6.43 (2.27) 88.81 | 28.84 (2.03) 219.40 | 4.48 (10.75) 153.13 | 0.911 |
| 2020 | −2.72 (2.60) 106.99 | 24.47 (1.85) 230.23 | 5.70 (10.14) 166.97 | 0.892 | |
| 2021 | −16.97 (0.00) 55.31 | 25.55 (0.74) 241.98 | 6.50 (5.22) 179.83 | 0.903 | |
| Tree 3 | 2019 | −6.34 (7.66) 64.59 | 28.72 (11.09) 252.29 | 8.69 (3.22) 135.27 | 0.672 |
| 2020 | −1.88 (2.34) 100.90 | 24.10 (4.66) 225.67 | 5.63 (14.96) 177.20 | 0.775 | |
| 2021 | −15.93 (5.37) 30.58 | 25.81 (4.77) 285.62 | 5.58 (18.72) 236.75 | 0.898 | |
| Tree 4 | 2019 | −6.30 (4.44) 97.59 | 28.63 (4.37) 257.79 | 4.68 (10.03) 172.70 | 0.900 |
| 2020 | −1.80 (3.75) 120.01 | 24.02 (0.00) 209.47 | 4.89 (6.20) 156.08 | 0.852 | |
| 2021 | −15.05 (0.62) 60.15 | 25.53 (1.24) 276.82 | 7.55 (5.72) 168.93 | 0.890 | |
| All | All | −16.09 (0.00) 75.37 | 31.81 (0.00) 266.69 | 6.12 (8.36) 171.03 | 0.913 |
Based on the estimated regression function for all trees in 3 years (Fig. 3), the first derivative was calculated and the dynamics of sap flow in the trunk was determined. Figure 4 shows the sap flow dynamics function in a pine trunk. It shows the maximum flow dynamics at a temperature of 8.36°C, which was determined on the basis of the results obtained. At temperatures below freezing, there is a complete absence of flow. At temperatures above 30°C, the trees reach their maximum flow dynamics and despite the increase in temperature, the flow dynamics does not increase. The lack of flow dynamics as a function of temperature is not identical to the lack of flow in the pine trunk.

Dynamic function of sap flow in a pine trunk for four analysed trees in the Kampinos National Park depending on the temperature
Sap flow has been the subject of research related to e.g. with the reaction of Scots pine to drought (Dukat el. al. 2023), to precipitation (Wang et al. 2017). However, there was no analysis of sap flow in the trunk of a pine tree in the phase of old growth. The sensors described in the methodology have so far been used to study deciduous trees – black alder (Rutkowkski et al. 2019) as well as beech and sycamore maple (Rutkowski et al. 2020a). Studies on sap flow in tree trunks have used several methods. One such method is the thermal dissipation probe method, which was based on the principle of heat energy dissipation. Special probes were inserted into the tree trunk and the temperature difference between the heated and unheated parts of the probe allowed estimation of the sap flow dynamics (Granier 1985). Another method is the constant heat flow method, in which a constant heat flow is introduced into the tree trunk and the temperature distribution along the probe is measured. Based on this distribution, the sap flow can be estimated (Čermák et al. 2004). Dendrometric method is based on the use of dendrometers to monitor changes in trunk circumference that correlate with water flow and changes in the cells (Zweifel and Häsler 2001).
The intensity of sap flow in the trunks of old-growth pines is strongly related to air temperature (Fig. 2–4), which is also confirmed by the high Rccc (Tab. 2). Small distances between the confidence intervals indicate correctly selected investigation methods. The expected result was an increase in sap flow in the summer months, when instantaneous and average daily temperatures are the highest. These values vary according to tree species, stand structure and geographical location (Granier et al. 1996). According to plant physiology, the intensity of sap flow in the trunk increases, with the increase in transpiration resulting from an increase in air temperature. As a process, transpiration follows the laws that govern the evaporation of water from a moist surface. The higher the vapour pressure gradient, the faster the evaporation (Kacperska 2005b). Sap flow was also observed in winter, which is related to the ongoing processes of photosynthesis that continue in the pine as long as light and temperature conditions are suitable (Linder and Troeng 1980; Oleksyn 1993). This is confirmed by the data from the detailed diagrams shown in Appendix and Figure 2, where the average daily sap flow in 2020 did not reach values below 50 Hz (no daily standstill of sap flow was recorded). When analysing the annual diagrams of all the trees (Fig. 2), it was found that the sap flow reached different values in the trees studied at the same temperatures. The values of maximum average daily flow of more than 300 Hz were reached for tree No. 1 in 2019 and 2020. Flows for tree No. 2 reached the maximum values that did not exceed 250 Hz, with the highest values recorded in 2021. There are also differences in the flow values achieved for individual trees in different years, which could be due to the average daily temperatures and the abundance of the environment in terms of water available for plants. The amount of sap flow in the pine trunk is an individual value and may be related to the following, among other things:
- –
ongoing physiological processes (respiration, transpiration) that are dependent on atmospheric conditions (Verbeeck 2007);
- –
the presence of pathogenic organisms – invertebrates (Hlávková and Doležal 2022) and fungi (Villari et al. 2012), which affect the health resistance of trees;
- –
wood defects, such as fibre twists, cracks or mechanical damage (Ślęzak 2010) and
- –
the place of the plant in the spatial arrangement of the stand, exposure of the crown to light is important for the intensity of physiological processes.
The factor influencing flow disturbance could be the increased degree of defoliation observed in tree no. 3. Based on Figure 2, for 2021. it is assumed that a lower number of assimilation apparatus tries to compensate for the tree’s demand in the process of sap transport and photosynthesis over a longer period of time. A less-differentiated sap flow line can indicate existing physiological disturbances and provide information about the ongoing processes of plant death, which, in the case of pine, is not as quickly visible in the assimilation apparatus as in deciduous trees. The dieback process in pines is a difficult phenomenon to observe and requires some experience in assessing the health of the crown (Jaszczak 2005), which is partly due to the fact that due to the gradual change in the assimilation apparatus (needles), the growth of shorter needles starts in about 2–3 years. This phenomenon does not apply to the gradual influence of invertebrates (Andreieva and Goychuk 2020).
Analysis of Figure 3 and Table 2 shows that the average daily peaks of old-growth pine reach a value of 266.69 Hz. The size of the sap flow is mechanically limited by the physical structure of the xylem and phloem, whose diameter does not allow the transport of a larger amount of water in the plant, which is related to the hydraulic capacity of the membranes (Kacperska 2005a). Increasing the flow would lead to the destruction of the internal conducting organs, which would affect the disturbed transport of assimilates and, in extreme cases, lead to the death of the plant.
In the xylem, water and the substances dissolved in it move in the direction of the transpiration current on the basis of the water potential gradient. The phloem moves the substances dissolved in water in acropetal (from bottom to top) and basipetal (from top to bottom) directions with the participation of metabolic energy in the form of adenosine triphosphate (ATP) (Kieliszewska-Rokicka 1993).
One of the factors influencing water transport in the plant is the intensity of transpiration, which depends on meteorological conditions (air temperature and humidity) and the availability of water to the roots. If there is enough water in the soil, the intensity of transpiration does not need to be restricted by the plants at high temperatures (Eilmann et al. 2009). When the availability of water decreases, a gradual process of limiting transpiration begins by closing the stomata (Zweifel et al. 2007). No significant slowing of its intensity was found in the circadian system of sap flow. This is due to the fact that the plant transpires more water during the day than it takes up; the water stored in the tree trunk is consumed. At the time of nocturnal transpiration reduction in the plant, the resulting demand is supplemented and the water reservoir is replenished, to be used again in the next diurnal cycle (Verbeeck et al. 2007).
Graph 4 shows the dynamics of the flow, which is highest at a temperature of 8.36°C. Below and above this value, the dynamics decrease and, as shown in the model, reach 0 at −16.09°C and 31.81°C. The results presented show that the influence of temperature is an individual characteristic. The model value of −16.09°C refers to the situation in which the plant gradually adapts to low temperatures and completely stops conducting sap in the stem trunk. In the environment, plants respond dynamically to changes in weather conditions, which are very important for low and high temperatures. In temperate climates, plants undergo hardening off, which takes place in spring and autumn, that is, when the temperature is between 0 and +5°C. This is the time when the plant’s metabolic rate increases. At this time, metabolic changes occur that cause a change in the activity of growth stimulators and the formation of abscisic acid (ABA), which is responsible, among other things, for limiting transpiration and switching the plants to rest, which leads to an inhibition of growth and synthesis processes as well as cell desiccation. The plant’s resistance to low temperatures and drought increases (Kacperska 2005b). Another factor that prepares the plant for changing weather conditions and influences the plant’s response is the length of the day and night, the so-called photoperiod (Partanen and Beuker 1999).
When interpreting the model for the values of positive maximum temperatures, it should be noted that the flow in the plant does not come to a standstill. A complete interruption of the transport of water and assimilates could lead to death of the plant, as cooling of the plant (transpiration) stops and the respiratory processes are disturbed (Ryan et al. 1994). The practical absence of changes in flow dynamics is due to the anatomical and physical structure of the conduction organs described above. At prolonged high temperatures, when there is a risk of excessive water transpiration, the plant reduces losses by closing the stomata (Zweifel et al. 2007). In the analyses carried out, no limitation of water flow was observed at the highest temperatures of around 30°C. This reaction resulted from the fact that the highest temperatures were maintained for a short time (2–3 h) during the day. From the study of Kellomäki and Wang (1998), Wang et al. (2018) showed that the plant can evaporate more water than it takes up in a short period of time, and that the loss is replenished during the hours of lower solar radiation (late afternoon, evening), which was also confirmed in the studies described. The results obtained did not prove a decrease in the flow dynamics in trunks during the day, despite significant differences in daytime and nighttime temperatures.
Based on long-term measurements of the relationship between sap flow in the trunk of a pine tree in the old-growth phase and air temperature, their high correlation was confirmed (0.913). However, it should be noted that the flow and its dynamics is an individual characteristic that does not depend on the dendrometric characteristics of the trees.
In the studies presented, the average flow in the pine trunk reached the highest value of 266.69 Hz, which was recorded at temperatures around 30°C, as it has been shown that temporarily higher temperatures in a temperate climate do not change the value of maximum flows. However, the flow approaches the minimum values below −5°C, but it should be emphasised that the hypothetical dynamics of flow slowdown reaches zero at −16.09°C. The fastest flow changes in the stem of old-growth pine growing in KNP occur at average daily temperatures of 8.36°C. The analyses carried out lead to a continuation of the research in stands of different age classes and other tree species. The flow dynamics trait may have adaptive significance for modelling-assisted migration of Scots pine genotypes and populations.