
1. INTRODUCTION
Over the past decade, additive manufacturing, better known as 3D printing, has matured from a rapid prototyping convenience into a legitimate route for producing end-use engineering components (Ngo et al., 2018; Prashar et al., 2022). Fused deposition modeling (FDM), sometimes referred to as fused filament fabrication (FFF), stands out among the available techniques because it pairs low equipment cost with straightforward operation and broad material compatibility. Printed polylactic acid (PLA), a thermoplastic polyester derived from renewable feedstocks such as corn starch, has become the default filament choice for desktop FDM printers (Chacón et al., 2017; Taib et al., 2022; Yadav et al., 2022; Linardi et al., 2025). Its appeal rests on a combination of good printability, reasonable stiffness, acceptable surface finish, and the fact that it is biodegradable, properties that suit many prototype, educational, and semi-structural roles (Farah et al., 2016; Sandanamsamy et al., 2022).
The layered nature of the FDM process, however, leaves its mark on the finished part. Each deposited bead bonds to the one below it through a narrow re-melt zone, and the resulting inter-layer and inter-raster interfaces are inherently weaker than the bulk polymer. This gives rise to anisotropy, variable bonding quality, and distributed micro-porosity that collectively make FDM parts behave differently from injection-molded or machined counterparts (Ahn et al., 2002; Khosravani & Reinicke, 2020). As a consequence, a substantial research effort has been directed toward quantifying how layer height, raster angle, infill density, nozzle temperature, and print speed affect the tensile, compressive, and flexural response of FDM-printed polymers (Ayatollahi et al., 2020; Rajan et al., 2022; Abdulridha & Aqbbas, 2023).
In practical engineering applications, structural components commonly include geometric discontinuities such as holes or cutouts, which act as stress concentrators and significantly influence mechanical behavior (Li et al., 2020). While the stress concentration factor for such features is well established for conventionally manufactured isotropic materials, its applicability to FDM-printed materials characterized by inherent anisotropy and microstructural heterogeneity remains an open and actively investigated issue (Pyl et al., 2019).
Previous studies have extensively explored the influence of process parameters on tensile properties, with findings indicating a complex, non-monotonic relationship. Dave et al. (2020) investigated the tensile behavior of FDM-printed PLA plates containing a central circular hole by adopting the ASTM D5766 open-hole tensile standard, traditionally used for composite laminates. Their experimental study demonstrated that geometric discontinuities significantly amplify the influence of process-induced anisotropy, with raster angle emerging as the dominant parameter controlling strength. Specimens printed with a 0° raster orientation exhibited the highest ultimate tensile strength due to load-aligned rasters, whereas 45° orientations led to premature failure initiated near the hole edges. The results confirmed that classical stress concentration concepts remain qualitatively valid for FDM materials, but their quantitative response is strongly governed by printing parameters and inter-raster bonding mechanisms. Sanei et al. (2020) investigated the tensile behavior of 3D-printed continuous carbon fiber– reinforced thermoplastic composites containing open holes using standardized open-hole tensile (OHT) tests. Their study demonstrated that geometric discontinuities induce pronounced local stress concentrations; however, unlike conventionally manufactured laminates, failure did not propagate directly through the hole. Instead, crack initiation occurred in the stress concentration zone and subsequently deviated around the hole due to process-enabled fiber reinforcement placed along the hole periphery. The results revealed a clear reduction in ultimate tensile strength with increasing hole diameter, while also confirming that additive manufacturing allows tailored reinforcement strategies capable of mitigating classical notch sensitivity effects when compared to traditional composite systems. Sabik et al. (2022) investigated the failure behavior of PLA specimens with varying raster angles (0°, 45°, and 90°) using digital image correlation techniques coupled with finite element analysis, revealing that alignment of the raster direction with the tensile load substantially enhances strength and modulus. Similarly, build orientation – the spatial arrangement of the part on the printing platform – significantly affects mechanical performance, with flat orientations generally yielding superior tensile properties compared to upright or edge configurations. This anisotropic behavior necessitates strategic orientation planning to optimize mechanical performance for specific loading scenarios.
Infill density and pattern geometry represent additional parameters that profoundly influence the strength-to-weight ratio of FDM components. Zhou et al. (2018) conducted comprehensive evaluations of various infill patterns including rectilinear, triangular, and honeycomb geometries at densities ranging from 20% to 80%, demonstrating that triangular patterns at 20% infill achieved the highest ultimate tensile strength-to-weight ratio. Aldosari et al. (2023) further confirmed that honeycomb infill patterns at 60% density provide excellent strength while significantly reducing material consumption compared to solid parts. These investigations highlight the potential for optimizing mechanical performance through judicious selection of internal structure parameters, enabling the design of lightweight yet mechanically robust components.
Finite element analysis (FEA) has emerged as an indispensable tool for predicting and understanding the mechanical behavior of FDM-fabricated parts. Various constitutive modeling approaches have been developed to capture the complex material response, ranging from simplified isotropic models to sophisticated orthotropic and laminate composite formulations. Alharbi et al. (2020) demonstrated that von Mises plasticity models with nonlinear material definitions can accurately simulate the stress–strain response of PLA up to the failure point, with minimal deviation from experimental results except in the fracture zone. More advanced approaches, such as the Hashin damage criterion employed by Sabik et al. (2022), incorporate progressive damage evolution and energy-based softening to model failure propagation in layered structures. These numerical methodologies provide valuable insights into stress distributions, failure mechanisms, and optimal design strategies, complementing experimental investigations and enabling virtual prototyping capabilities.
Despite the substantial body of research investigating the effects of processing parameters on the mechanical properties of FDM-fabricated PLA, a notable gap exists in the understanding of how geometric features, particularly holes and apertures, influence tensile behavior. While extensive work has examined the role of infill patterns, layer orientation, and material deposition strategies, systematic investigations into the effect of hole geometry – specifically aperture angle – on tensile strength remain limited. Holes and openings are ubiquitous features in functional components, serving purposes such as assembly integration, weight reduction, and fluid passage. However, these geometric discontinuities introduce stress concentrations that can significantly compromise structural integrity. The orientation and angular configuration of such apertures relative to the loading direction may exhibit complex interactions with the inherently anisotropic nature of FDM parts, potentially leading to premature failure under tensile loading.
The present investigation addresses this knowledge gap by systematically examining the influence of paired-aperture orientation on the comparative tensile response of FDM-fabricated PLA specimens. The study is deliberately framed as a comparative analysis rather than as a bulk-material characterization: all specimens share an identical dog-bone external envelope (per ISO 3167:2014(E)), an identical print-parameter set, and an identical gauge cross-section A0 used as a fixed stress-normalization reference, and they differ only in the angular orientation θ of two paired through-thickness holes of equal radius R = 1 mm and inter-center spacing d = 5 mm. With this protocol, any change in the recorded stress–strain response can be attributed unambiguously to the aperture orientation. A total of twenty-seven specimens were manufactured, with three replicates produced for each of nine configurations: a solid reference and eight aperture orientations spanning 0°–105° in 15° increments. For each specimen, two stress measures are reported: the maximum gross-section nominal stress σnom,max and the maximum net-section stress σnet,max, together with the apparent Young’s modulus Eapp and the full engineering stress–strain curve. A companion finite-element model implemented in Abaqus is used to interpret the angular dependence in terms of the rotation of the stress-concentration field and the change of the inter-hole ligament orientation. The angle-resolved strength data and the associated mechanism-based interpretation are intended to provide quantitative design guidance for FDM-printed PLA components that must accommodate bolt rows, lightening holes, or fastener pass-throughs at non-canonical orientations.
2. MATERIALS AND METHODS
2.1. Sample Preparation
The test specimens were designed following the general guidelines of ISO 3167:2014(E) standards (Fig. 1), with modifications to accommodate the inclusion of through-thickness circular apertures. Each specimen featured a dog-bone geometry with a gauge section in which two circular holes of equal radius (R1) (Fig. 1c) were positioned symmetrically about the longitudinal centerline. The angular orientation of the line connecting the centers of the two apertures, measured relative to the horizontal axis perpendicular to the loading direction, was varied systematically across eight configurations: 0°, 15°, 30°, 45°, 60°, 75°, 90°, and 105°. In addition, a solid (no-aperture) configuration served as the reference control group. The specimen geometry and aperture configurations are illustrated in Fig. 1d.
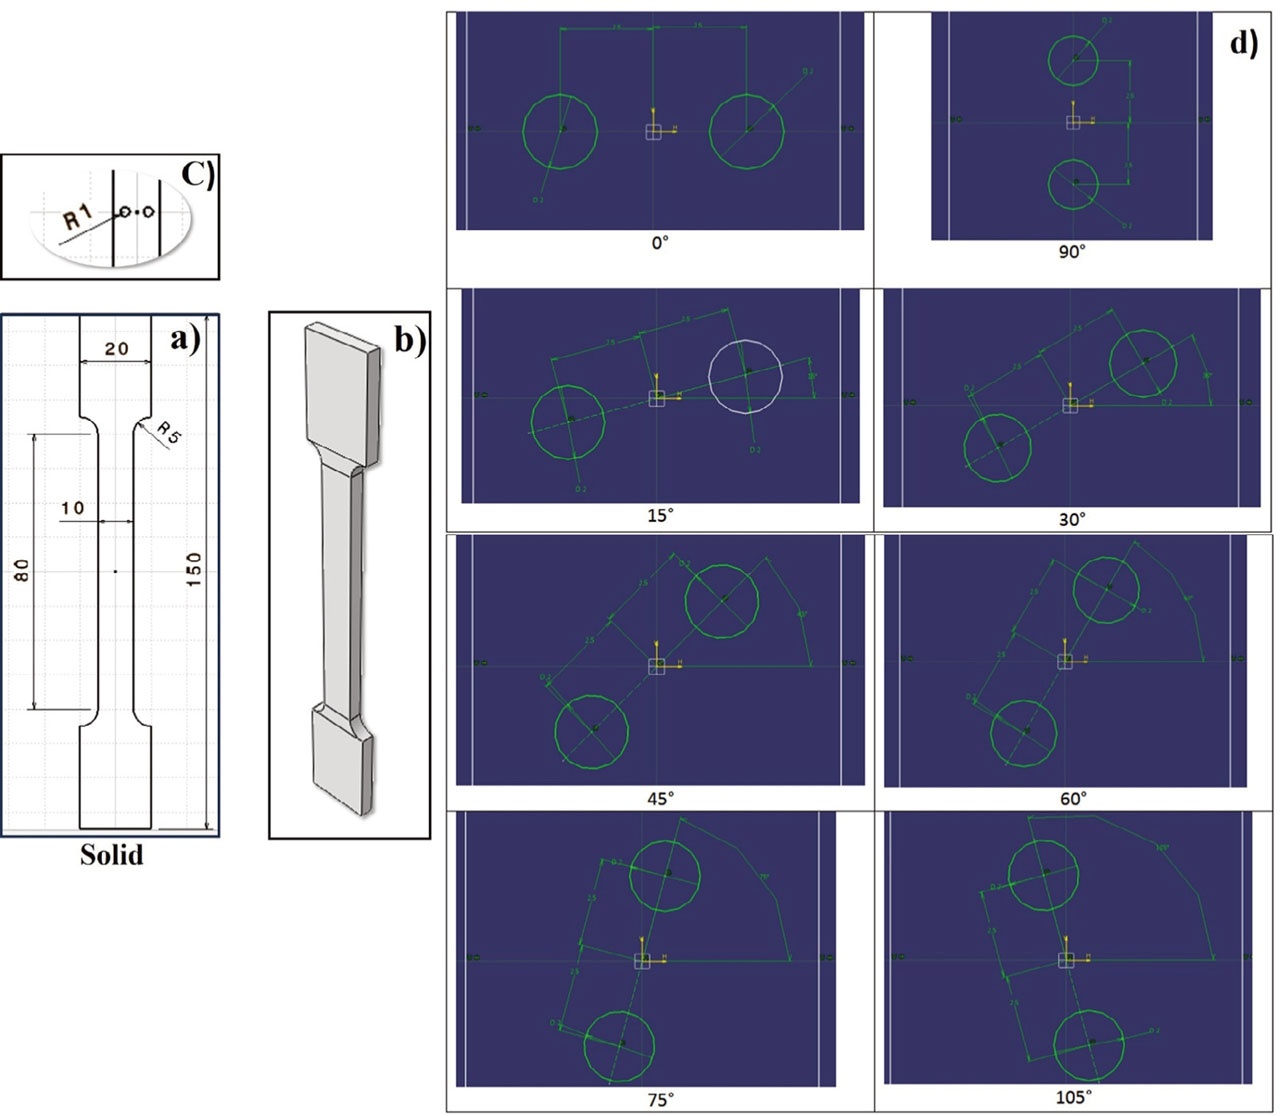
Fig. 1.
Specimen geometry and aperture-angle configurations: (a) solid (reference) specimen; (b) overall dog-bone dimensions of the test specimen, defined according to ISO 3167:2014(E), with gauge length L0, gauge width b, and thickness h; (c) detail of the gauge section showing the two through-thickness apertures of equal radius R1 and inter- center spacing d, with the angle θ measured between the inter-center line and the axis transverse to the loading direction; (d) the eight aperture orientations investigated (θ = 0°, 15°, 30°, 45°, 60°, 75°, 90° and 105°) together with the solid reference.
All specimens were fabricated from commercially available PLA filament with a nominal diameter of 1.75 mm using an FDM Anycubic i3 Mega X printer (Fig. 2). The printing parameters were held constant across all specimens to isolate the effect of aperture angle as the sole experimental variable (Table 1). The key printing parameters included a layer thickness of 0.2 mm, a nozzle temperature of 200°C, a bed temperature of 60°C, an infill density of 100%, and a rectilinear infill pattern with a raster angle of ±45°. The print speed was set at 50 mm/s. A total of 27 specimens were fabricated, comprising three replicates for each of the nine configurations (one solid and eight apertured).
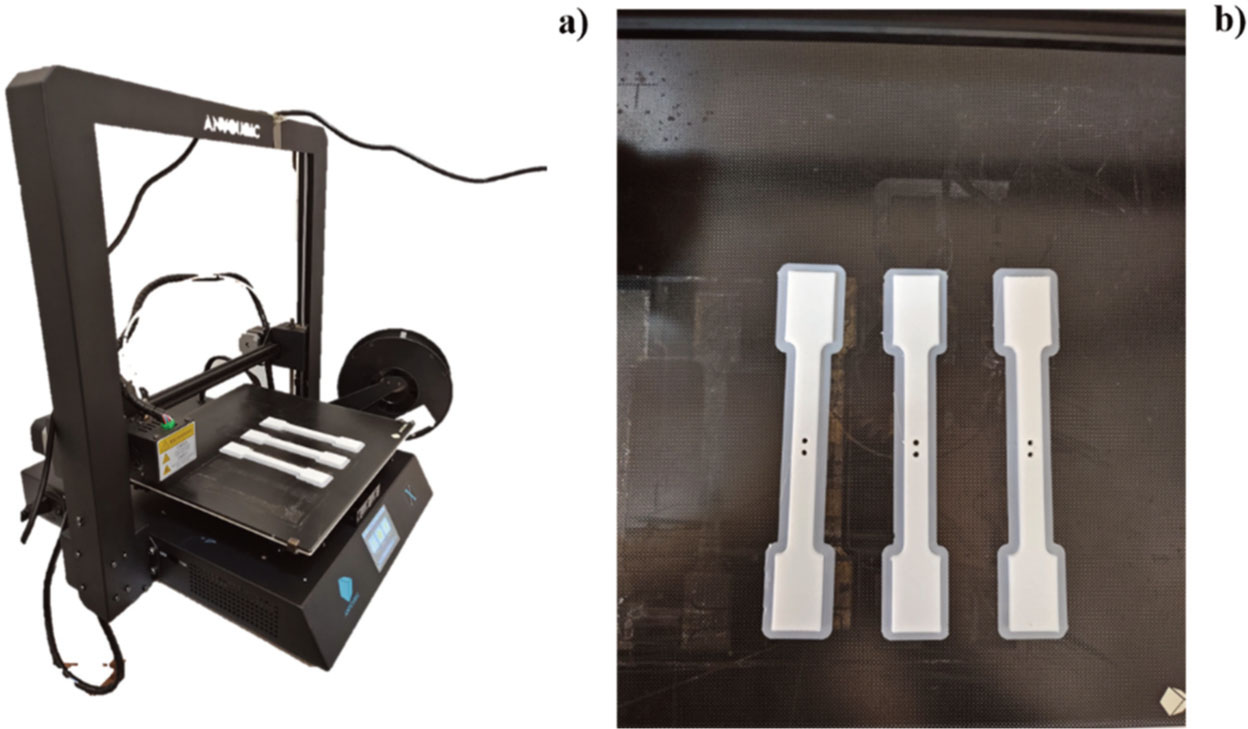
Fig. 2.
Specimens during and after printing. (Source: authors’ own work).
Table 1.
Filament specifications and FDM print parameters held constant across all 27 specimens.
| Parameter | Symbol | Value | Unit |
|---|---|---|---|
| Filament material | — | PLA, white | — |
| Filament diameter | df | 1.75 | mm |
| Filament density | ρ | 1.24 | g/cm3 |
| Spool weight | — | 1 | kg |
| 3D printer | — | Anycubic i3 Mega X | — |
| Nozzle temperature | Tn | 200 | °C |
| Build-plate temperature | Tb | 60 | °C |
| Layer height | hl | 0.20 | mm |
| Wall thickness | tw | 1.20 | mm |
| Infill density | ρinf | 100 | % |
| Infill / raster pattern | — | Rectilinear, ±45° | — |
| Print speed | v | 50 | mm/s |
2.2. Tensile test
Quasi-static uniaxial tensile tests were performed on all 27 specimens using a universal testing machine equipped with a calibrated 5 kN load cell, at a crosshead speed of 0.1 mm/min (Fig. 3). The applied force F and the crosshead displacement Δ were recorded continuously throughout each test until specimen fracture.
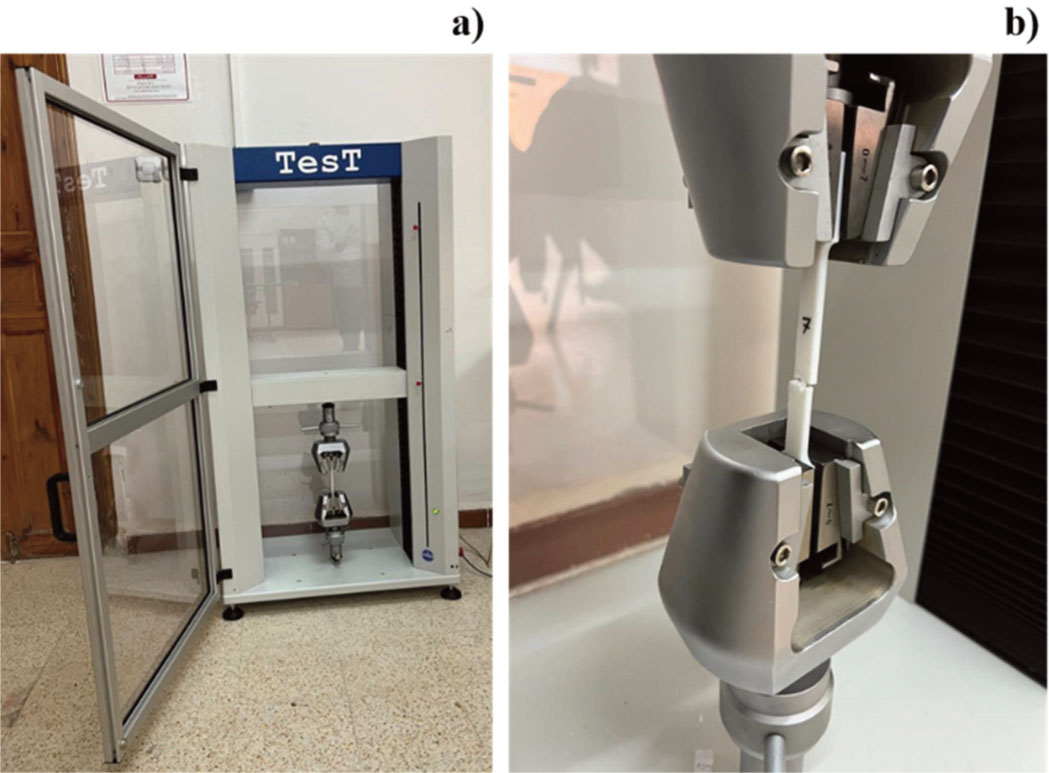
Fig. 3.
Tensile testing protocol. (Source: authors’ own work).
Two cross-sectional references are used in the analysis. The gross gauge cross-section A0 = b · h = 10 × 4 = 40 mm2 is the unperforated rectangular cross-section of the gauge region; A0 is identical across all 27 specimens by construction. The net cross-section Anet(θ) is the minimum cross-sectional area of any plane perpendicular to the loading axis that intersects the perforations of a given specimen; Anet(θ) varies with the aperture orientation θ and is computed analytically from the CAD geometry (see Section 3.3 and Eqs. (3)–(4)). From the recorded F–Δ data, two stress measures are derived for each specimen: the gross-section nominal stress σnom = F / A0, and the net-section stress σnet = F / Anet(θ). The engineering strain ε is obtained by normalizing Δ by the initial gauge length L0 = 80 mm.
For each specimen, the maximum gross-section nominal stress σnom,max was identified as the peak of the σnom–ε curve. For the perforated configurations σnom,max represents an apparent strength of the perforated geometry rather than the intrinsic UTS of the bulk PLA; the corresponding net-section value σnet,max = Fmax / Anet(θ) is also reported (Table 2). The apparent modulus Eapp was determined by linear regression of the σnom–ε curve over the range 5–40% of σnom,max; the coefficient of determination exceeded 0.999 for every specimen, confirming that the selected interval lies within the linear-elastic region (Dizon et al., 2018).
Table 2.
Summary of experimental σnom,max results for all nine configurations.
| θ | σnom,1 (MPa) | σnom,2 (MPa) | σnom,3 (MPa) | Mean σnom,max ± SD (MPa) | Anet/A0 (–) | Regime | Mean σnet,max (MPa) | % red. in σnom |
|---|---|---|---|---|---|---|---|---|
| Solid | 28.24 | 25.51 | 27.96 | 27.23 ± 1.50 | 1.000 | — | 27.23 | — |
| 0° | 24.48 | 23.87 | 22.65 | 23.67 ± 0.94 | 0.600 | Two-hole-cut | 39.45 | +13.1 |
| 15° | 21.87 | 23.19 | 21.68 | 22.25 ± 0.82 | 0.695 | Two-hole-cut | 32.01 | +18.3 |
| 30° | 24.12 | 23.92 | 25.94 | 24.66 ± 1.11 | 0.800 | One-hole-cut | 30.83 | +9.4 |
| 45° | 24.85 | 23.97 | 23.57 | 24.13 ± 0.65 | 0.800 | One-hole-cut | 30.16 | +11.4 |
| 60° | 25.97 | 26.27 | 25.52 | 25.92 ± 0.37 | 0.800 | One-hole-cut | 32.40 | +4.8 |
| 75° | 26.71 | 26.40 | 26.55 | 26.56 ± 0.15 | 0.800 | One-hole-cut | 33.20 | +2.5 |
| 90° | 27.55 | 27.65 | 27.08 | 27.42 ± 0.30 | 0.800 | One-hole-cut | 34.28 | −0.7 |
| 105° | 28.07 | 28.95 | 26.92 | 27.98 ± 1.01 | 0.800 | One-hole-cut | 34.98 | −2.8 |
To identify a representative specimen from each group for subsequent FEA comparison, the specimen whose σnom,max was closest to the group mean was selected (Table 4).
Table 3.
Summary of Eapp results for all nine configurations.
| Aperture Angle | E1 (MPa) | E2 (MPa) | E3 (MPa) | Mean (MPa) | SD (MPa) | R2 (all) |
|---|---|---|---|---|---|---|
| Solid | 1437.0 | 1442.2 | 1442.0 | 1440.40 | 2.96 | >0.999 |
| 0° | 1308.8 | 1411.1 | 1372.4 | 1364.08 | 51.61 | >0.999 |
| 15° | 1446.7 | 1483.5 | 1457.7 | 1462.64 | 18.87 | >0.999 |
| 30° | 1453.1 | 1436.2 | 1435.9 | 1441.75 | 9.86 | >0.999 |
| 45° | 1445.3 | 1448.0 | 1450.1 | 1447.77 | 2.43 | >0.999 |
| 60° | 1448.5 | 1454.7 | 1451.5 | 1451.56 | 3.10 | >0.999 |
| 75° | 1460.2 | 1408.6 | 1447.5 | 1438.76 | 26.86 | >0.999 |
| 90° | 1453.2 | 1466.0 | 1445.0 | 1454.72 | 10.59 | >0.999 |
| 105° | 1496.4 | 1501.4 | 1485.8 | 1494.49 | 7.97 | >0.999 |
| Overall Mean | — | — | — | 1444.02 | 37.53 | >0.999 |
Table 4.
Representative specimens selected for FEA validation. The representative specimen of each group is the one whose σnom,max lies closest to the group mean.
| Aperture Angle | Specimen | Specimen σnom,max (MPa) | Group mean σnom,max (MPa) |
|---|---|---|---|
| Solid | SP3 | 27.96 | 27.23 |
| 0° | SP5 | 23.87 | 23.67 |
| 15° | SP7 | 21.87 | 22.25 |
| 30° | SP10 | 24.12 | 24.66 |
| 45° | SP14 | 23.97 | 24.13 |
| 60° | SP16 | 25.97 | 25.92 |
| 75° | SP21 | 26.55 | 26.56 |
| 90° | SP22 | 27.55 | 27.42 |
| 105° | SP26 | 28.07 | 27.98 |
2.3. Abaqus modeling
Three-dimensional finite element models were developed using Abaqus/Explicit (Dassault Systèmes) to simulate the tensile behavior of the representative specimen from each configuration. The specimen geometry, including the through-thickness circular apertures at the specified angular orientations, was modeled in its entirety to capture any asymmetric stress distributions arising from the aperture arrangement.
The PLA material was modeled as an isotropic elastic–plastic continuum. The elastic behavior was defined by the experimentally measured Young’s modulus and a Poisson’s ratio of 0.36, which is a commonly adopted value for PLA in the literature. The plastic behavior was characterized using tabulated true stress–true plastic strain data derived from the engineering stress–strain curves of the representative specimens. The conversion from engineering to true stress–strain was performed using the standard relations (Manoj et al., 2024):
Only the pre-necking portion was used for calibrating the plasticity table.
The Abaqus ductile damage initiation criterion was employed to capture the onset and progression of material failure, with the equivalent fracture strain specified as a function of stress triaxiality and strain rate. Damage initiation was calibrated by taking the equivalent plastic strain εpl at the onset of the sharp load drop in the experimental stress–strain curve (fracture onset), and damage evolution was defined using a displacement-at-failure criterion (Adibeig et al., 2023).
The mesh was generated using three-dimensional eight-node linear brick elements with reduced integration (C3D8R). A mesh refinement study was performed to ensure convergence of the stress and displacement fields, with particular attention given to the mesh density in the vicinity of the apertures where stress gradients are most severe (Kazemi et al., 2026). The boundary conditions replicated the experimental setup: one end of the specimen was fully fixed (encastre), while a displacement-controlled loading was applied to the opposite end. The simulation was run as a quasi-static analysis with geometric nonlinearity (NLGEOM) enabled to account for the large deformations observed experimentally prior to fracture (Fig. 4).
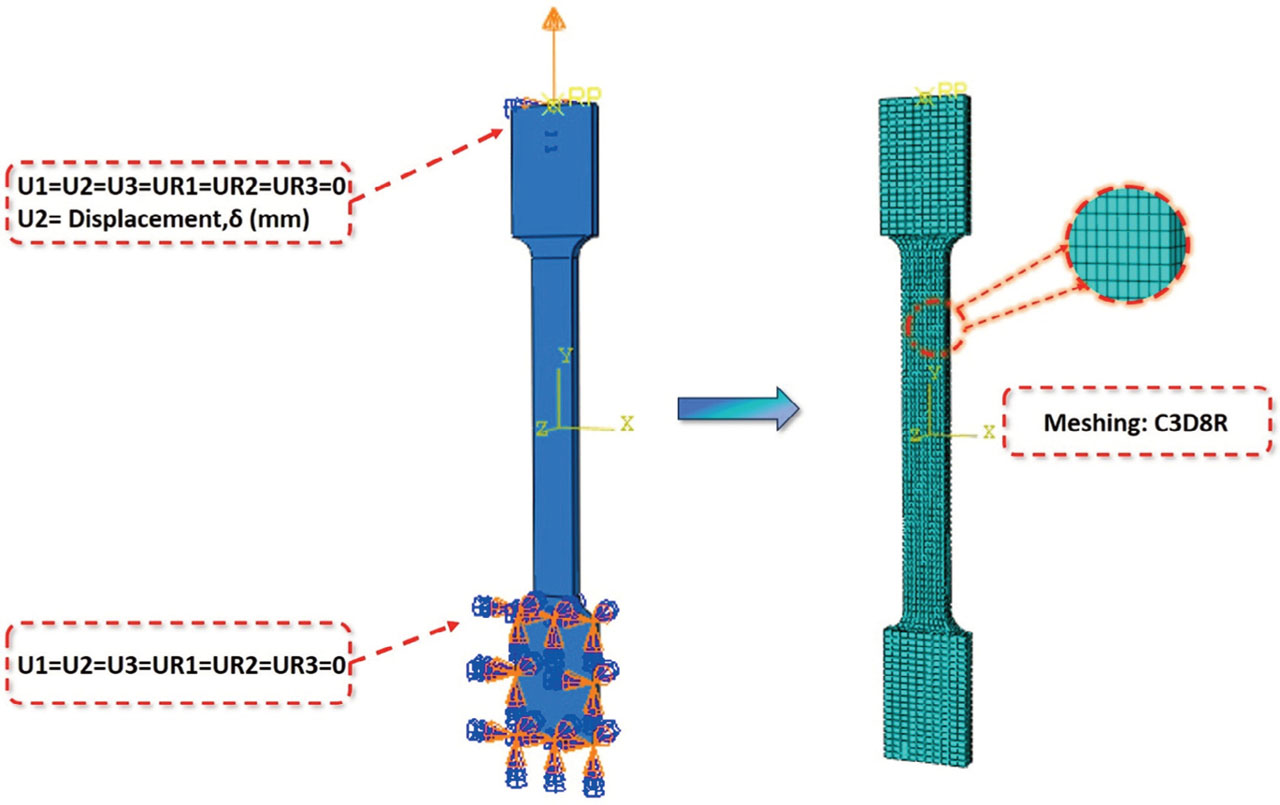
Fig. 4.
Loading and meshing parameters. (Source: authors’ own work).
3. RESULTS AND DISCUSSION
3.1. Stress–Strain Behavior
The experimentally recorded engineering stress–strain curves for all 27 specimens are presented in Fig. 6. The curves generally exhibit a characteristic shape consisting of a linear elastic region, a gradual transition to nonlinear deformation, attainment of a peak stress (the maximum gross-section nominal stress, σnom,max), and a subsequent softening phase leading to fracture. All specimens demonstrated smooth, continuous loading without evidence of sudden load drops prior to reaching the σnom,max, indicating that the FDM-printed PLA material deformed in a stable manner throughout the pre-peak regime.
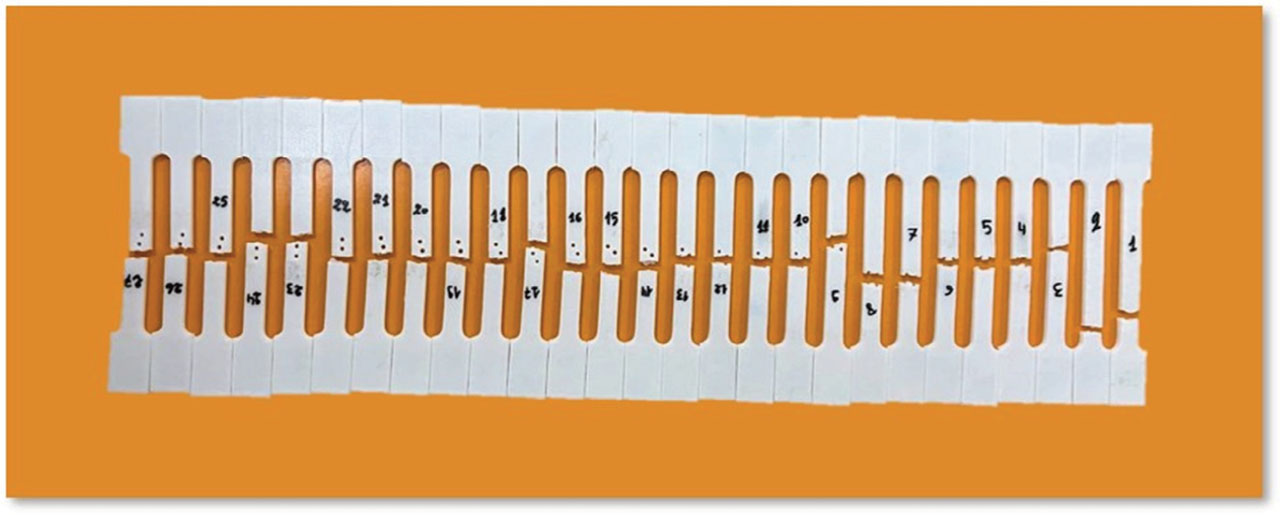
Fig. 5.
All 27 specimens after tensile test.
(Source: authors’ own work).
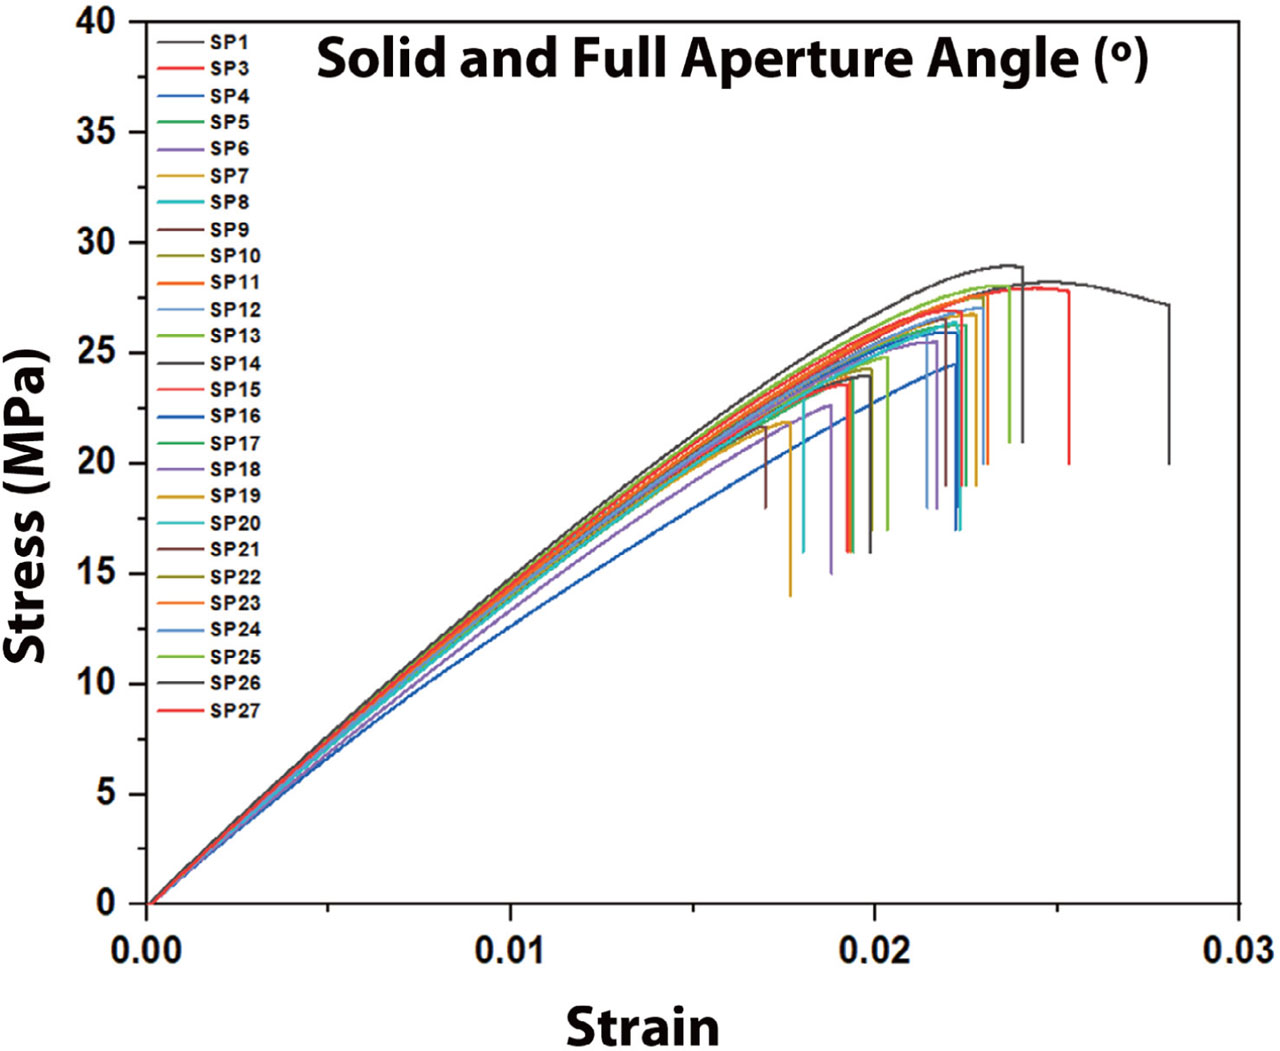
Fig. 6.
Stress–strain behavior in 27 experimental specimens.
(Source: authors’ own work).
A notable observation is that the solid specimens (SP1–SP3) attained the highest strain at fracture, reaching approximately 0.025–0.030, whereas the apertured specimens generally exhibited reduced ductility depending on the angular orientation. The specimens with apertures oriented at 0° and 15° displayed the lowest failure strains (approximately 0.019–0.022), indicating that these configurations produce the most severe stress concentration effects under the applied loading conditions. In contrast, the specimens with aperture angles of 75°, 90°, and 105° exhibited failure strains approaching those of the solid specimens (approximately 0.023–0.030), suggesting that the stress concentration is mitigated when the aperture alignment approaches the direction perpendicular to loading.
These trends can be understood in terms of the stress redistribution around the apertures. When the aperture axis is aligned transverse to the loading direction (0° configuration), the two holes are positioned side by side relative to the tensile load, creating a reduced ligament between them that carries a disproportionate share of the applied stress. As the aperture angle increases toward 90° and beyond, the holes become staggered along the loading direction, distributing the stress concentration over a larger area and reducing the peak local stress in the ligament region.
3.2. Maximum gross-section nominal stress (apparent UTS)
The σnom,max values for all 27 specimens (Fig. 5), along with the group averages and standard deviations, are summarized in Table 2. The solid specimens exhibited a mean σnom,max of 27.23 ± 1.50 MPa, which serves as the baseline for comparison. Among the apertured configurations, the 15° group exhibited the lowest mean σnom,max at 22.25 ± 0.82 MPa, representing a reduction of approximately 18.3% relative to the solid configuration. The 0° group followed with a mean σnom,max of 23.67 ± 0.94 MPa (13.1% reduction).
As the aperture angle increased beyond 15°, a progressive recovery in σnom,max was observed. The 30° and 45° groups exhibited mean σnom,max values of 24.66 ± 1.11 MPa and 24.13 ± 0.65 MPa, respectively. A more pronounced recovery was observed for the 60° (25.92 ± 0.37 MPa), 75° (26.56 ± 0.15 MPa), and 90° (27.42 ± 0.30 MPa) configurations. The 105° group achieved the highest mean σnom,max among all apertured configurations at 27.98 ± 1.01 MPa, which marginally exceeded the solid group average. This result suggests that when the aperture axis is inclined beyond 90° relative to the transverse direction, the stress concentration effect becomes minimal and the effective load-bearing cross-section approaches that of the solid specimen (Khosravani & Reinicke, 2022).
The standard deviations within each group were generally small (less than 1.5 MPa), indicating good repeatability of the FDM fabrication process and the tensile testing procedure. The 75° group exhibited the lowest scatter (± 0.15 MPa), while the solid group showed the highest (± 1.50 MPa), which may reflect sensitivity to minor printing defects in the absence of geometric stress raisers that otherwise dominate the failure behavior (Mohan et al., 2019).
The relationship between aperture angle and mean σnom,max followed an approximately sigmoidal trend. The σnom,max decreased sharply from the solid value as apertures were introduced at low angles (0°–15°), reached a minimum around 15°, and then progressively recovered with increasing angle, ultimately returning to near-solid values at 90°–105°. This behavior is consistent with the progressive reorientation of the stress concentration field relative to the loading axis as the aperture angle is varied. The percentage reduction in σnom,max relative to the solid configuration is presented in Table 2.
3.3. Apparent versus net-section response
The σnom,max values reported in Section 3.2 use the unperforated gauge area A0 as the stress-normalization reference and therefore conflate two physically distinct effects: (i) the genuine angle-dependent stress concentration around the perforations, and (ii) the angle-dependent reduction of the minimum load-bearing cross-section. To separate these two contributions, the maximum net-section stress is defined as:
and was computed for every specimen using the analytical expression where R is the hole radius, d the inter-center spacing, and b the gauge width. It is emphasized at the outset that all eight perforated specimen sets contain two holes; the distinction made by Eqs. (4a,b) is purely geometric and concerns whether the minimum-section plane (the transverse plane on which fracture is governed) cuts through both holes simultaneously or through only one of them. Equation (4a) corresponds to the two-hole-cut regime, in which the longitudinal projection of the inter-center vector, d·|sin θ|, is smaller than the hole diameter 2R; in this regime a single transverse plane intersects both perforations and subtracts both chord segments from the gauge width. Equation (4b) corresponds to the one-hole-cut regime, in which d·|sin θ| ≥ 2R; in this regime no transverse plane can cross both holes simultaneously, so the minimum-section plane intersects one hole only and the second hole, although physically present in the specimen, lies on a different transverse plane and does not contribute to the minimum cross-section. The transition between the two regimes occurs at the threshold angle θc = arcsin(2R/d). For the present geometry (R = 1 mm, d = 5 mm), θc ≈ 23.58°, which places the configurations 0° and 15° in the two-hole-cut regime and the configurations 30°–105° in the one-hole-cut regime, where Anet(θ)/A0 = 0.800 is constant. The values of Anet(θ)/A0 used in this work are listed in Table 2.Three observations follow from the σnet,max column of Table 2. First, in the one-hole-cut regime (θ ∈ {30°, 45°, 60°, 75°, 90°, 105°}) the minimum load-bearing cross-section is identical across the six configurations even though every specimen still contains two holes, so any variation of σnet,max across this range isolates the genuine effect of stress-concentration severity from the trivial geometric effect of variable load-bearing area. The recorded σnet,max values rise from 30.16 ± 0.81 MPa at 45° to 34.98 ± 1.26 MPa at 105°, confirming that the rotation of the principal stress-concentration zones from a transverse alignment towards a longitudinal alignment progressively reduces their interaction and the resulting strength penalty. Second, in the two-hole-cut regime (θ ∈ {0°, 15°}) σnet,max is computed on a smaller cross-section that subtracts both holes simultaneously; the resulting values (39.45 ± 1.57 MPa at 0° and 32.01 ± 1.18 MPa at 15°) are not directly comparable to the one-hole-cut-regime values, because the underlying stress field, rather than being controlled by a single perforation, involves the constrained ligament between the two holes. Third, all σnet,max values exceed the solid-specimen σsolid = 27.23 MPa, which reflects the fact that, at fracture, the average stress on the minimum net section is bounded above by the local stress at the hole edge multiplied by the relevant stress-concentration factor; the spread of σnet,max between 30.2 MPa and 35.0 MPa in the one-hole-cut regime is therefore consistent with the well-documented stress-concentration factor of order three for an isolated circular hole, attenuated by ductile redistribution of the plastic strain in PLA. The von Mises contour maps in Fig. 9 provide an independent visual confirmation of this mechanism by showing that, at low aperture angles, the maximum-stress region is concentrated in the narrow transverse ligament between the two holes, whereas at large angles it migrates onto the inclined band that connects the two holes along the loading direction.
3.4. Young’s modulus
The apparent modulus Eapp values determined from the linear elastic region of the stress–strain curves are presented in Table 3. In contrast to the σnom,max, Eapp exhibited relatively modest variation across the different aperture angle groups. The overall mean modulus for all 27 specimens was 1444.02 ± 37.53 MPa. Individual group averages ranged from 1364.08 ± 51.61 MPa (0°) to 1494.49 ± 7.97 MPa (105°). The 45° group exhibited the lowest inter-specimen variability (± 2.43 MPa), while the 0° group showed the highest (± 51.61 MPa).
The relative stability of Eapp across aperture angles is consistent with the fact that Eapp, computed on the gross gauge cross-section, primarily reflects the homogenized stiffness of the FDM-printed material averaged over the gauge volume – which is primarily determined by the intrinsic stiffness of the PLA matrix and the quality of the inter-layer bonds, rather than by the geometric configuration of macroscopic features. During the initial elastic loading phase, the applied strains are sufficiently small that the stress concentration around the apertures does not produce localized yielding or damage, and the global specimen stiffness is governed by the average cross-sectional area and the homogenized material modulus (Seifollahi & Kabir, 2025).
The slightly lower Eapp observed for the 0° group (1364.08 MPa) may be attributed to the reduced effective cross-section when the two apertures are aligned side by side, which increases the nominal stress for a given applied strain and introduces a compliance effect that manifests as an apparent reduction in the measured Eapp. Conversely, the slightly elevated modulus of the 105° group (1494.49 MPa) may reflect a more favorable stress distribution that allows the elastic strain energy to be stored more efficiently across the specimen cross-section.
The high R2 values (all exceeding 0.999) obtained from the linear regression analysis confirm that the stress–strain response within the selected 5–40% σnom,max range is indeed linear for all specimens, validating the methodology employed for Eapp determination. These values also indicate that the FDM-printed PLA material exhibits well-defined elastic behavior despite its layered microstructure.
3.5. Effect of aperture angle on mechanical performance
To facilitate a comprehensive assessment of the influence of aperture angle on the tensile properties, the mean σnom,max and mean Eapp were plotted as functions of aperture angle in Fig. 7b-d, respectively. The σnom,max data reveal a clear and systematic dependence on the aperture angle, with the minimum strength occurring at 15° and a progressive recovery toward the solid baseline as the angle increases. The Eapp data, in contrast, display no statistically significant trend with angle, remaining within a narrow band around the overall mean value.
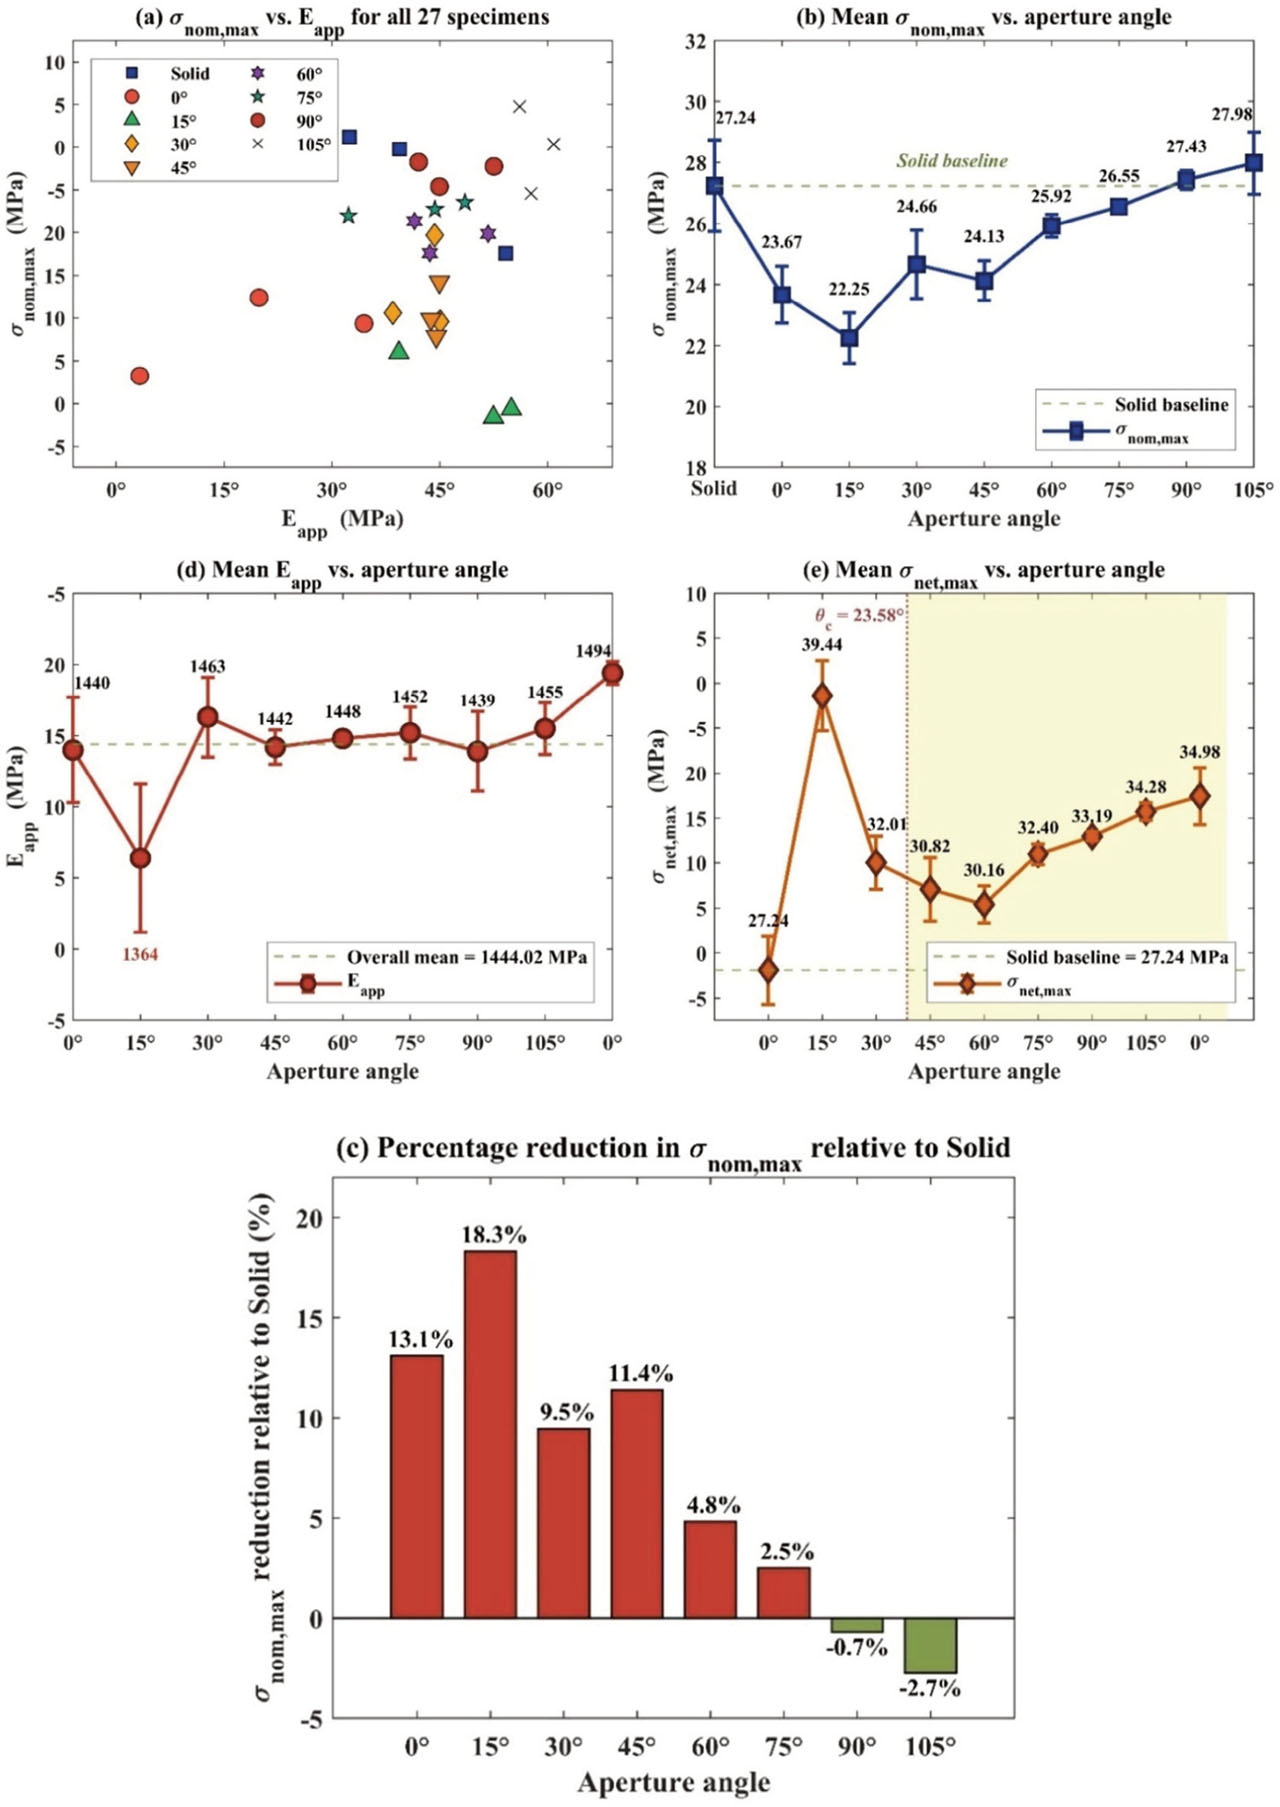
Fig. 7.
Comprehensive mechanical properties analysis: (a) σnom,max vs. Eapp scatter plot for all 27 specimens, (b) Mean σnom,max variation with aperture angle, (c) Percentage reduction in σnom,max relative to solid configuration, and (d) Mean Eapp variation with aperture angle. (Source: authors’ own work).
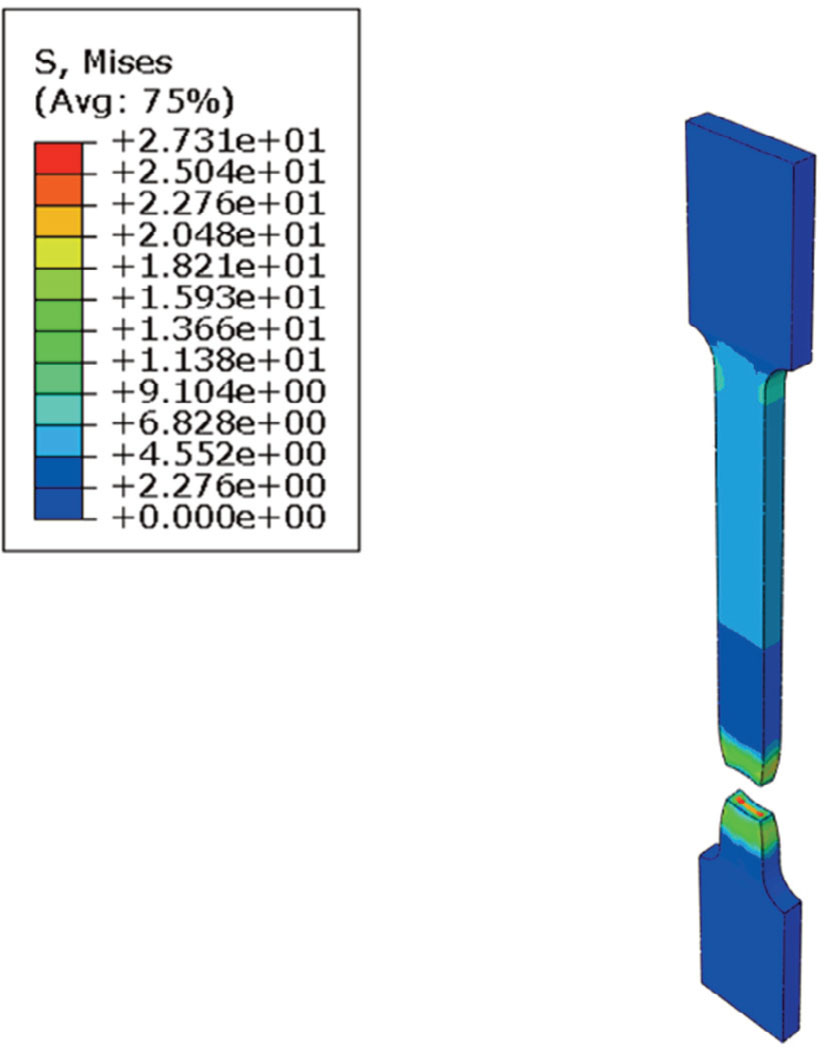
Fig. 8.
Finite element prediction of von Mises stress field and fracture at σnom,max for solid specimen. (Source: authors’ own work)
The pronounced angle-dependence of σnom,max can be attributed to the varying stress concentration factor (SCF) associated with the different aperture orientations. At low angles (0°–15°), the aperture pair creates a narrow ligament perpendicular to the loading direction, resulting in a high SCF and premature failure. As the angle increases, the apertures become increasingly staggered along the loading direction, effectively distributing the load over a wider region and reducing the peak stress at the hole boundaries. At angles approaching and exceeding 90°, the two apertures are nearly aligned along the loading direction, and the inter-hole ligament is oriented favorably for load transfer, minimizing the stress concentration effect.
The observation that the 105° configuration slightly exceeds the σnom,max of the solid specimens is noteworthy. One plausible explanation is that, at this extreme aperture angle, the inter-hole ligament becomes oriented nearly parallel to the loading direction, allowing a larger proportion of the ±45° rasters to carry the applied load along their fiber axis rather than across the inter-raster bond interfaces. This may result in a marginal increase in the apparent tensile strength. Nevertheless, this finding should be interpreted with caution, given the relatively small magnitude of the observed difference (approximately 2.7%) and the inherent scatter present in the experimental data (Mazarbhuiya & Veeman, 2026).
The angle dependence of σnom,max can be interpreted as the superposition of three mechanisms. The first and dominant mechanism is the rotation of the principal stress-concentration zones around each individual perforation: at θ = 0° the two zones are aligned transverse to the load and merge across the narrow inter-hole ligament, producing a high local stress that triggers premature failure; as θ increases, the two stress-concentration zones rotate and decouple, the inter-hole ligament becomes oblique and finally aligned with the load axis, and the peak local stress decreases. The second mechanism is the change in the inter-hole ligament width and orientation: at small angles the ligament is narrow and transverse, which produces a quasi-shear failure path, whereas at large angles the ligament is wide and aligned with the load, and the failure path migrates onto an inclined band connecting the two holes. The third, secondary mechanism is the interaction between the rotated stress field and the ±45° raster pattern of the FDM material: when the inter-hole ligament is oriented along the loading direction, a larger fraction of the rasters carries the load along their fiber axis rather than across the inter-raster bond planes, which marginally raises the apparent strength. This combined mechanism is consistent with the analytical SCF rotation reported by Mohan et al. (2019) for two-hole tensile plates and with the open-hole FDM-PLA results of Khosravani & Reinicke (2022) and of Zabihollah et al. (2024). The net-section analysis in Section 3.3 corroborates this interpretation directly: in the one-hole-cut regime, where the minimum cross-section Anet/A0 = 0.800 is identical for the six configurations between 30° and 105°, σnet,max increases from 30.16 MPa at 45° to 34.98 MPa at 105°, an angular variation of approximately 16% – which cannot be attributed to load-bearing-area effects and therefore quantifies, as such, the reduction of stress-concentration severity with increasing aperture angle.
From a structural-design standpoint, the angle-resolved σnom,max curve obtained here provides direct guidance for several recurring engineering scenarios in which paired apertures of variable inclination occur in FDM-printed PLA components: (i) bolted lap or single-shear connections, where the bolt-row line is rarely strictly transverse to the load; (ii) lightening holes in lattice frames and brackets, where stagger angles are dictated by stiffness or weight constraints; and (iii) cable, fluid, or fastener pass-throughs in printed enclosures and supports. In all three scenarios, the present results suggest that aperture orientations of 60° or above relative to the transverse axis preserve at least 95% of the solid σnom,max, whereas orientations between 0° and 30° lead to apparent-strength reductions of 9–18% and must be avoided wherever possible. These quantitative thresholds, combined with the von Mises contour maps of Fig. 9, are intended to support the early-stage geometric design of perforated FDM-PLA parts before a full finite-element analysis is undertaken.
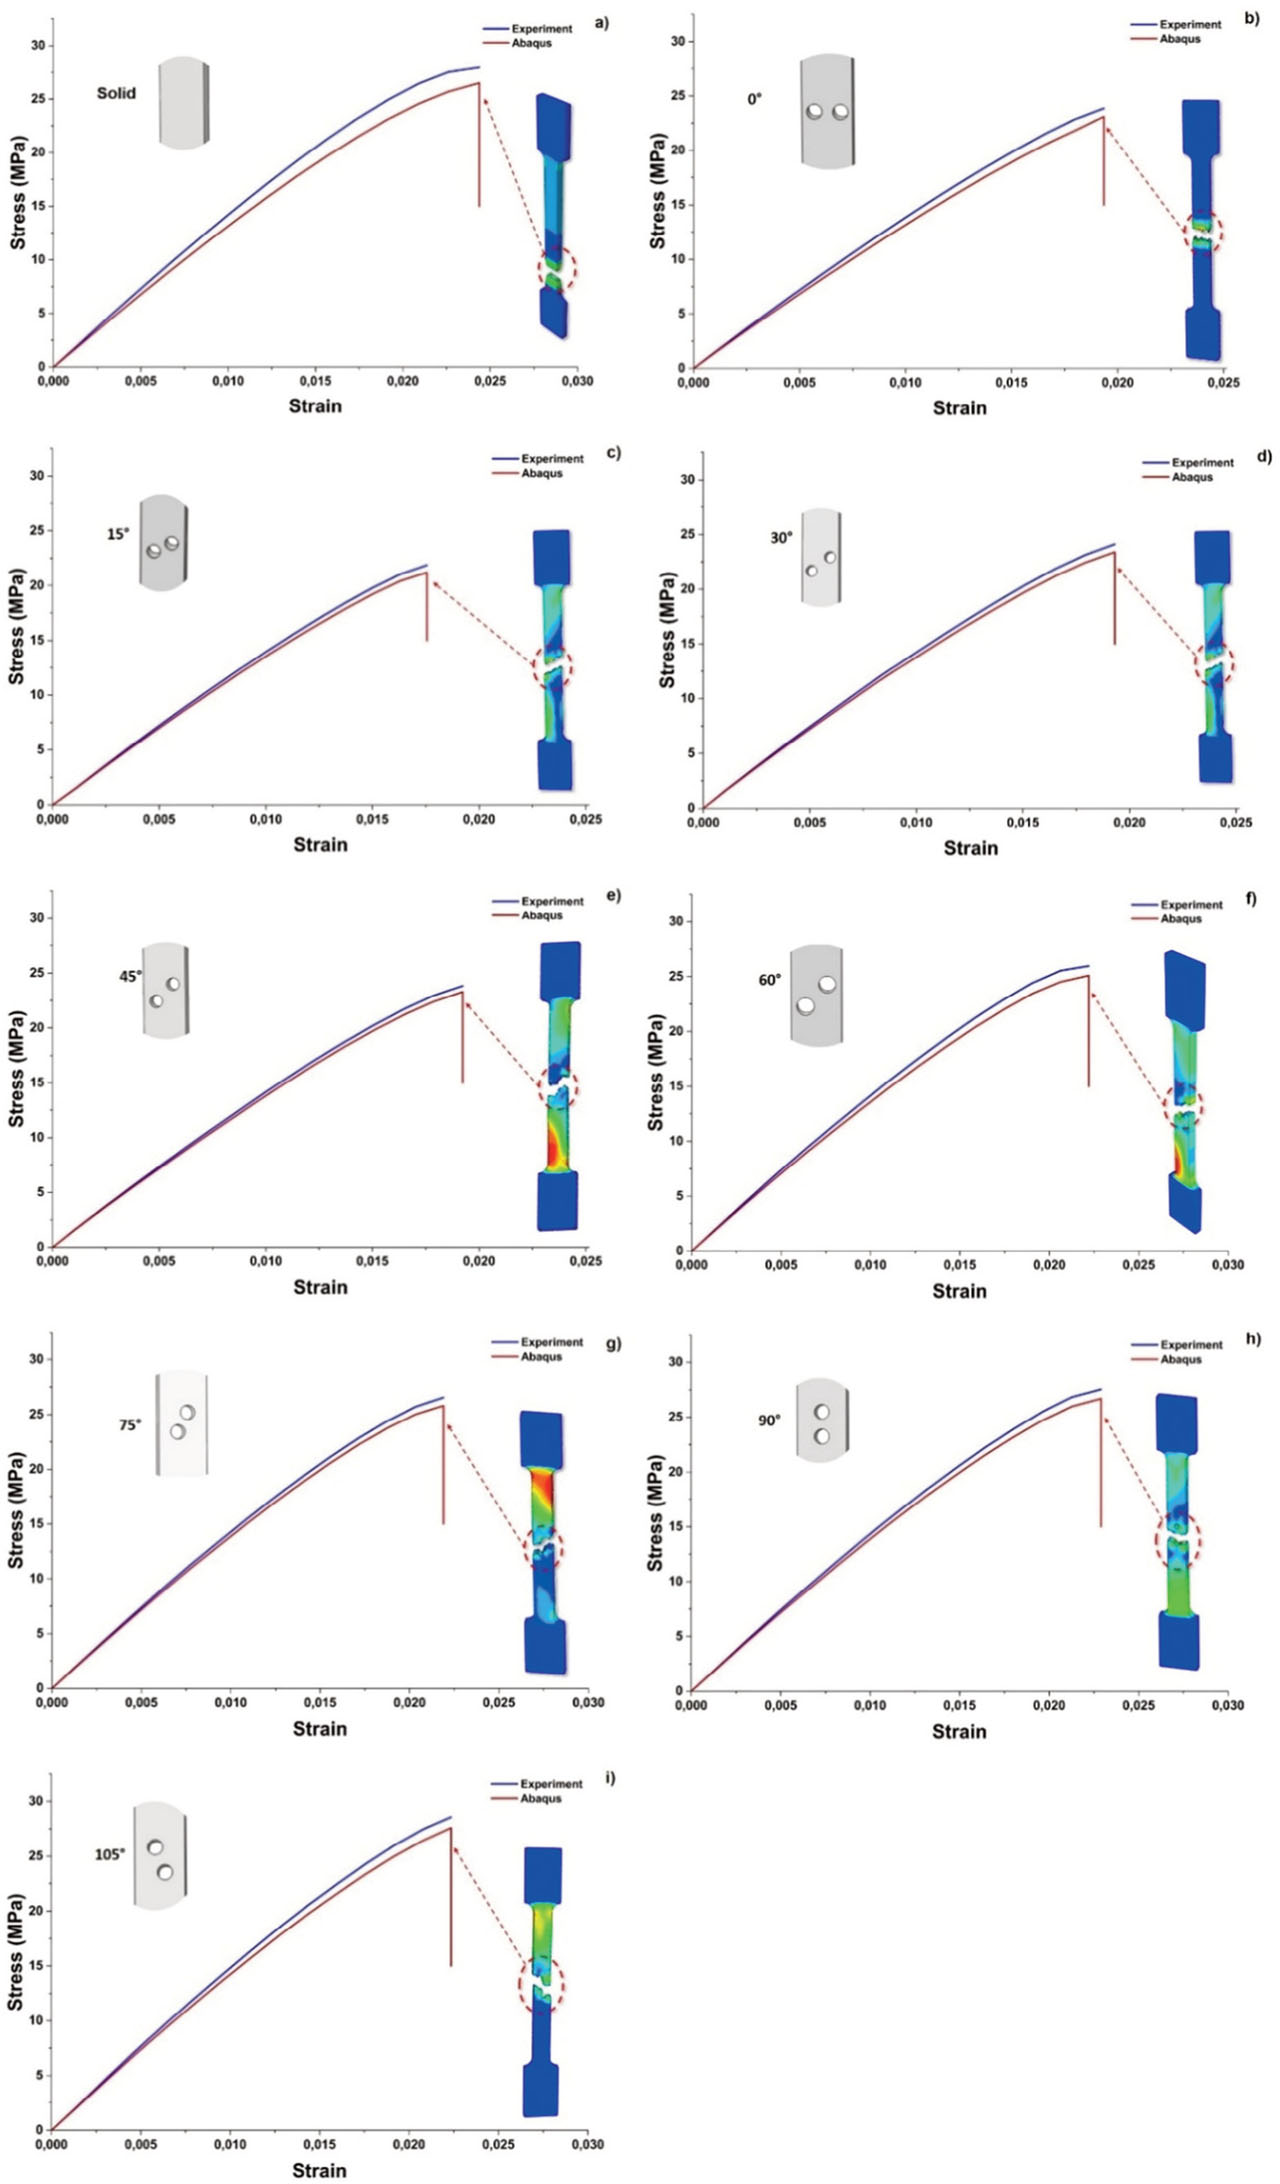
Fig. 9.
Comparison of experimental and FEA stress–strain curves for representative specimens: (a) Solid, (b) 0°, (c) 15°, (d) 30°, (e) 45°, (f) 60°, (g) 75°, (h) 90°, (i) 105°. (Source: authors’ own work).
Figure 7 presents the effect of aperture angle on the apparent tensile response of FDM 3D-printed PLA specimens. Plot (a) shows the relationship between σnom,max and Eapp for all 27 tested specimens. σnom,max = FMax/A0 where FMax is the maximum applied load and A0 = b · h = 40 mm2 is the unperforated gauge cross-sectional area, which is identical for all specimens. Eapp was determined from the initial linear portion of the stress–strain response. Plot (b) illustrates the mean σnom,max as a function of aperture angle, with the solid-specimen baseline indicated by the horizontal dashed line. The results show that the introduction of perforations generally reduces the nominal tensile strength, particularly at lower aperture angles. The minimum mean nominal strength occurs near 15°, after which the strength progressively recovers as the aperture angle increases, eventually approaching or slightly exceeding the solid-specimen baseline at 90° and 105°.
Plot (c) quantifies this trend by presenting the percentage reduction in σnom,max relative to the solid configuration. The largest reduction, approximately 18.3%, is observed at 15°, while the reductions become progressively smaller at larger angles. At 90° and 105°, slight increases relative to the solid specimen are observed, corresponding to negative percentage reductions.
Plot (d) presents the mean Eapp as a function of aperture angle. In contrast to the tensile strength results, the modulus remains relatively constant across all aperture angles, indicating that the perforation orientation has minimal influence on the elastic stiffness of the specimens. Error bars in plots (b)–(e) represent one standard deviation across the three replicates in each group. Plot (e) shows the mean σnet,max, calculated using σnet,max = FMax /Anet(θ) where Anet(θ) is the minimum net cross-sectional area intersecting the perforations. The figure also identifies the critical aperture angle, θc = arcsin (2R/d) =23.58° which separates two distinct geometric regimes. For θ < θc, the minimum-section plane intersects both holes (two-hole-cut regime), whereas for θ ≥ θc, only one hole is intersected (one-hole-cut regime), resulting in a constant normalized net area ratio of Anet/A0 = 0.8. The shaded yellow region in plot (e) highlights this one-hole-cut regime. The net-section stress increases with aperture angle, indicating that stress concentration effects become less severe as the perforation orientation changes toward larger angles.
3.6. Finite element analysis validation
The finite element analysis (FEA) results show good agreement with the experimental engineering stress–strain curves. The simulations successfully capture the increase in ductility with increasing aperture angle, accurately reproducing the experimental failure strains in the range of 0.025–0.030 for the high-angle configurations. The improved correlation at higher aperture angles can be attributed to the more gradual and distributed stress concentration, which is better represented by the adopted continuum elastic–plastic modelling framework.
105° configuration (Fig. 9i): Very good agreement is observed between the experimental and numerical results. The FEA accurately reproduces the highest nominal maximum stress σnom,max among the perforated configurations (27.98 ± 1.01 MPa), which slightly exceeds that of the solid baseline specimen (27.23 ± 1.50 MPa). A minor deviation is observed near the peak stress region, where the simulation slightly underestimates the experimental σnom,max. Nevertheless, the overall shape of the stress–strain curve, including the extended plastic plateau, is reproduced well.
Across all nine configurations, the most consistent agreement between the FEA and experimental results is observed in the elastic region, which is expected given that the elastic properties were directly calibrated from the experimental data. The agreement in the plastic region is also satisfactory, indicating that the tabulated true stress–plastic strain data provide an adequate description of the strain-hardening behavior. The primary discrepancies occur in the post-peak softening regime, where the FEA consistently predicts a more abrupt failure than is observed experimentally. This is a well-known limitation of continuum elastic–plastic models with element-deletion damage, which do not resolve raster anisotropy, inter-layer interfaces, or the diffuse fracture mechanisms typical of FDM-printed PLA, as discussed in Section 3.7.
The FEA deformation contours (shown as insets in Fig. 9) reveal the evolution of the von Mises stress distribution at the point of maximum load. For the 0° configuration, the stress concentration is localized in the narrow ligament between the two holes, consistent with a transverse fracture path. As the aperture angle increases, the high-stress region progressively shifts and becomes more distributed around the hole peripheries, ultimately forming an inclined band connecting the two apertures. These observations provide a direct mechanistic explanation for the angle-dependent σnom,max trends documented in Section 3.2 and corroborate the net-section analysis of Section 3.3, in which the monotonic rise of σnet,max from 30.16 MPa at 45° to 34.98 MPa at 105° in the one-hole-cut regime quantifies the reduction of stress-concentration severity with increasing aperture angle.
σnom,1, σnom,2 and σnom,3 in Table 2 are the maximum gross-section nominal stresses (= Fmax / A0) of the three replicate specimens, with A0 = b·h = 40 mm2 identical for all configurations. Anet(θ)/A0 is the ratio of the minimum net cross-section to A0, computed from Eqs. (4a)–(4b) for R = 1 mm and d = 5 mm; the threshold angle θc = arcsin(2R/d) ≈ 23.58° governs whether the minimum-section plane cuts through both holes (two-hole-cut regime) or through only one of them (one-hole-cut regime). Note that all eight perforated configurations contain two holes; the regime distinction is geometric and not a difference in specimen design. The mean σnet,max value is the group-mean of Fmax / Anet(θ); its standard deviation is propagated from the σnom replicate scatter. „% red. on σnom” denotes the percentage reduction of mean σnom,max relative to the solid-specimen baseline of 27.23 MPa.
Eapp is extracted by linear regression of the gross-section nominal stress σnom on engineering strain over the 5–40% σnom,max range; the coefficient of determination of the regression exceeds 0.999 for every specimen. The apparent modulus Eapp is a structural property of the perforated configuration and is not corrected for the variable net cross-section.
Recent experimental studies further support the trends observed in the present work. Zabihollah et al. (2024) systematically investigated the tensile stress concentration behavior of FDM-printed PLA specimens containing geometric discontinuities and demonstrated that hole diameter, fillet radius, and infill density play a dominant role in governing both tensile strength and stress concentration factors. Their results confirmed that stress concentration effects in additively manufactured PLA deviate from classical isotropic assumptions and are strongly coupled with printing-induced mesostructure, which is consistent with the reduced load-carrying capacity and localized strain amplification observed in the present study.
Similarly, Seifollahi and Kabir (2025) examined the combined influence of build orientation and geometric notches on the static and fatigue performance of FDM-fabricated PLA components. Their findings revealed that central holes induce higher stress concentration and more severe damage evolution compared to edge notches, leading to premature failure under both monotonic and cyclic loading. Moreover, their Digital Image Correlation (DIC) analysis highlighted the interaction between inherent micro-voids and geometric discontinuities as a key mechanism controlling damage initiation and propagation. These observations are in close agreement with the damage localization patterns and strength degradation mechanisms identified in the current investigation, thereby reinforcing the validity of the proposed experimental–numerical framework.
3.7. Limitations
The present comparative investigation is bounded by the following methodological limits, which the reader should keep in mind when extrapolating the results.
(i) Material and printer scope. Only one PLA filament (white PLA, 1.75 mm) and one printer (Anycubic i3 Mega X) were used. Transferability of the absolute σnom,max values to other filament batches, printers, or environmental conditions requires additional testing.
(ii) Single set of process parameters. Layer height (0.20 mm), nozzle temperature (200°C), bed temperature (60°C), raster pattern (±45°), infill density (100%) and print speed (50 mm/s) were held constant. The angle–strength relationship may shift quantitatively if any of these parameters is varied; the qualitative shape of the curve is, however, expected to persist as long as the material remains macroscopically homogeneous.
(iii) Replicate count. Three specimens per condition are appropriate for trend identification but insufficient for a rigorous Weibull statistical treatment of the strength distribution. A probabilistic analysis with a larger replicate count is left for future work.
(iv) Geometry scope. Only paired through-thickness circular holes of equal radius R = 1 mm and fixed inter-center distance d = 5 mm were studied. One-hole, multi-hole, elliptical-hole, and through-edge notch patterns, as well as variations of the d/R ratio that would shift the threshold angle θc = arcsin(2R/d) and therefore the boundary between the two-hole-cut and one-hole-cut regimes, were not included.
(v) Loading scope. Only quasi-static monotonic uniaxial tension was applied. Cyclic, fatigue, biaxial, and creep responses, although directly relevant to aerospace applications, are outside the scope of the present study.
(vi) Modelling assumptions. The Abaqus model uses an isotropic elastic–plastic continuum law with ductile damage initiation and displacement-based damage evolution; it does not resolve raster orientation, inter-layer interfaces, or process-induced residual stresses. The post-peak softening regime is therefore captured only approximately, and the model systematically predicts a more abrupt failure than is observed experimentally.
4. CONCLUSIONS
This study has examined how the angular orientation of paired through-thickness apertures affects the comparative tensile response of FDM-printed PLA, by combining quasi-static uniaxial tensile testing of 27 specimens with three-dimensional finite-element simulation in Abaqus. To eliminate the ambiguity that affects strength reporting on perforated specimens, all stresses are referred either to the unperforated gross gauge cross-section A0 (giving the apparent strength σnom,max) or to the analytically computed minimum net cross-section Anet(θ) (giving σnet,max), and the elastic response is reported as an apparent Young’s modulus Eapp. Although every perforated specimen contains two holes, the geometry (R = 1 mm, d = 5 mm) introduces a threshold angle θc = arcsin(2R/d) ≈ 23.58° that determines whether the minimum-section plane cuts through both holes simultaneously (two-hole-cut regime, θ < θc) or through one hole only (one-hole-cut regime, θ ≥ θc, with Anet/A0 = 0.800). Within this framework, the principal findings are the following:
The aperture angle exerts a pronounced and systematic influence on σnom,max. Relative to the solid baseline (27.23 ± 1.50 MPa), σnom,max decreases by up to 18.3% at θ = 15° and recovers progressively with increasing θ, returning to and slightly exceeding the solid value at 90°–105°. The 0° and 15° orientations are the most mechanically detrimental and should be avoided in load-bearing designs; orientations of θ ≥ 60° preserve at least 95% of the solid σnom,max.
In the one-hole-cut regime (θ ∈ {30°, 45°, 60°, 75°, 90°, 105°}), where the minimum load-bearing cross-section is identical across the six configurations even though every specimen contains two holes, σnet,max rises from 30.16 MPa at 45° to 34.98 MPa at 105°, an angular variation of approximately 16% that isolates the genuine physical effect of the present study: the rotation of the stress-concentration field and the reorientation of the inter-hole ligament, which together control the failure path and that cannot be attributed to load-bearing-area effects.
The apparent Young’s modulus Eapp is essentially insensitive to the aperture angle (overall mean 1444.02 ± 37.53 MPa), confirming that the geometric discontinuity affects the post-yield and failure regimes rather than the elastic stiffness of the perforated configuration.
The Abaqus finite-element model, calibrated from the experimental σ–ε curves, reproduces the measured response across all nine configurations with good fidelity in the elastic and early plastic regions; the von Mises contour maps provide a coherent mechanistic explanation of the angular trend in terms of the rotation of the high-stress zone and the migration of the failure path from a transverse inter-hole ligament (small θ) to an inclined band connecting the two holes (large θ). Within the continuum elastic–plastic + ductile-damage framework adopted here, post-peak softening remains the area of greatest experimental–numerical mismatch, because the model does not resolve raster anisotropy, inter-layer interfaces, or process-induced residual stresses, and because element-deletion damage produces a sharper softening than the diffuse fracture observed experimentally. These caveats define the natural directions for future work, namely: extension of the parametric space to other hole diameters, inter-hole spacings (notably to vary the threshold angle θc = arcsin(2R/d)), infill patterns, and to biaxial or cyclic loading; a probabilistic (Weibull) treatment with a larger replicate count; and the incorporation of DIC full-field strain mapping for direct experimental validation of the FEA-predicted stress concentrations.