
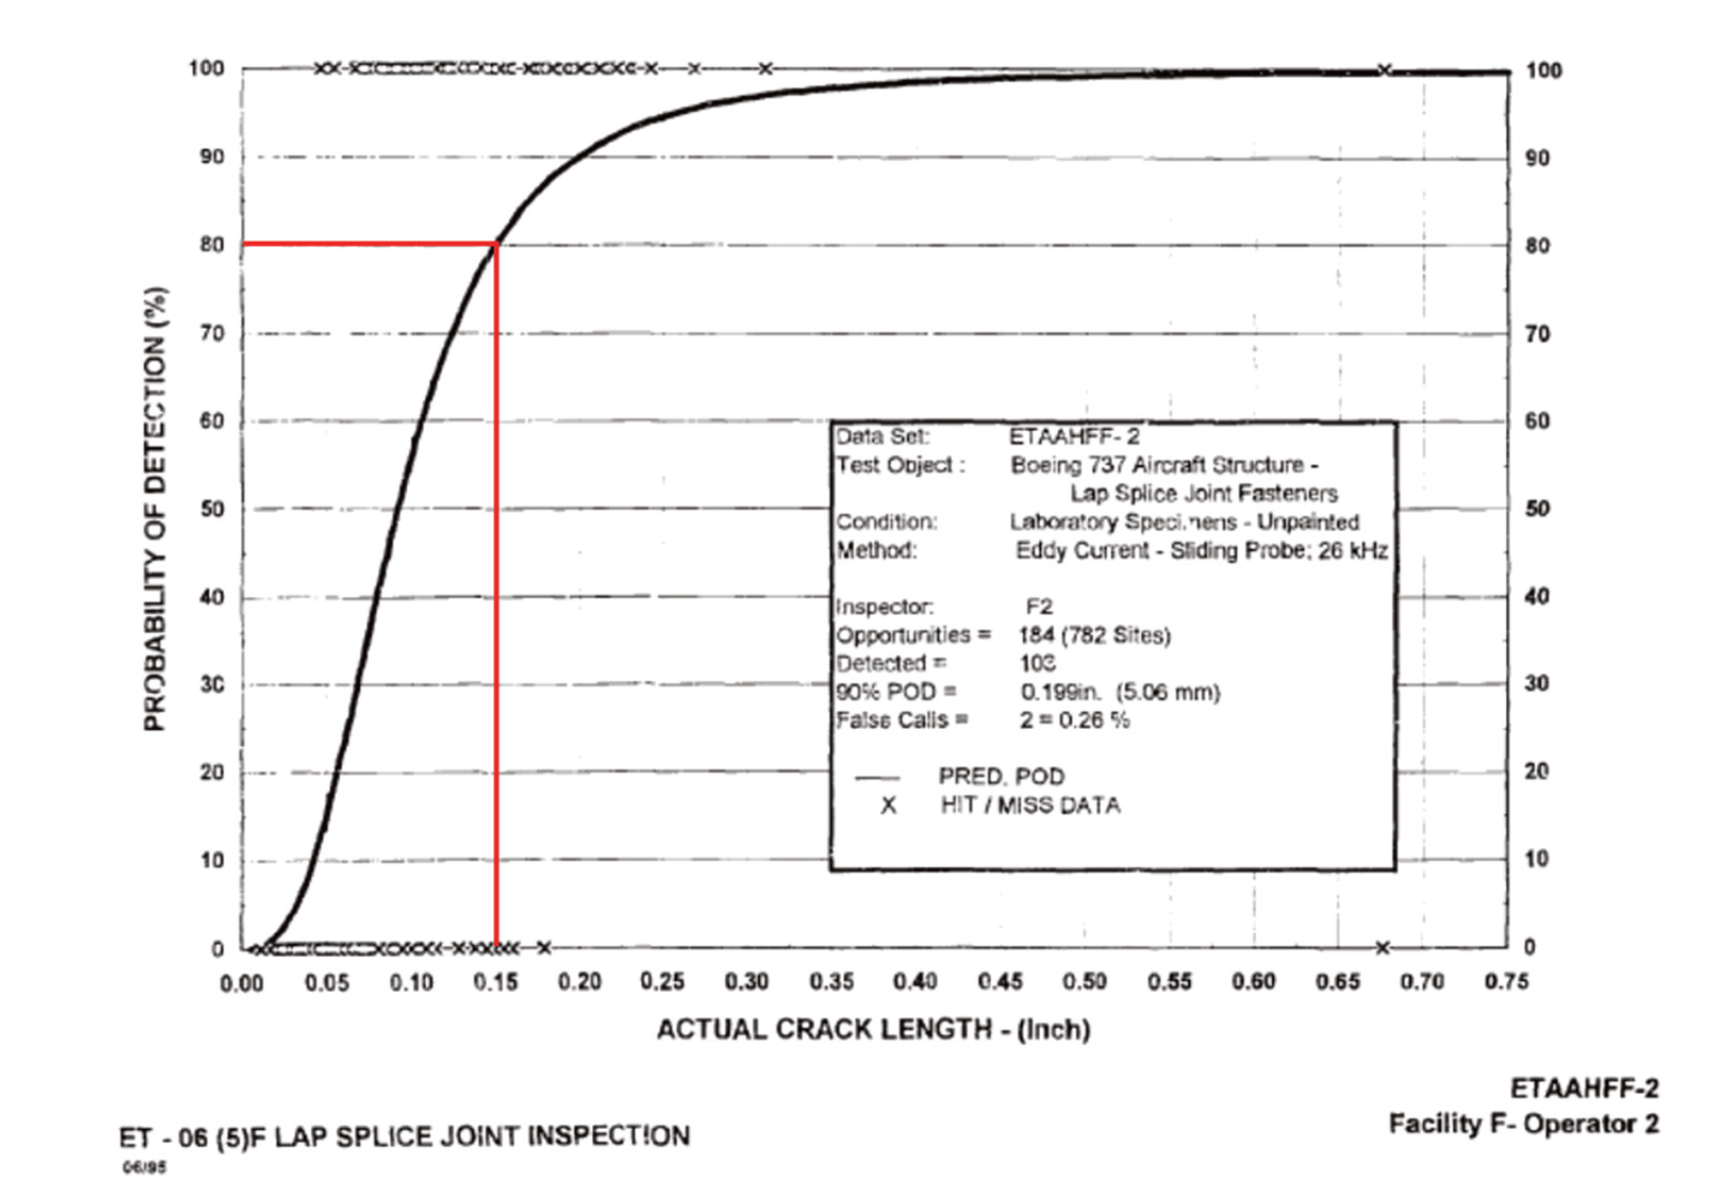
Figure 1.
Sample POD curve for a high-frequency eddy current inspection. (Best available copy, Nondestructive Testing Information Analysis Center, 2000).
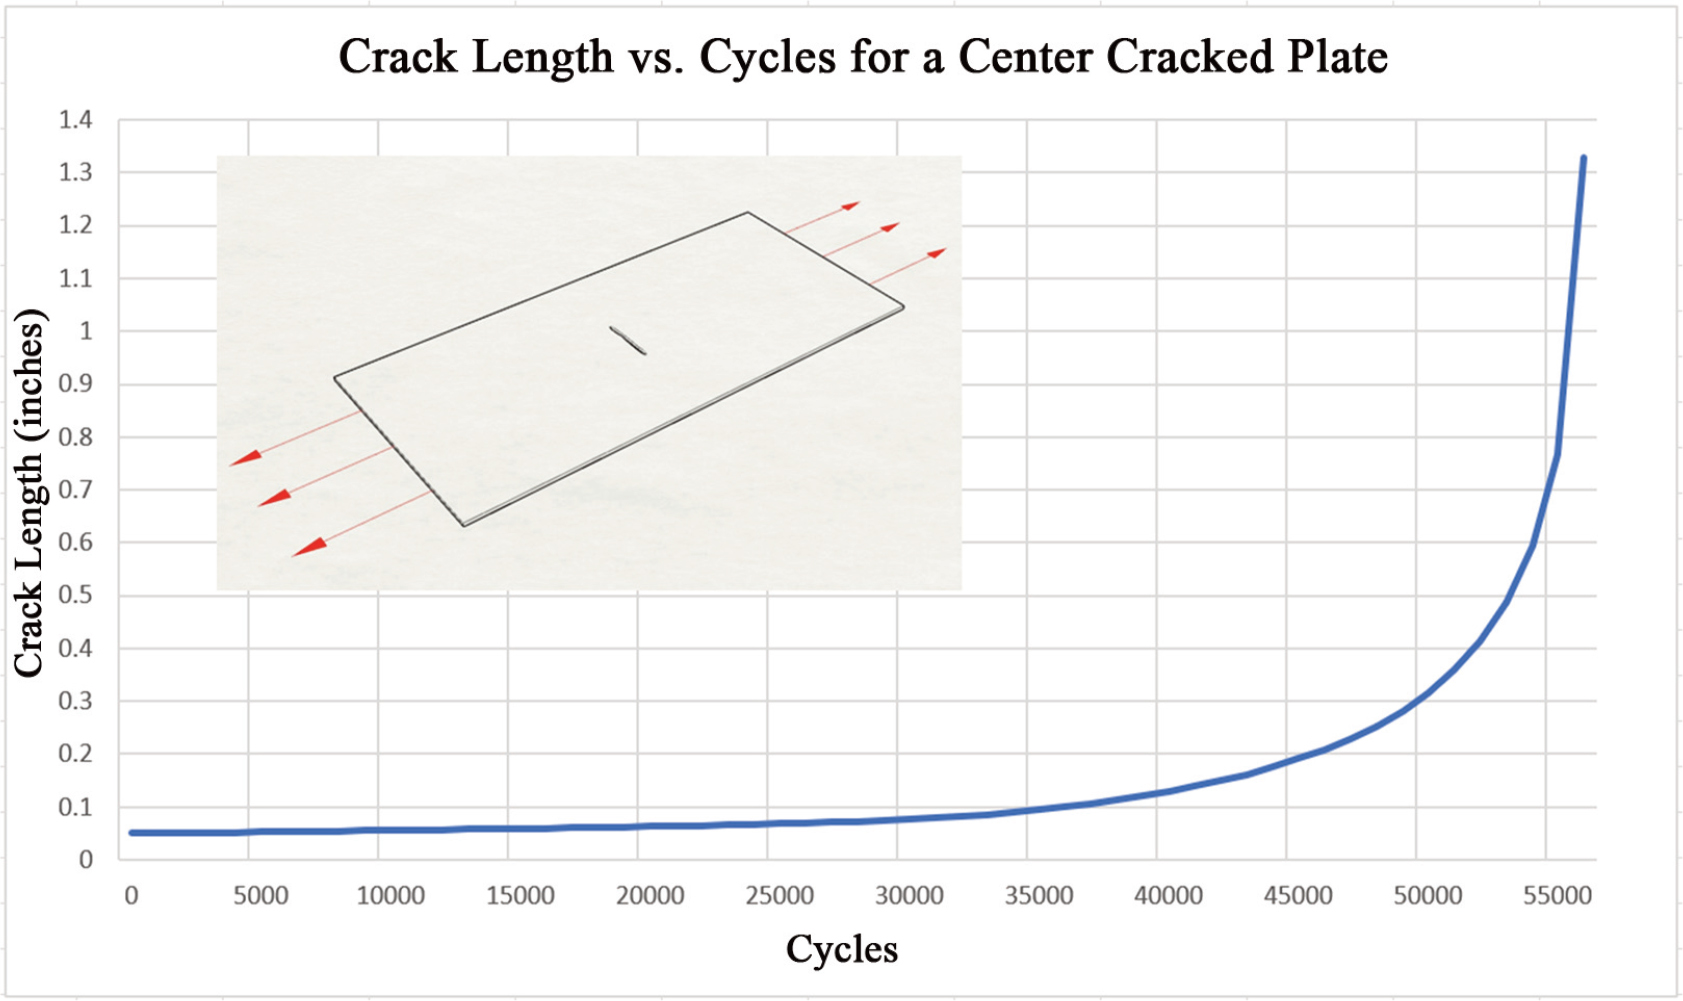
Figure 2.
Cycles vs crack length for a center cracked 2024 T3 Aluminum panel. Data generated by AFGROW Version 4.008.
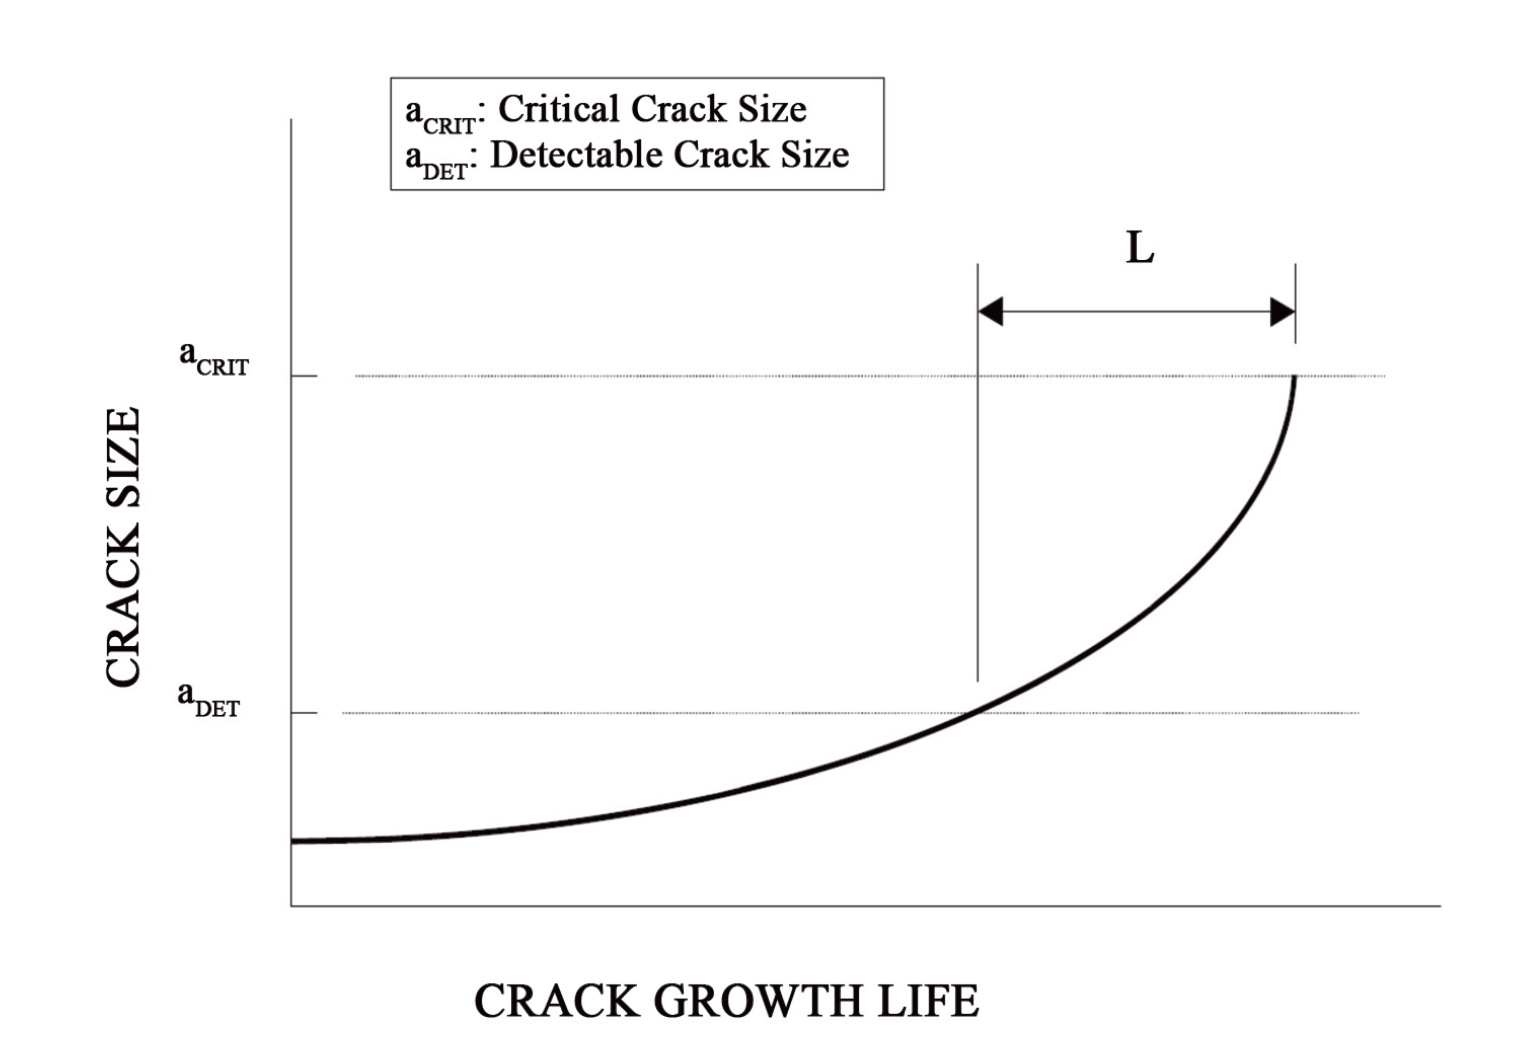
Figure 3.
Crack Growth in a single load path structure and inspection terminology for FAA AC 91-82A (Federal Aviation Administration, 2015).
Table 1.
Baseline case parameters and resulting inspection cycle.
| Baseline Example Summary | |||||
|---|---|---|---|---|---|
| Initial Crack Length0.05 (2,3) | Critical Crack Length1.32 (4) | Total Life 55783 cycles (4) | Threshold Inspection 45000 cycles (5) | Allowable Inspection Interval 10783 cycles (6) | Recurring Inspections 3600 cycles (7) |
[iv] 3. FAA Transport Airplane and Engine Issue Area General Structures Harmonization Working Group Task 5
[v] 4. From AFGROW simulation Figure 2
Table 2.
Comparison of baseline example inspection program to POD based a0 inspection program.
| Comparsion of Baseline Example Inspection to POD based a0 | ||||||
|---|---|---|---|---|---|---|
| Assumed a0 | Initial Crack Length | Critical Crack Length | Total Life | Threshold Inspection | Allowable Inspection Interval | Recurring Inspections |
| Baseline | 0.05 | 1.32 | 55783 cycles | 45000 cycles | 10783 cycles | 3600 cycles |
| With POD | 0.2 | 1.32 | 10783 cycles | 3600 cycles | 10783 cycles | 3600 cycles |
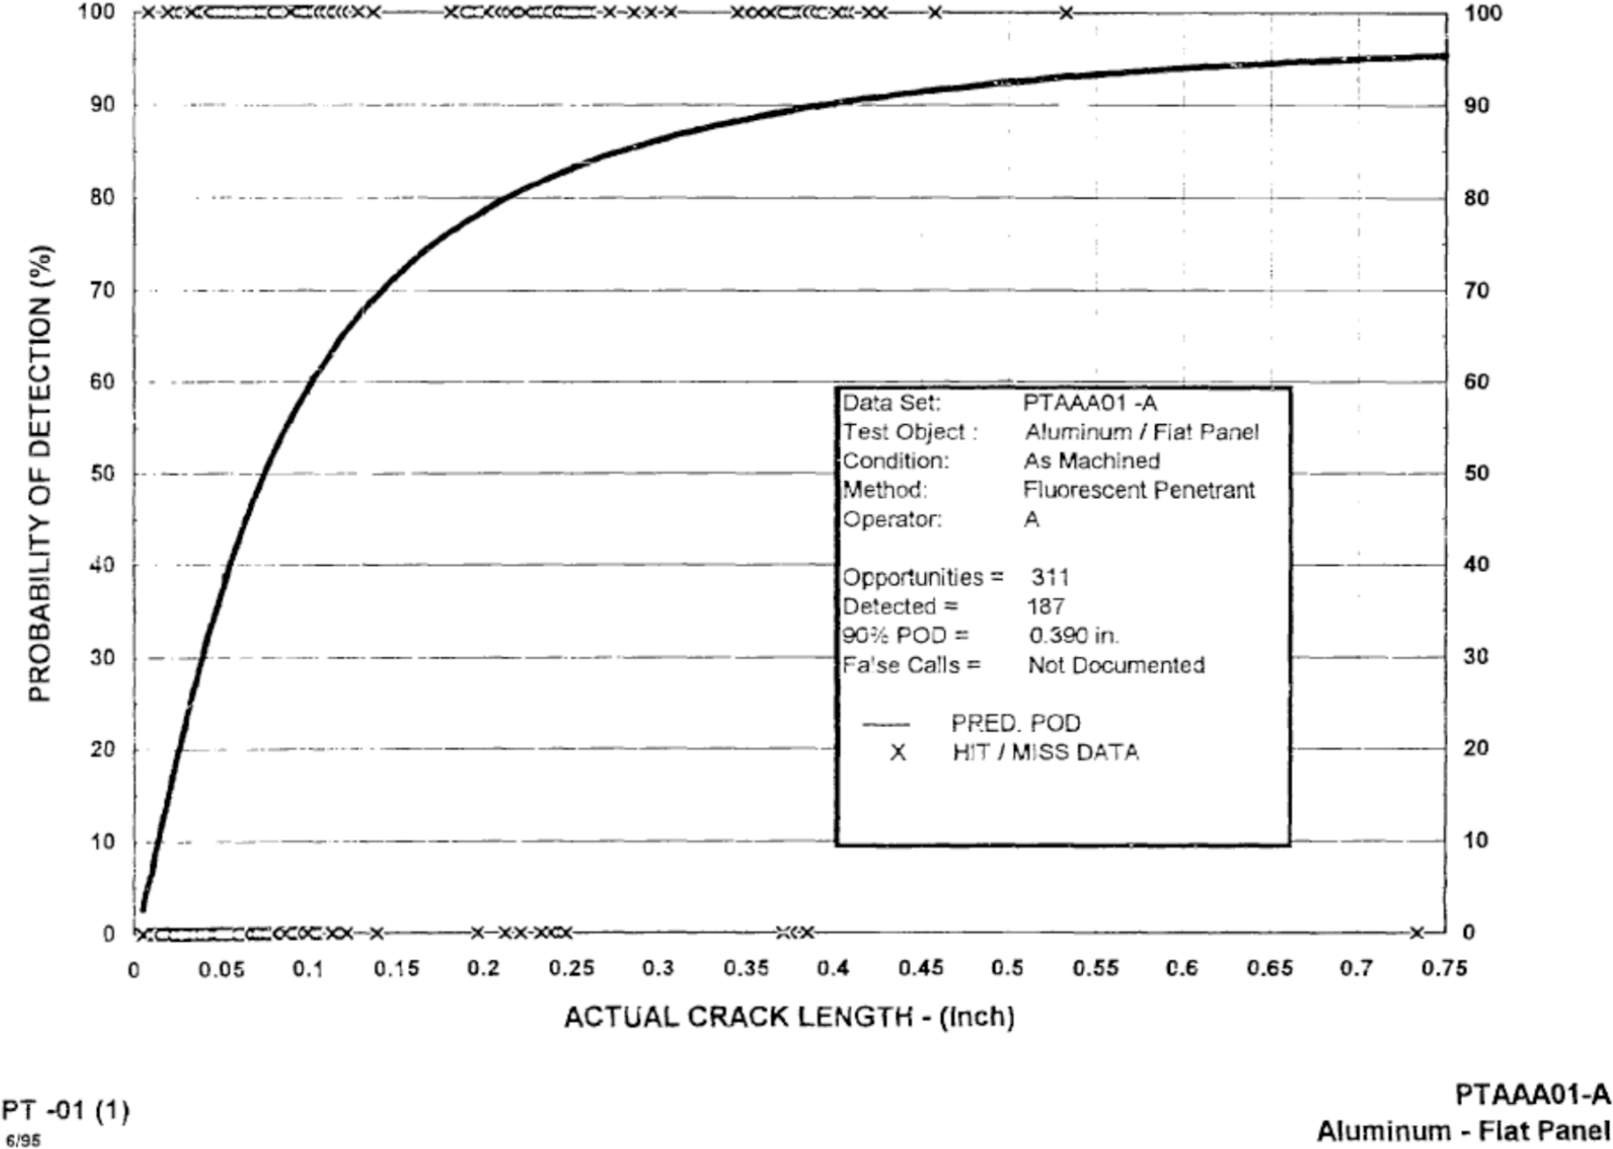
Figure 4.
Sample POD curve for a Fluorescent Penetrant Inspection (Best available copy, Nondestructive Testing Information Analysis Center, 2000).