
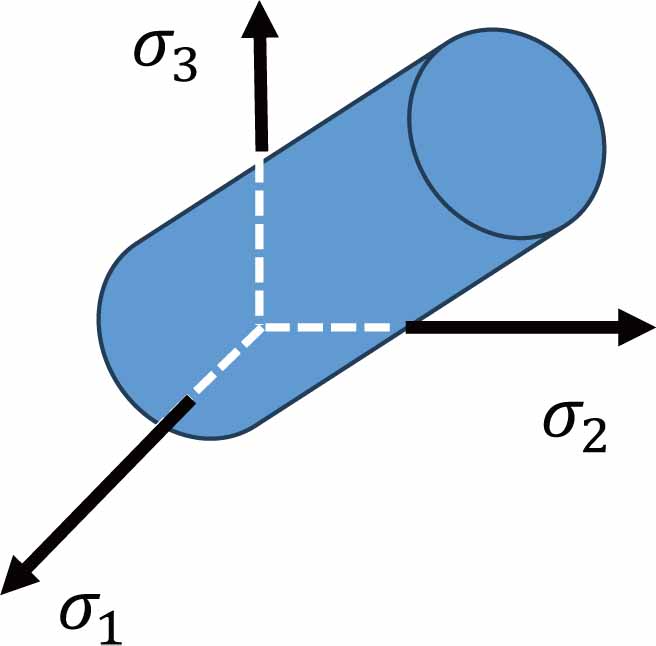
Figure 1.
Limit surface representing critical stress states in the principal stress space.
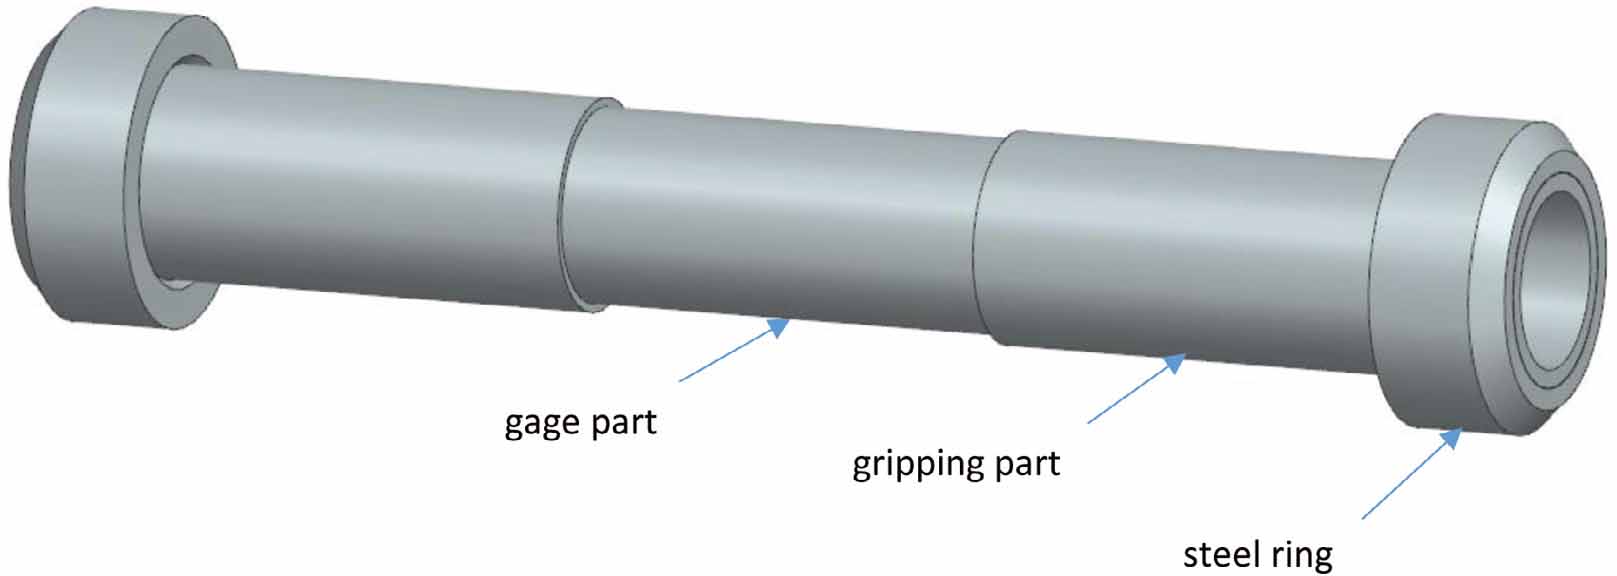
Figure 2.
Tubular specimen.
Table 1.
Mechanical properties of the material in the gage section of the specimen (X – axial direction, Y – circumferential direction).
| Parameter | Value | Factor of scatter CV |
|---|---|---|
| Tensile strength Xt | 684 MPa | 4.41 [%] |
| Tensile strength Yt | 638 MPa | 6.45 [%] |
| Compressive strength Xc | 600 MPa | 4.18 [%] |
| Compressive strength Yc | 638 MPa | 3.41 [%] |
| Shear strength S | 75 MPa | 1.62 [%] |
| Modulus Ex | 54.41 GPa | |
| Modulus Ey | 57.72 GPa | |
| Modulus Gxy | 3.66 GPa | |
| Poisson coefficient v12 | 0.041 [-] |
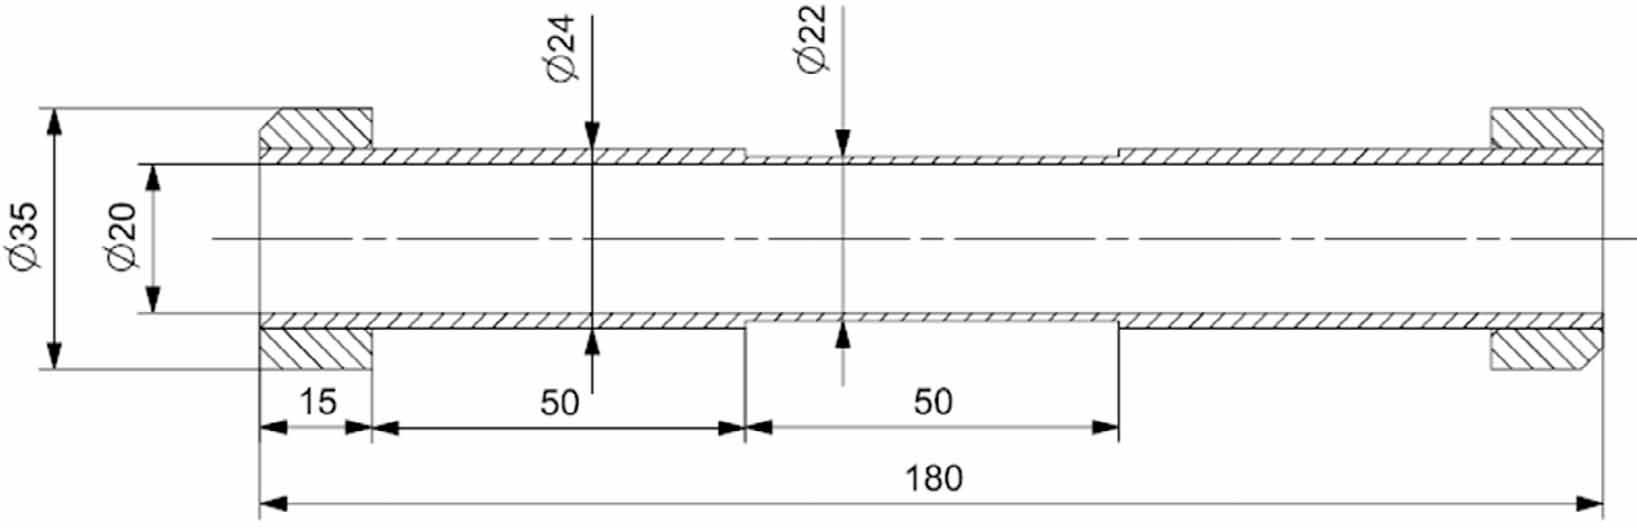
Figure 3.
Dimensions of tubular specimen in mm.
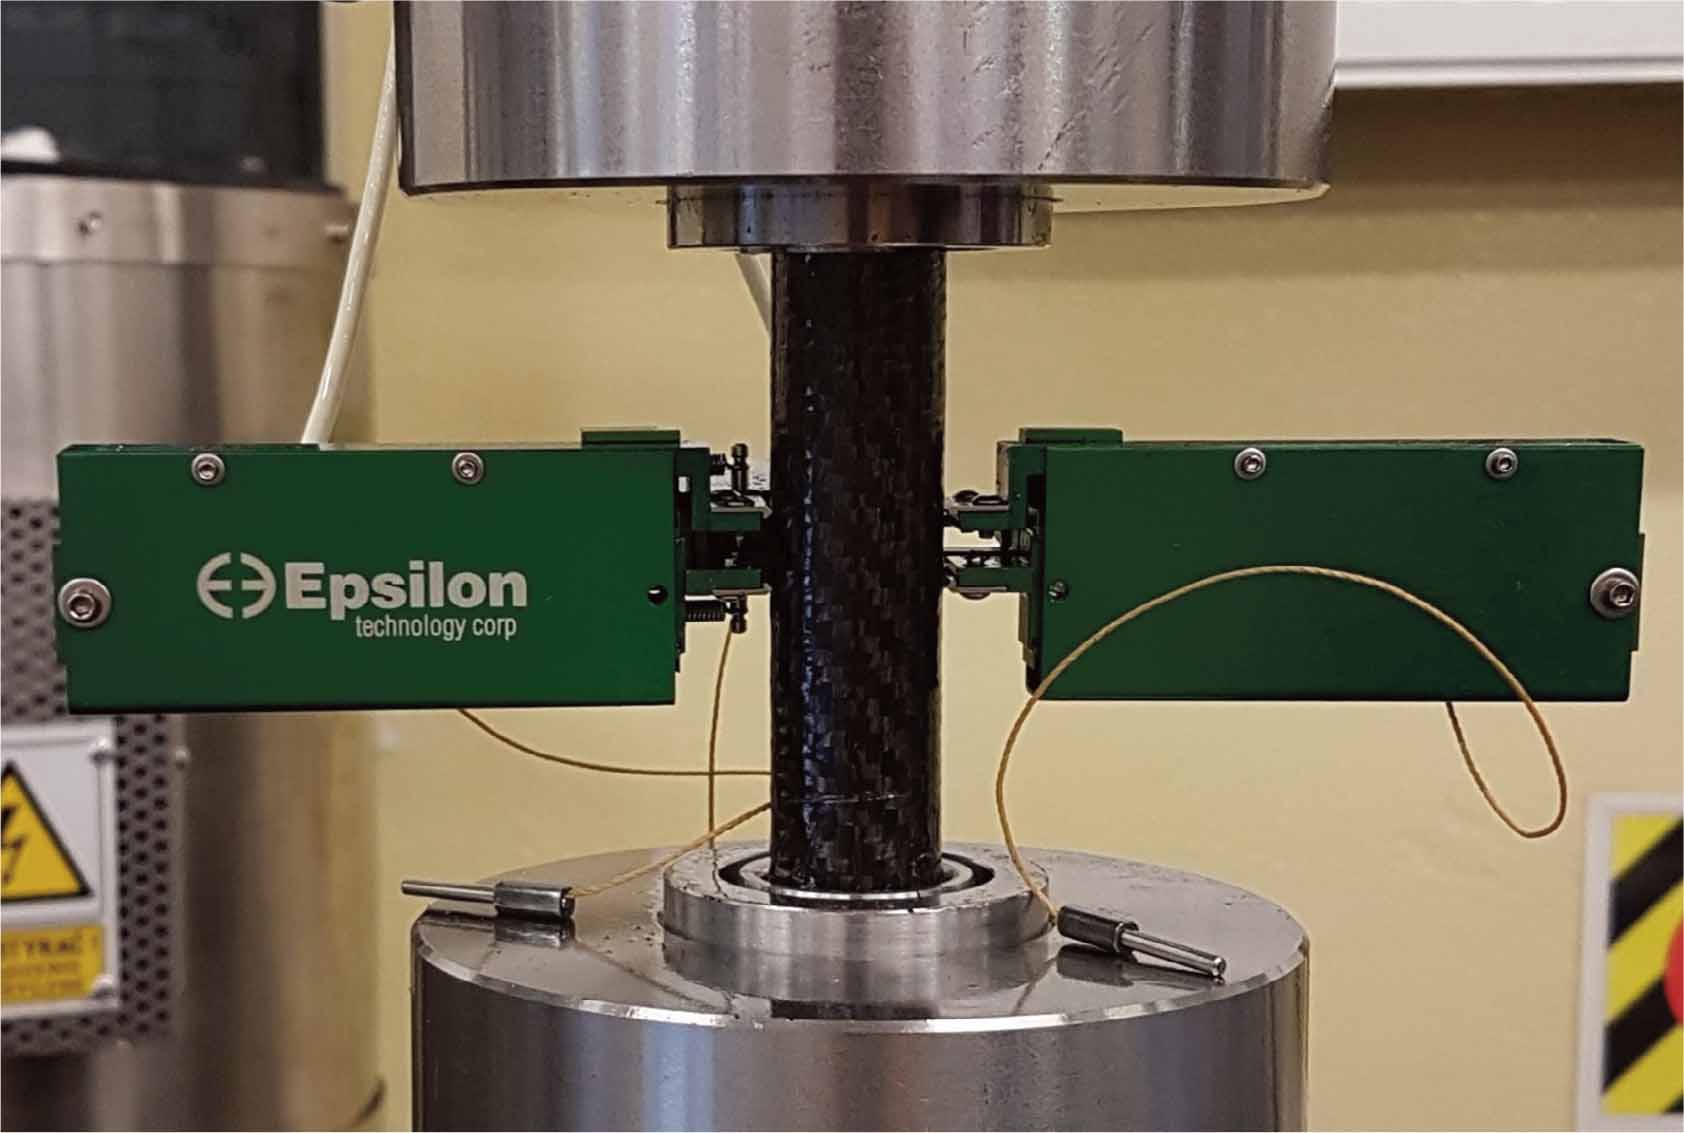
Figure 4.
Biaxial extensometer attached to the gage part of the tubular specimen.
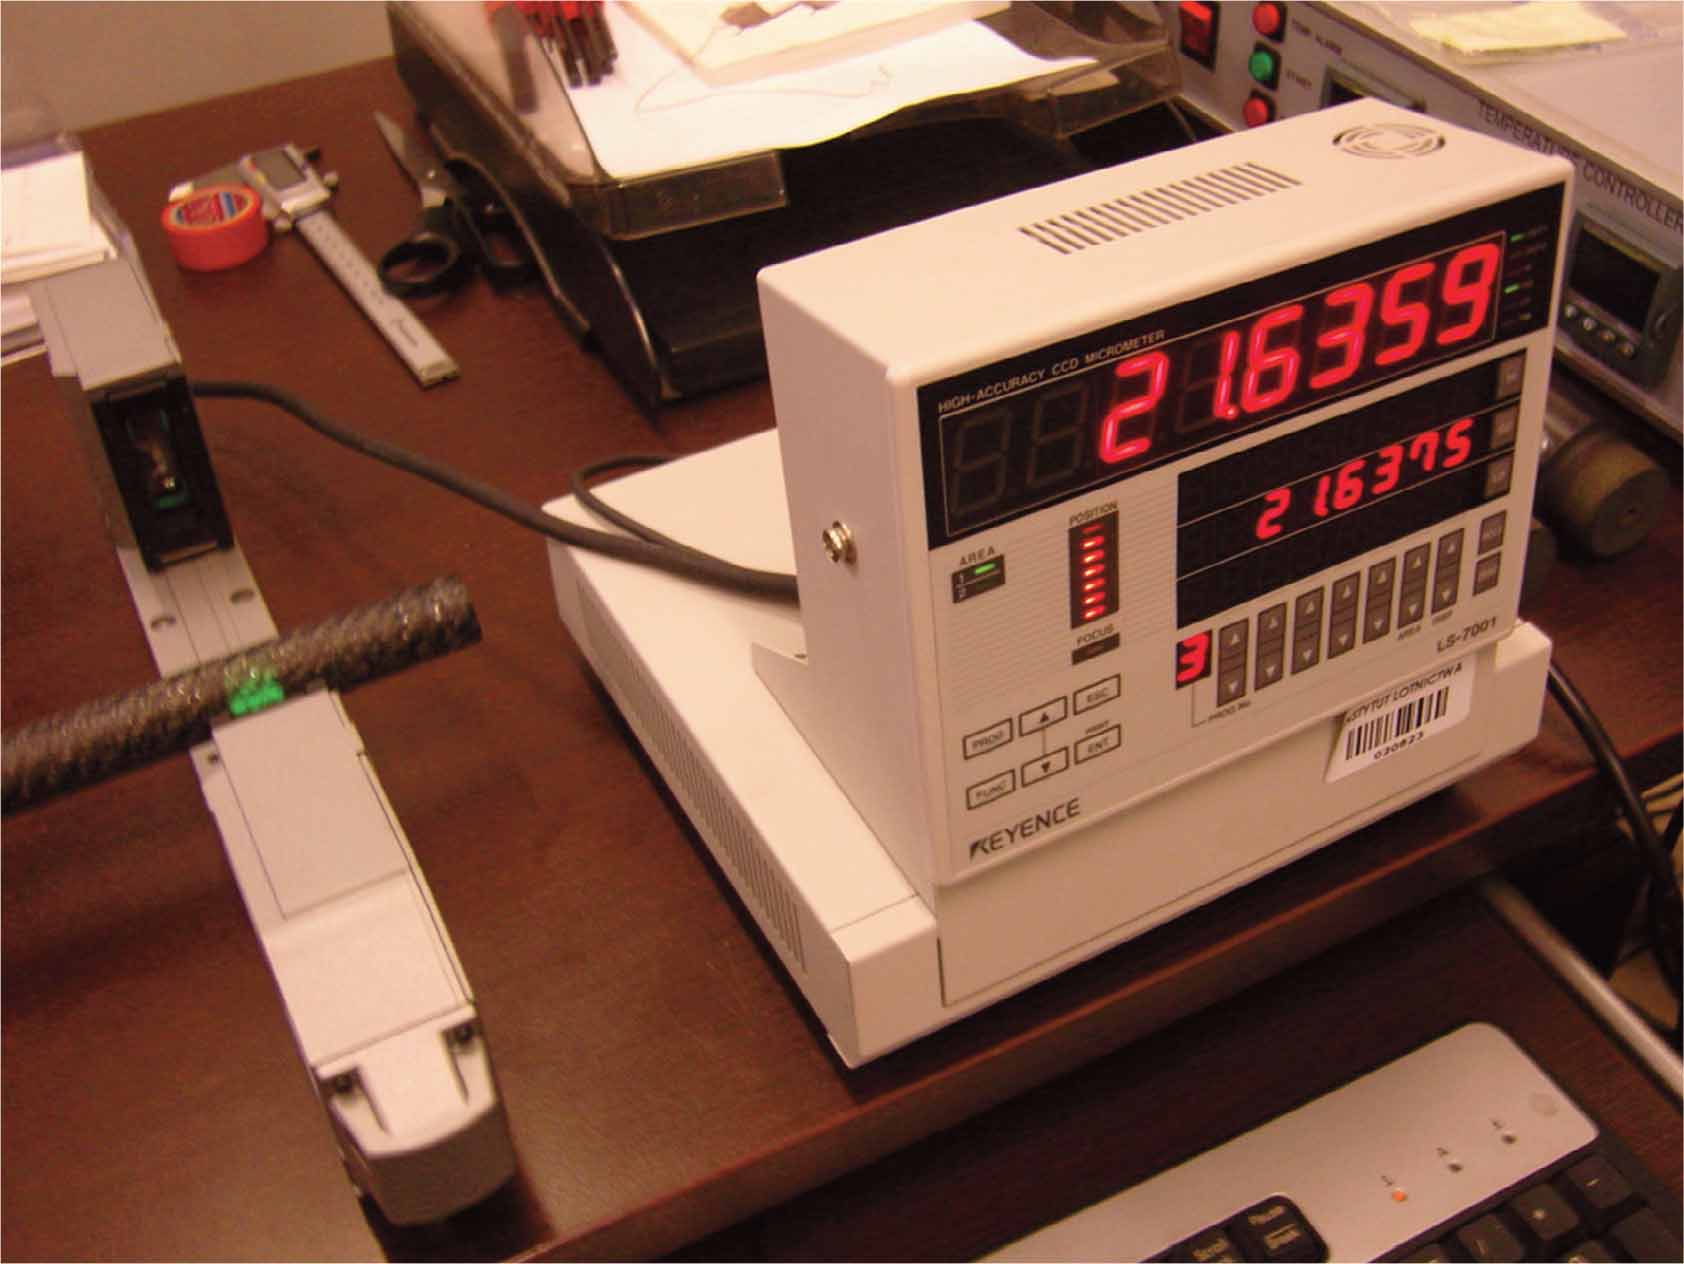
Figure 5.
Contactless digital micrometer KEYENCE LS-7030.
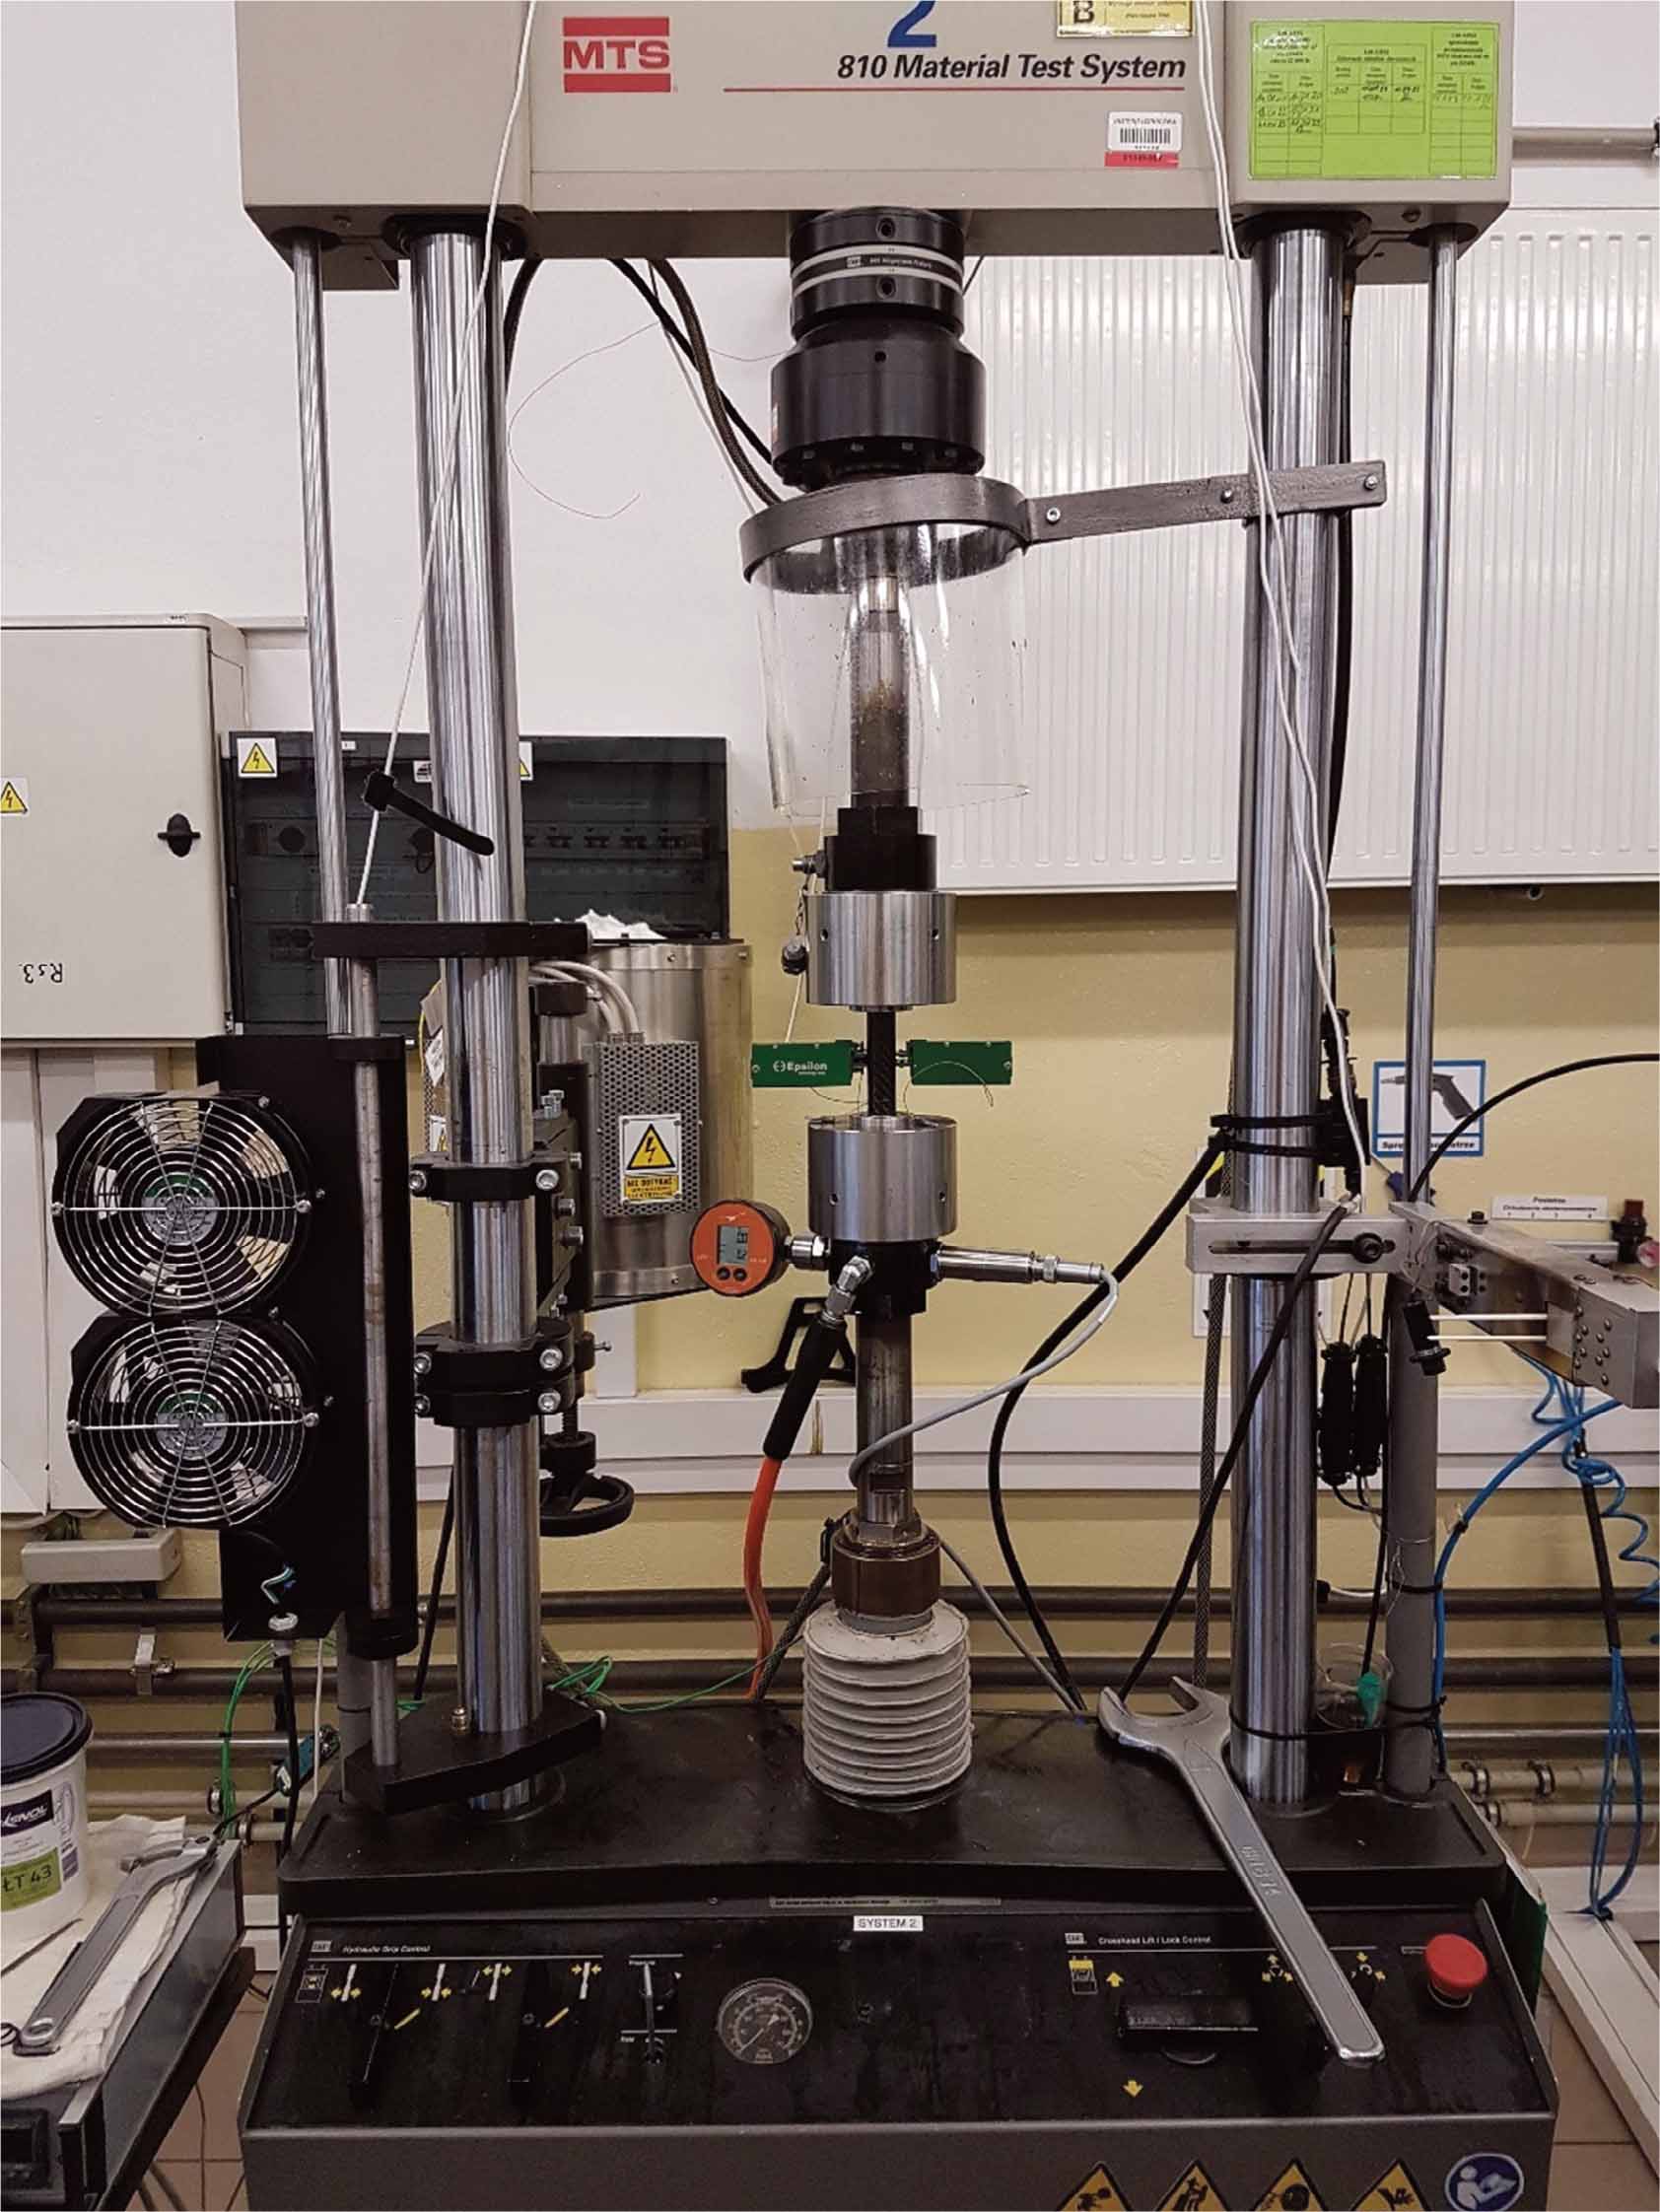
Figure 6.
Experimental setup for complex stress testing.
Table 2.
Loading sequence for all tested specimens.
| Number of test | Loading sequence | End of first ramp | End of second ramp |
|---|---|---|---|
| 1 | tension | specimen failure | n. a. |
| 2 | pressure | specimen failure | n. a. |
| 3 | pressure-tension | 100 bar | specimen failure |
| 4 | pressure-tension | 200 bar | specimen failure |
| 5 | pressure-tension | 300 bar | specimen failure |
| 6 | tension-pressure | 10 kN | puncture of matrix |
| 7 | tension-pressure | 20 kN | puncture of matrix |
| 8 | tension-pressure | 30 kN | puncture of matrix |
| 9 | pressure-tension | 150 bar | specimen failure |
| 10 | simultaneous pressure and tension | specimen failure | n. a. |
| 11 | pressure-compression | 100 bar | Specimen failure |
| 12 | pressure-compression | 200 bar | Specimen failure |
| 13 | pressure-compression | 50 bar | Specimen failure |
| 14 | pressure-compression | 150 bar | Specimen failure |
| 15 | compression-pressure | -10 kN | puncture of matrix |
| 16 | compression-pressure | -20 kN | puncture of matrix |
| 17 | compression-pressure | -15 kN | puncture of matrix |
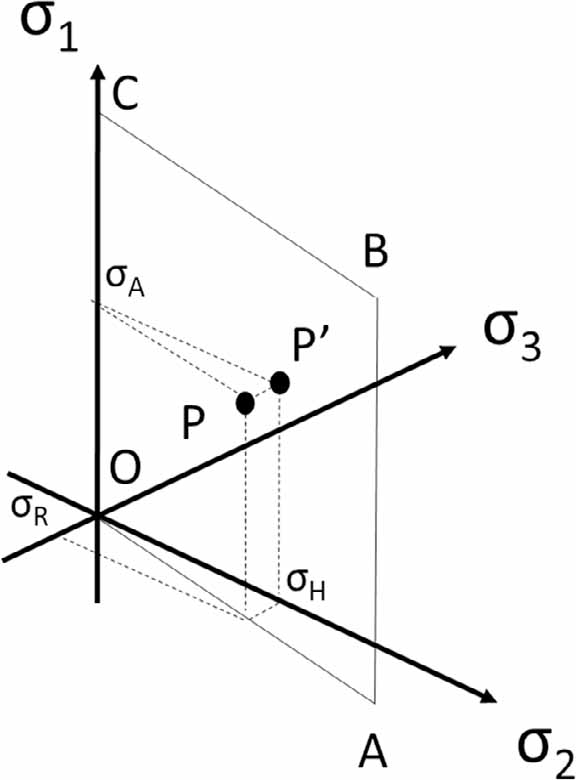
Figure 7.
Loading plane in the stress space, with point P representing failure stress state.
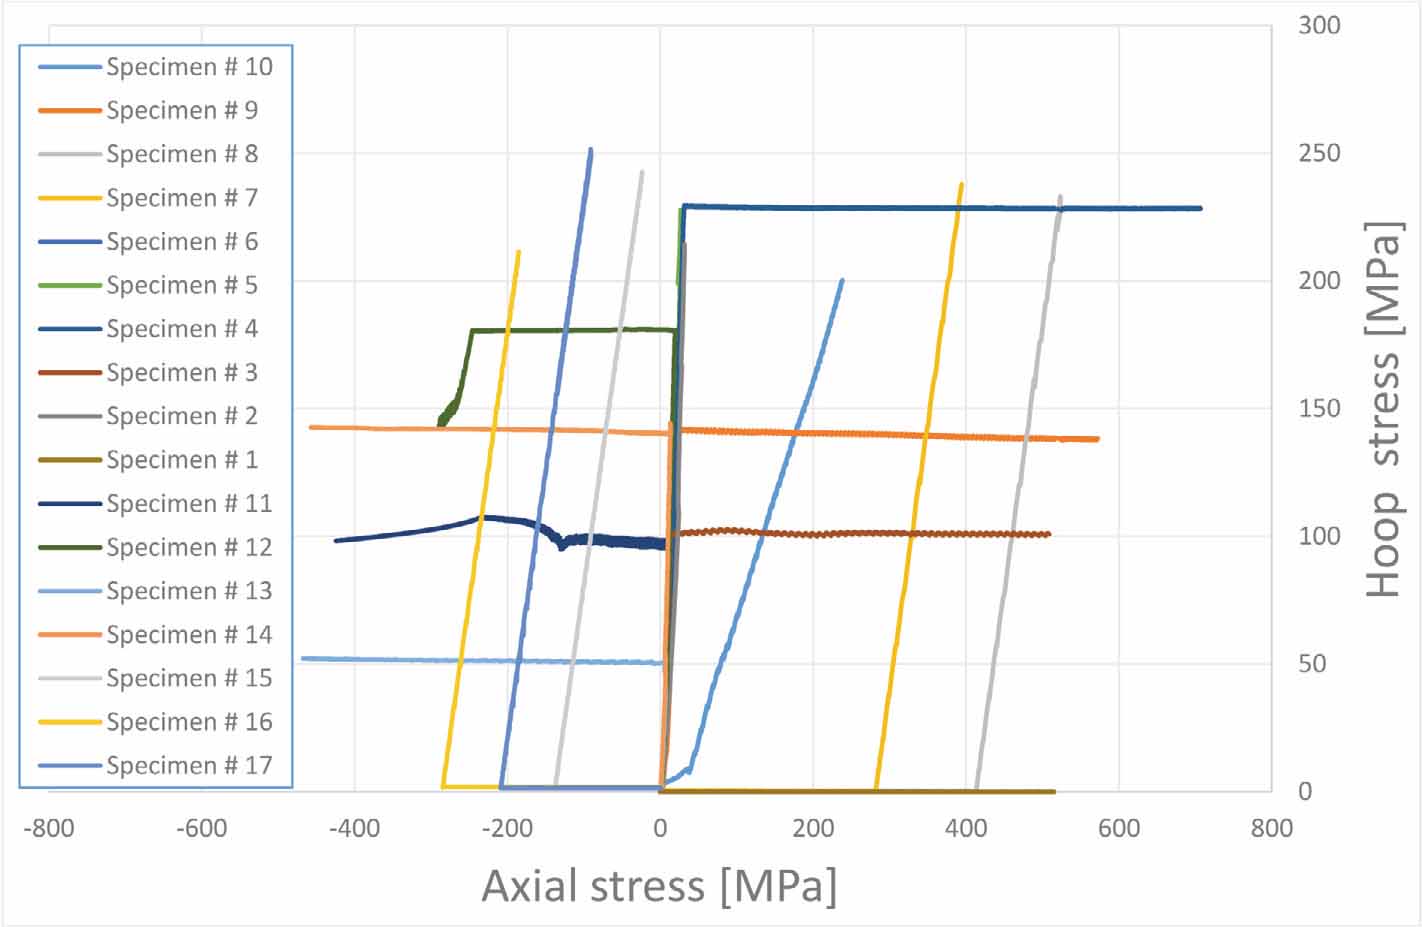
Figure 8.
Stress paths realized during the testing program.
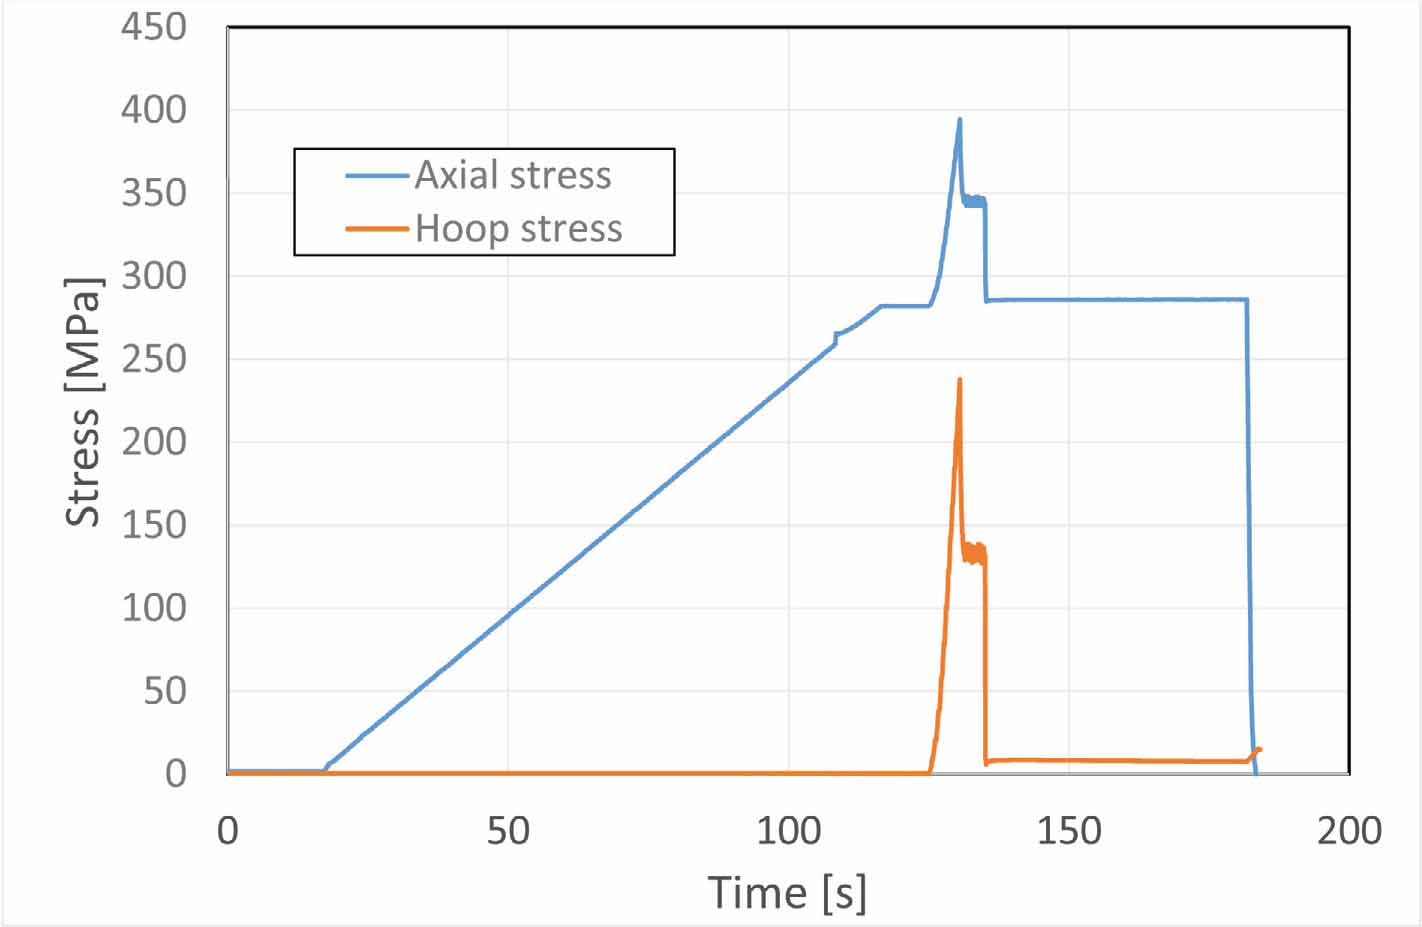
Figure 9.
Plot of axial and hoop stress vs. time during test number 7.
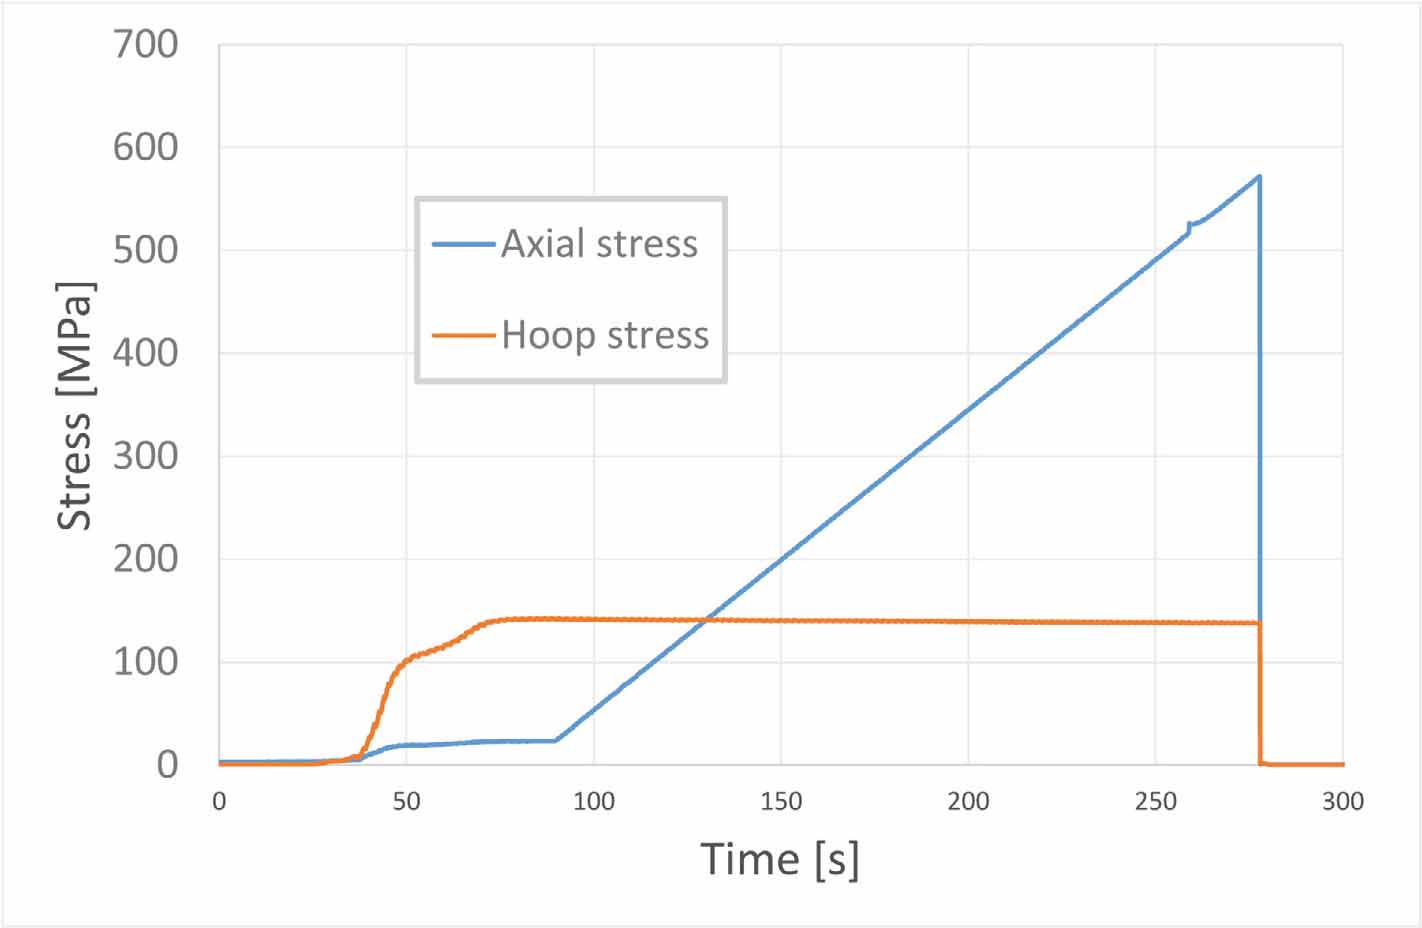
Figure 10.
Axial and hoop stress variations for specimen number 9.
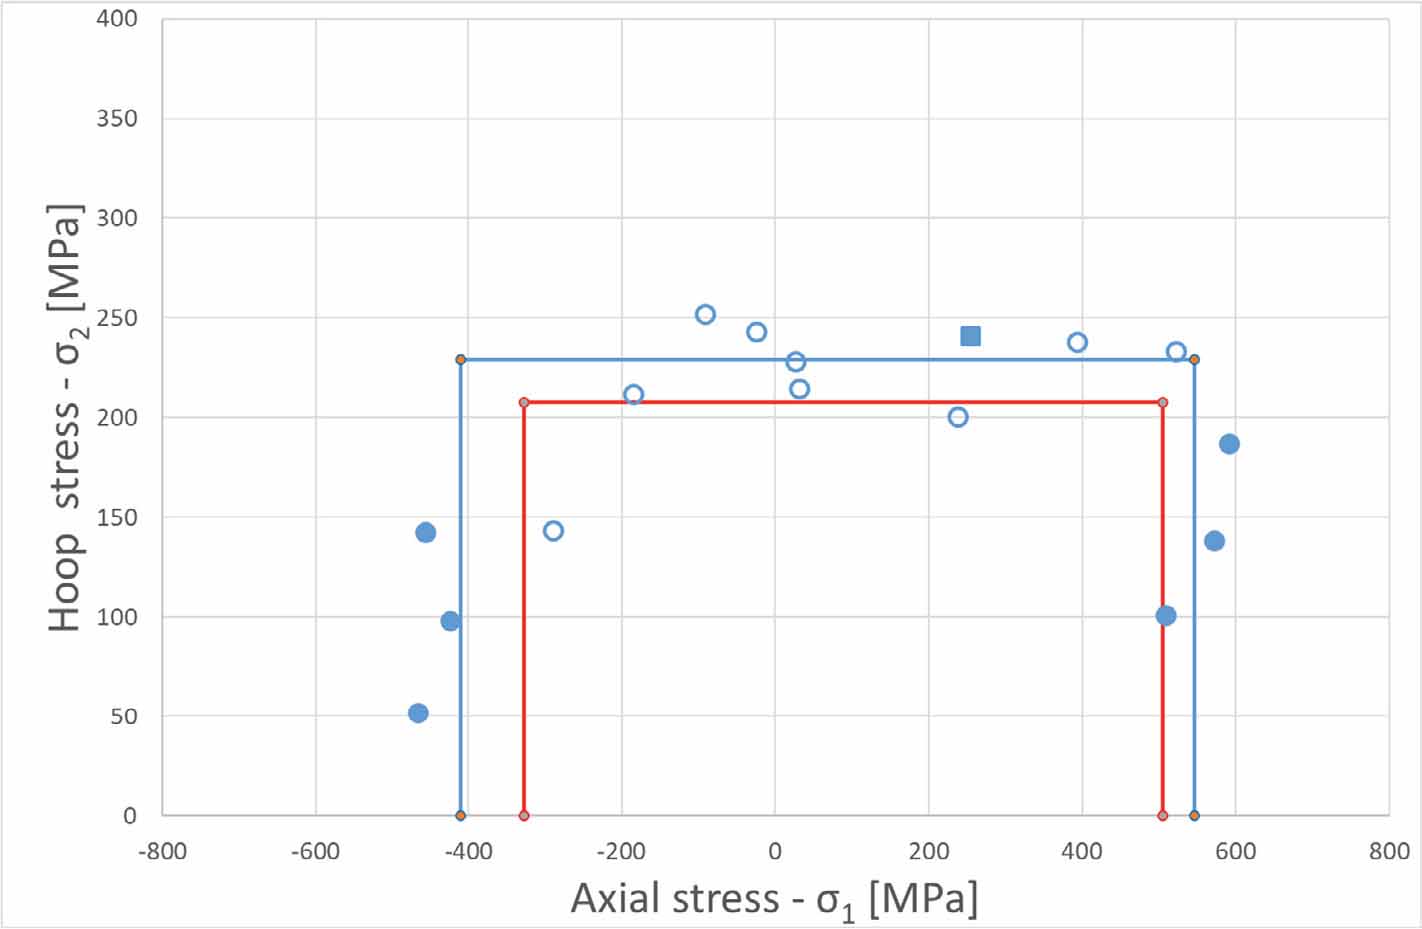
Figure 11.
Limit lines at the axial-hoop stress plane.
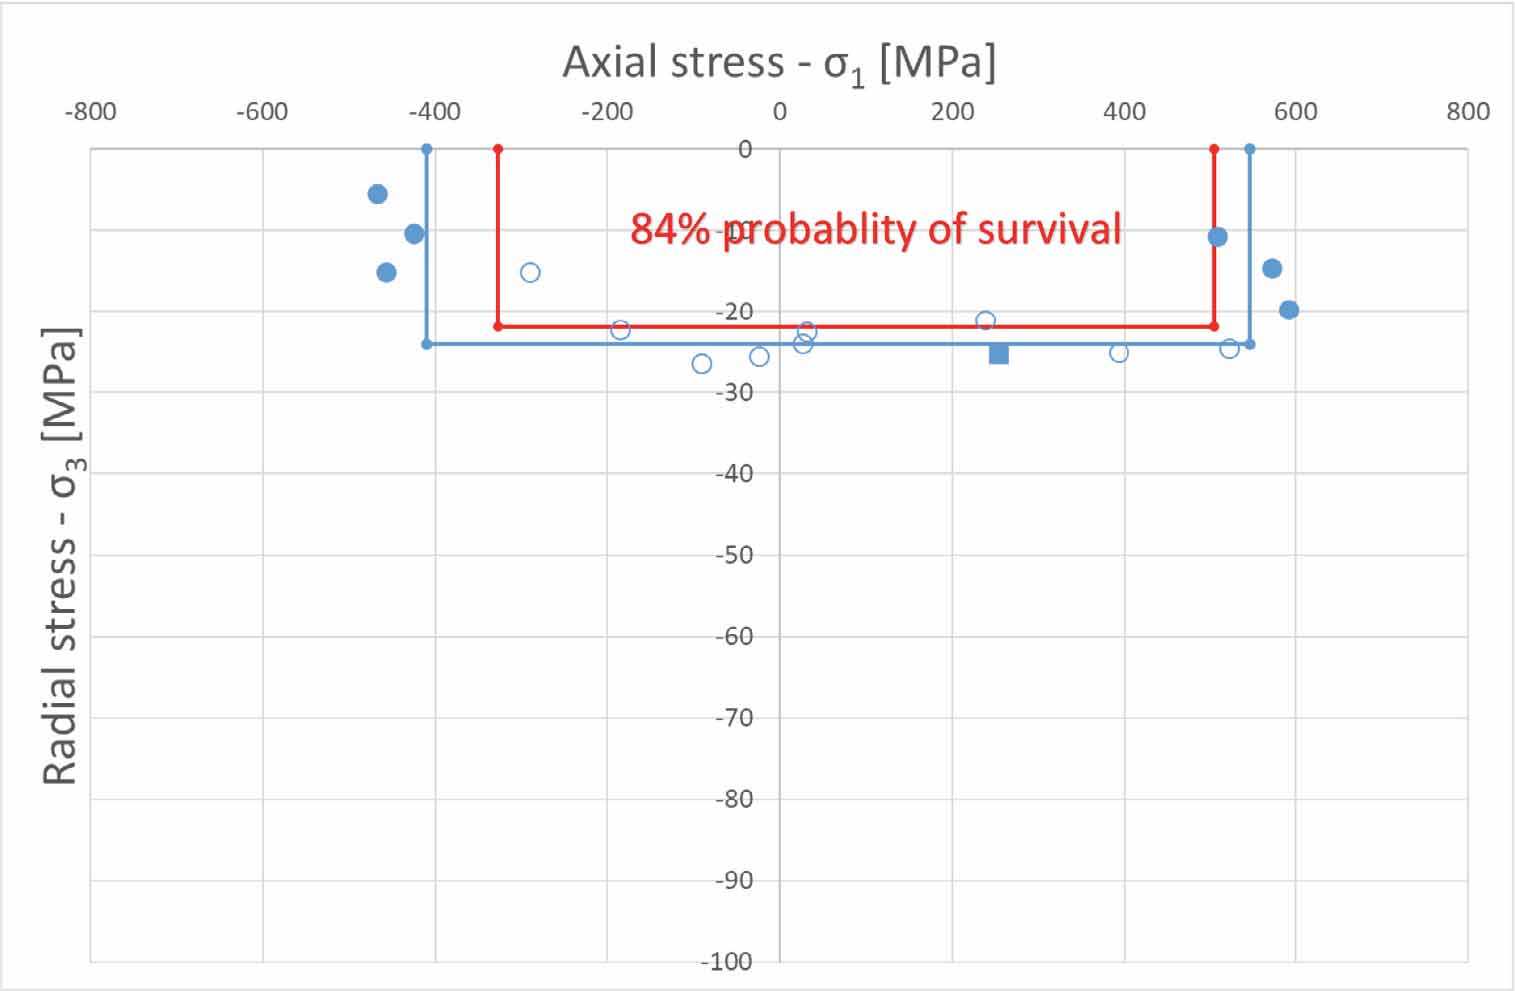
Figure 12.
Limit lines at the radial-axial stress plane.
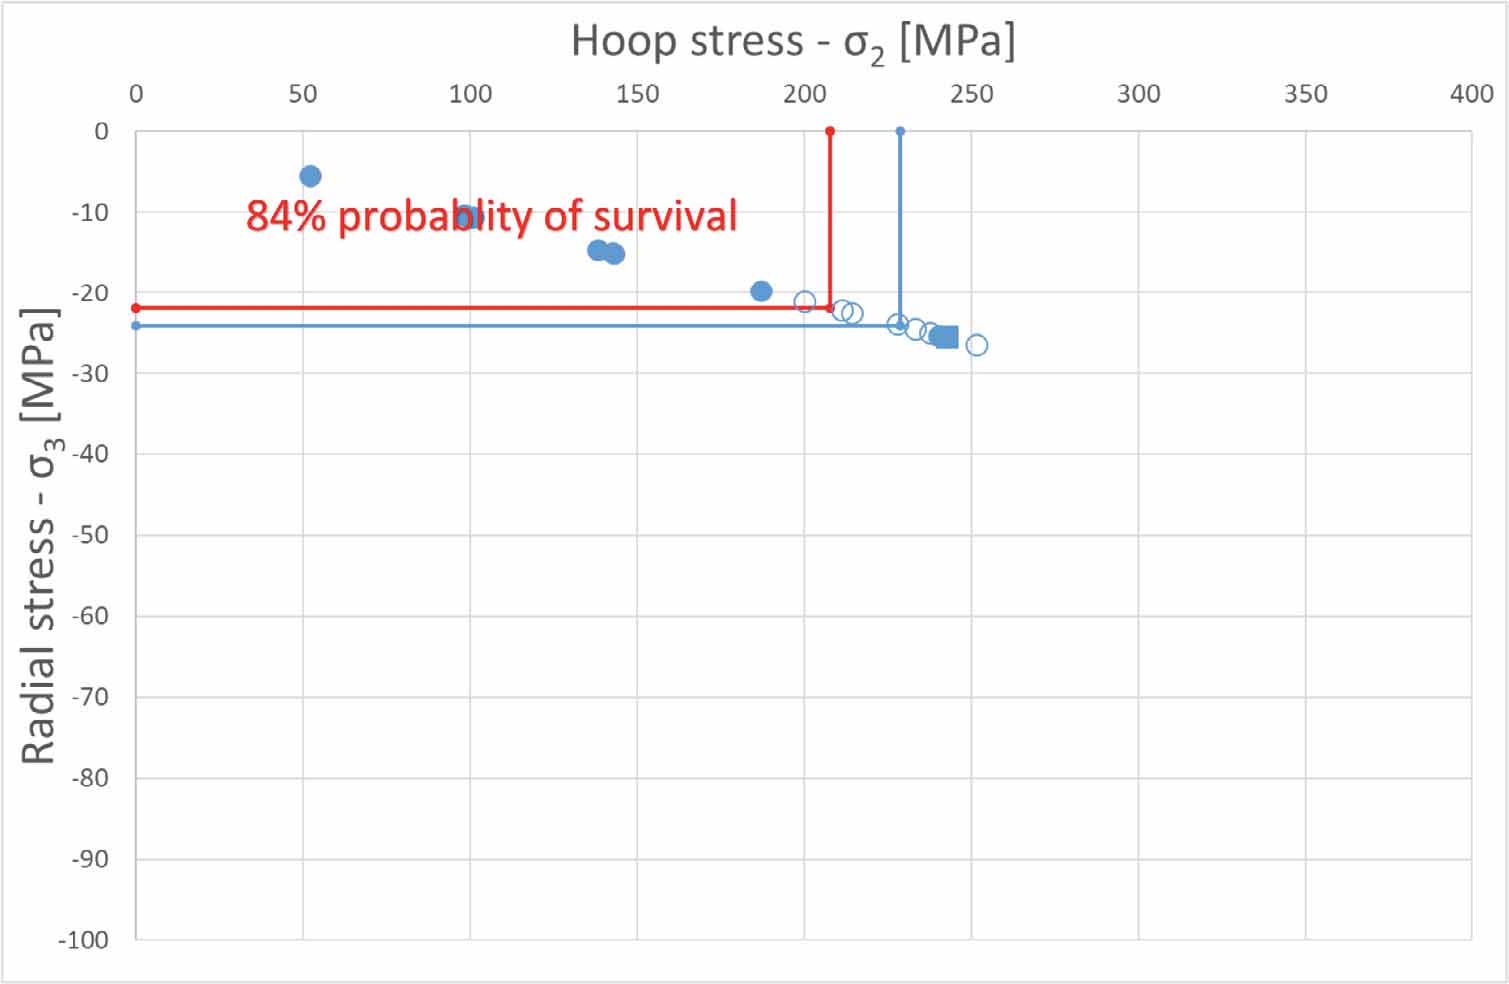
Figure 13.
Limit lines at the radial-hoop stress plane.
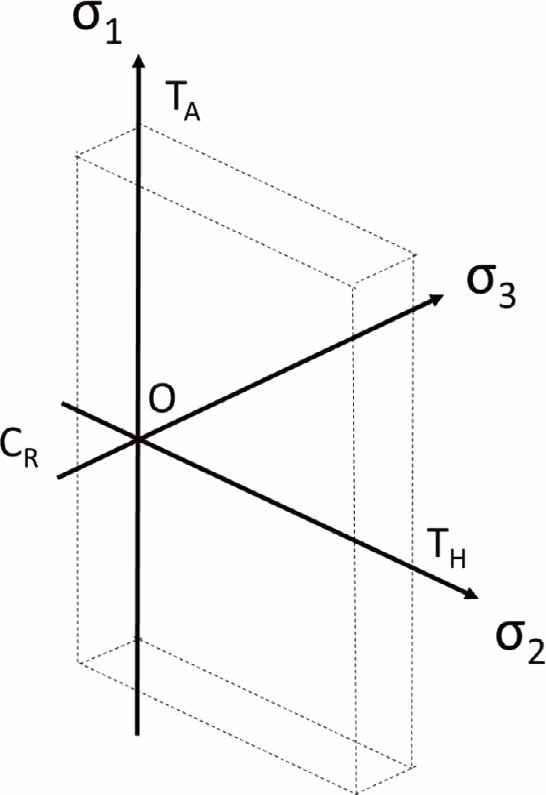
Figure 14.
Failure surface in the principal stress space.